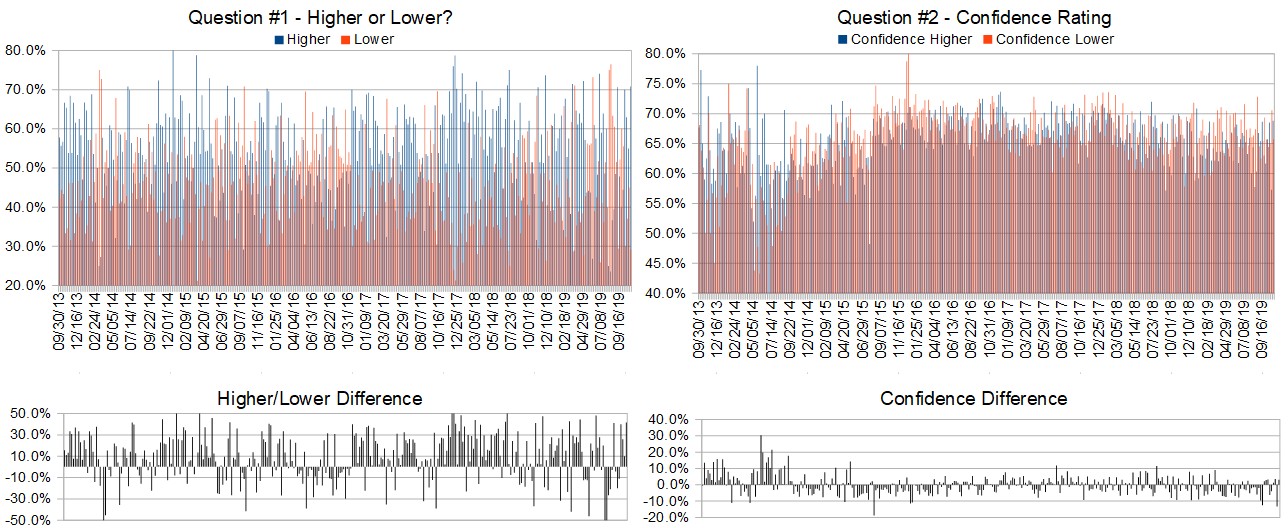
Crowd Forecast News Report #318
AD: Cancel your plans Tuesday night, watch this instead.
The new TimingResearch report for the week has been posted, you can download the full PDF report with the link below or you can read the full report in this post below.
Click here to download report in PDF format: TRReport102719.pdf
Question #1. Which direction do you think the S&P500 index will move from this coming Monday’s open to Friday’s close (October 28th to November 1st)?
The order of possible responses to this question on the survey were randomized for each viewer.)
Higher: 70.8%
Lower: 29.2%
Higher/Lower Difference: 41.7%
Question #2. Rate your confidence in your answer to Question #2 by estimating the probability you have correctly predicted next week’s market move.
Average of All Responses: 67.9%
Average For “Higher” Responses: 68.8%
Average For “Lower” Responses: 65.7%
Higher/Lower Difference: 3.1%
Responses Submitted This Week: 24
52-Week Average Number of Responses: 35.6
TimingResearch Crowd Forecast Prediction: 64% Chance Higher
This prediction is an attempt by the editor of this newsletter to use the full 5 year history of data collected from this project to forecast a probability estimate for whether this week’s sentiment is going to be correct and ultimately what the markets will do this coming week.
Details: Last week’s majority sentiment from the survey was 55.0% Higher, and the Crowd Forecast Indicator prediction was 58% Chance Higher; the S&P500 closed 0.87% Higher for the week. This week’s majority sentiment from the survey is 70.8% Higher with a greater average confidence from those who responded Higher. Similar conditions have occurred 83 times in the previous 317 weeks, with the majority sentiment (Higher) being correct 64% of the time and with an average S&P500 move of 0.30% Higher for the week. Based on that history, the TimingResearch Crowd Forecast Indicator is forecasting a 64% Chance that the S&P500 is going to move Higher this coming week.
Raw Data Page (raw data files include full history spreadsheet and the above charts):
TimingResearch.com/data.
AD: Cancel your plans Tuesday night, watch this instead.
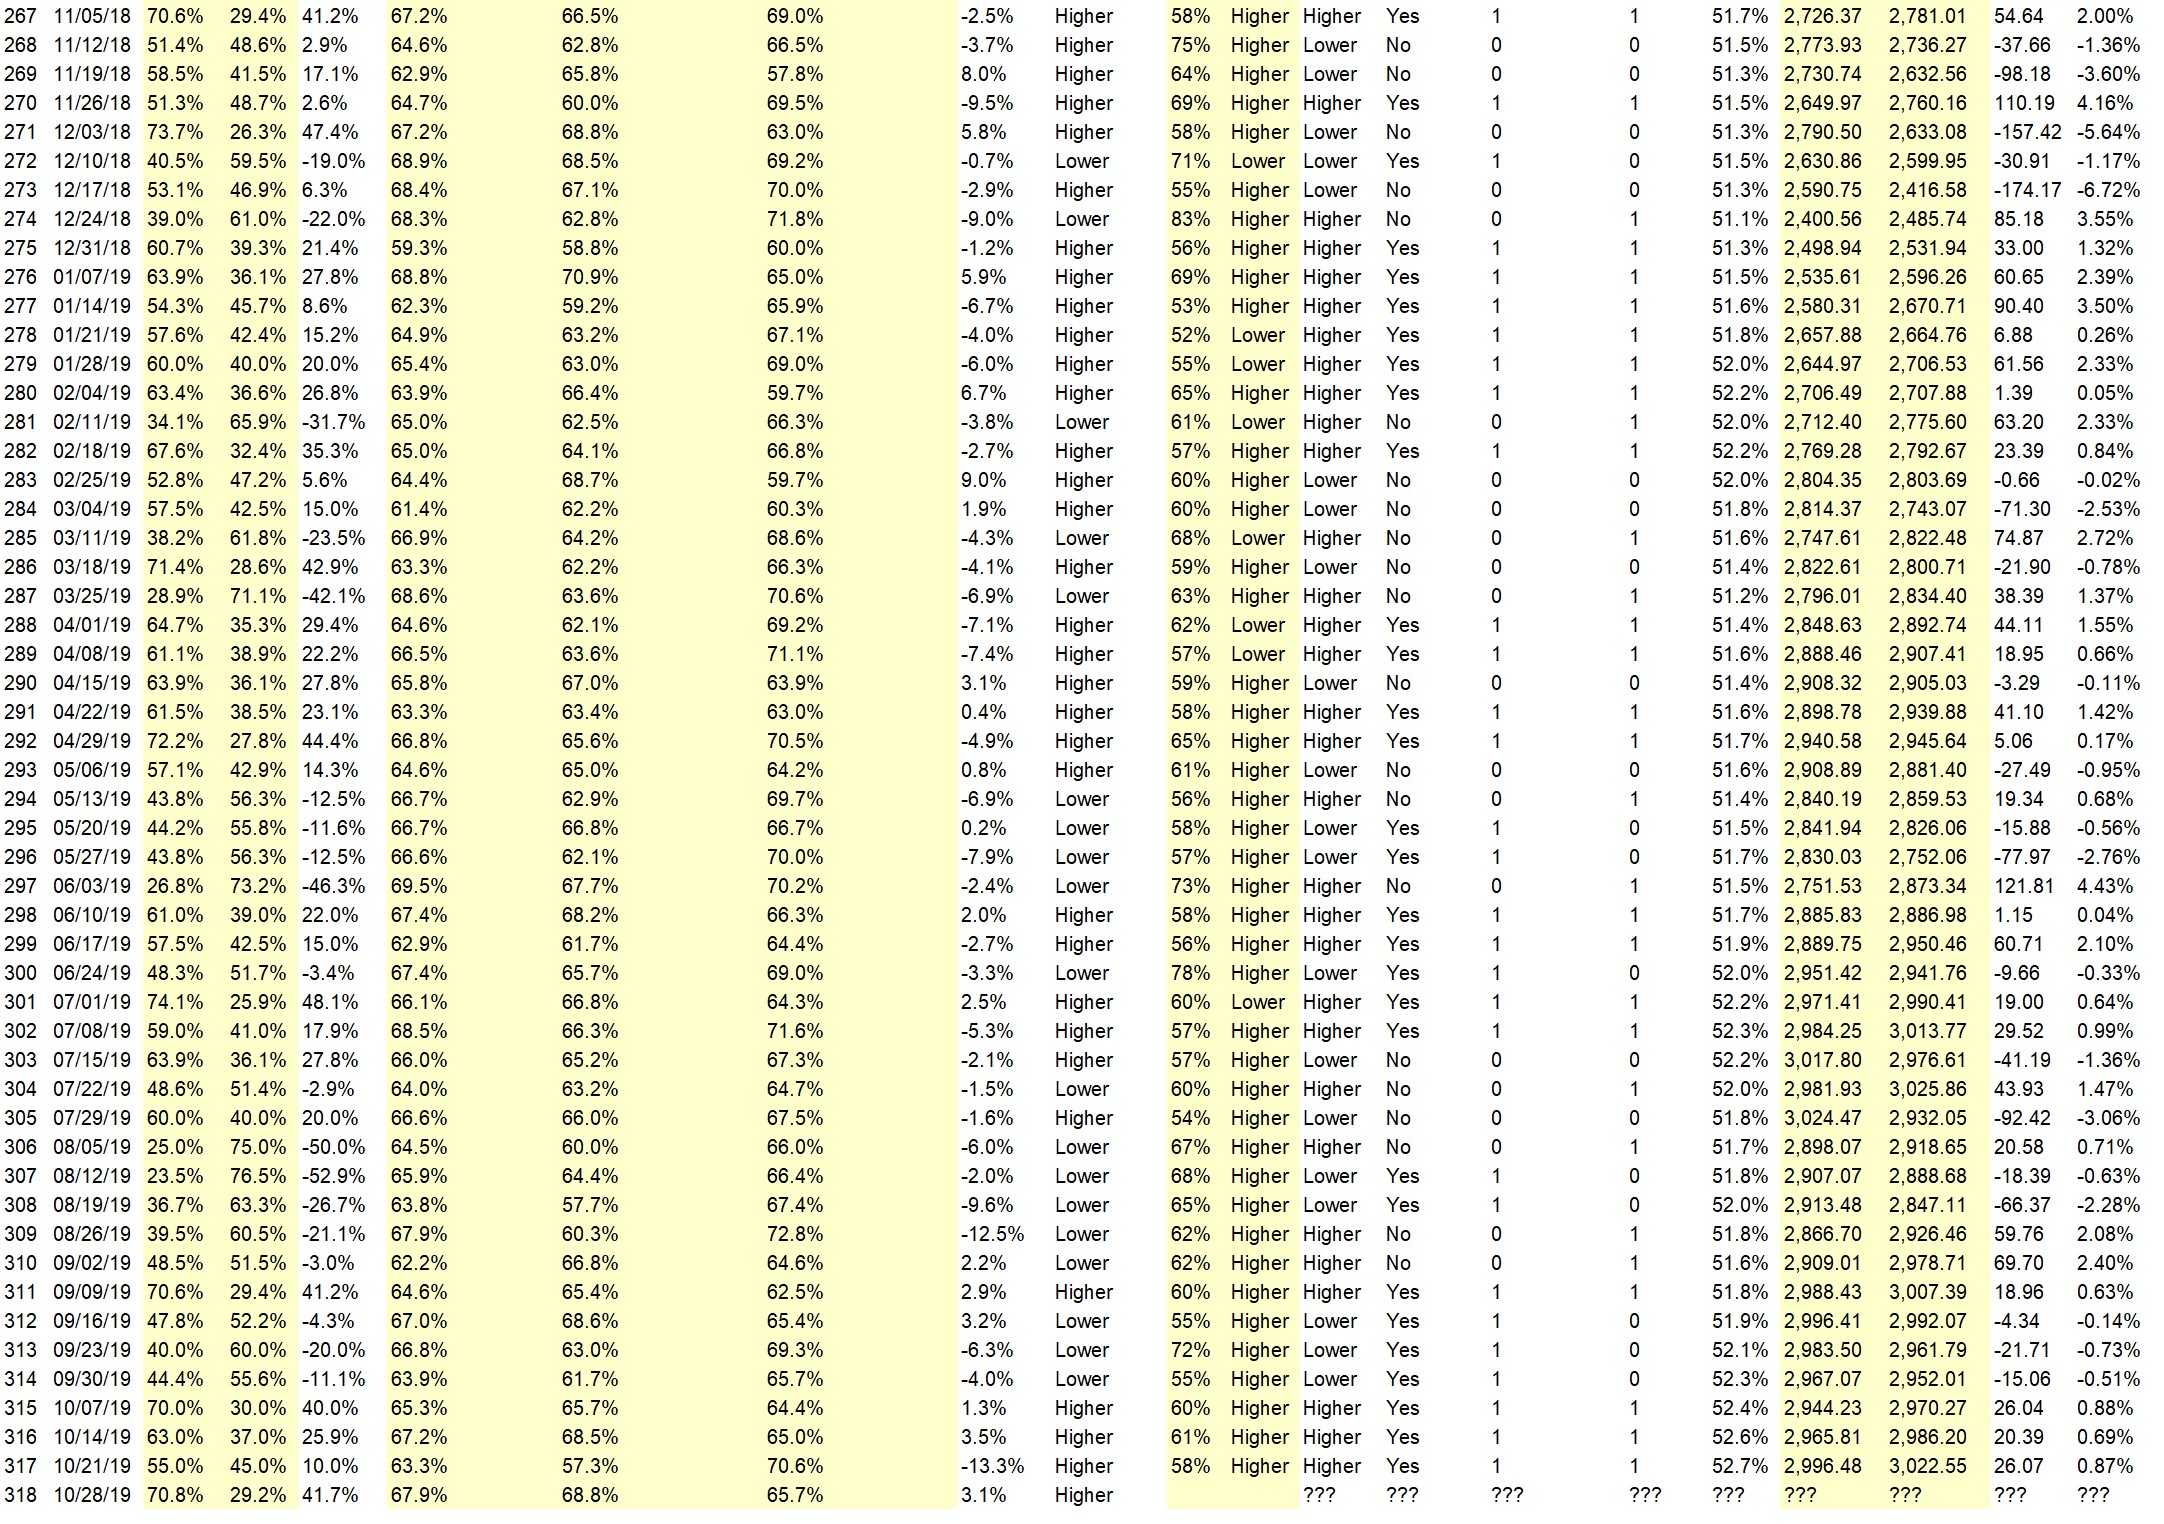
Full Weekly Results (full version of this chart available in the raw data spreadsheet for this week, “Date” field below lists the Monday of the week being predicted).
Overall Sentiment All-Time “Correct” Percentage: 52.7%
Overall Sentiment 52-Week “Correct” Percentage: 58.8%
Overall Sentiment 12-Week “Correct” Percentage: 81.8%
Only the previous 52 weeks of data are shown below, please download the raw data to see the full range of past data.
Weekly Reports Page: TimingResearch.com/reports
Raw Data Page: TimingResearch.com/rawdata
Current Survey Page: TimingResearch.com/currentsurvey
Any feedback: TimingResearch.com/contact
Email Alerts
Make sure you don’t miss all the future reports, show reminders, and bonus offers from TimingResearch, enter your email here:
By signing up you agree to receive newsletter and alert emails. You can unsubscribe at any time. Privacy Policies
NOTE: The following open-ended answers are solely the opinions of the anonymous respondents to this survey. Responses are mostly unedited, but some have been reformatted slightly for to make them easier to read. Some irrelevant responses (e.g. “none”), or anything obviously fake, or copy and pasted responses have been omitted. All-caps responses have been changed to all lowercase. All responses for each week, unedited, are available in the raw data spreadsheets at TimingResearch.com/data.
Question #3. For your answer to Question #1, please share what specific reason(s) you think the S&P500 will be heading the direction you chose.
“Higher” Respondent Answers:
• Phone
• Better economic news
• breaking out
• Companies beating earnings expectations.
• trend
• Earnings were higher
• timing, seasonality, people are too bearish
• The market rose last week, which was an important week for earnings. So, the odds this coming week are for continuation of the uptrend.
• Momentum, chart pattern
• Trump wont let it sink
• Earnings
• Market has rebounded from every bad news imaginable
• seasonalities
• Market has rebounded from every type of bad news
“Lower” Respondent Answers:
• At the top and feel growth in earnings and cap spending will slw
AD: Cancel your plans Tuesday night, watch this instead.
Question #4. What indicator influences your trading the most?
• Right now yield curve
• moving averages
• Stocks above 200 MA.
• Momentum
• RSI
• RSI 14 daily and weekly
• Bollinger bands; MACD
• 5…50…200 EMA
• RSI
• DJIA
• none
• DJIA
• overall there are many red flags
Question #5. Additional Comments/Questions/Suggestions?
• FOMO is in play
Join us for this week’s shows:
Crowd Forecast News Episode #243
This week’s show will feature a discussion with the trading experts listed below about the most recent TimingResearch Crowd Forecast Newsletter report, where they think the S&P500 is headed, what they are watching for in the markets currently, and their best trading idea.
Date and Time:
– Monday, October 28th, 2019
– 1PM ET (10AM PT)
Moderator and Guests:
– Norman Hallett of TheDisciplinedTrader.com
– Jake Bernstein of Trade-Futures.com
– Jim Kenney of OptionProfessor.com (moderator)
Analyze Your Trade Episode #100
When you register, you will be prompted to list the top 5 stocks that you are interested in trading. We will list the top 5 from all registrants and our experts will be prepared to offer their opinions on these trades.
Date and Time:
– Tuesday, October 29th, 2019
– 4PM ET (1PM PT)
Moderator and Guests:
– Dean Jenkins of FollowMeTrades.com
– Jim Kenney of OptionProfessor.com (moderator)
AD: Cancel your plans Tuesday night, watch this instead.


