Crowd Forecast News Report #255
The new TimingResearch report for the week has been posted, you can download the full PDF report with the link below or you can read the full report in this post below.
Click here to download report in PDF format: TRReport081218.pdf
Question #1. Which direction do you think the S&P500 index will move from this coming Monday’s open to Friday’s close (August 13th to August 17th)?
(The order of possible responses to this question on the survey were randomized for each viewer.)
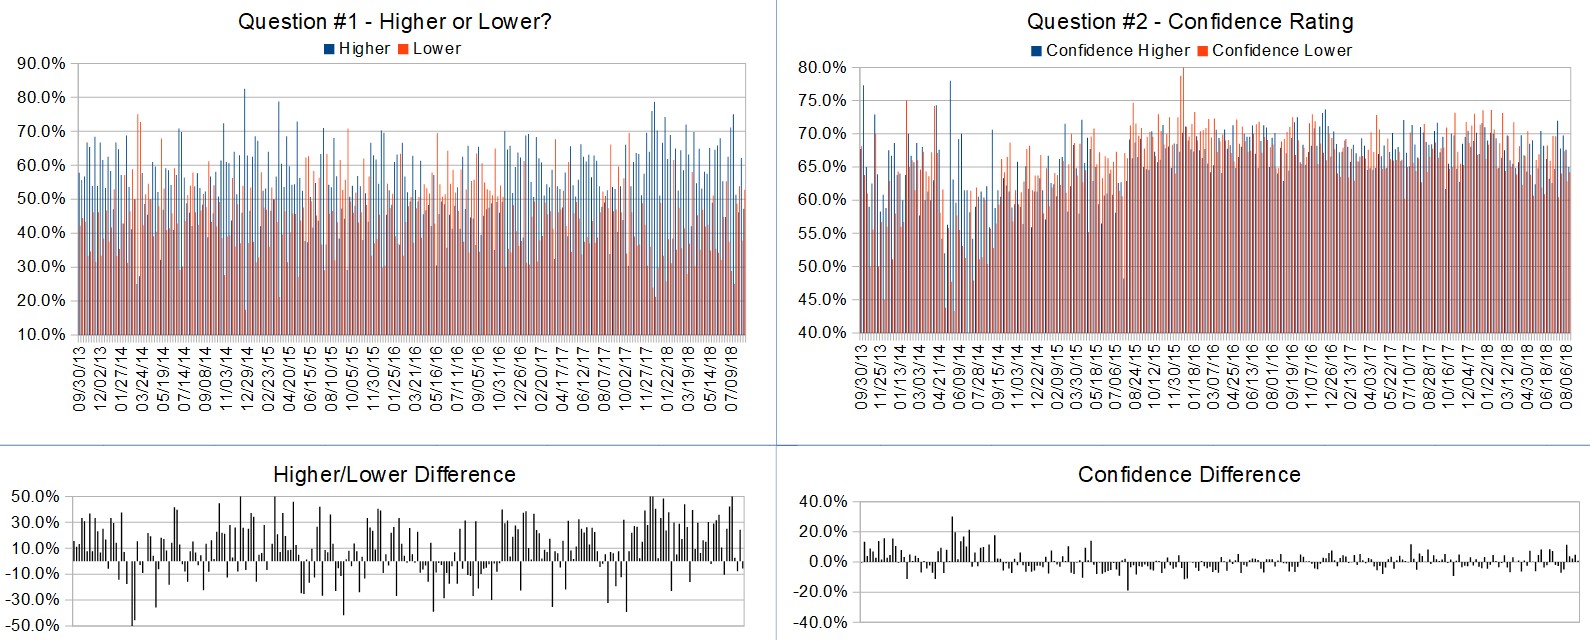
Higher: 47.2%
Lower: 52.8%
Higher/Lower Difference: -5.6%
Question #2. Rate your confidence in your answer to Question #2 by estimating the probability you have correctly predicted next week’s market move.
Average of All Responses: 64.6%
Average For “Higher” Responses: 65.0%
Average For “Lower” Responses: 64.2%
Higher/Lower Difference: 0.8%
Responses Submitted This Week: 39
52-Week Average Number of Responses: 49.4
TimingResearch Crowd Forecast Prediction: 65% Chance Higher
This prediction is an attempt by the editor of this newsletter to use the full 4+ year history of data collected from this project to forecast a probability estimate for whether this week’s sentiment is going to be correct and ultimately what the markets will do this coming week.
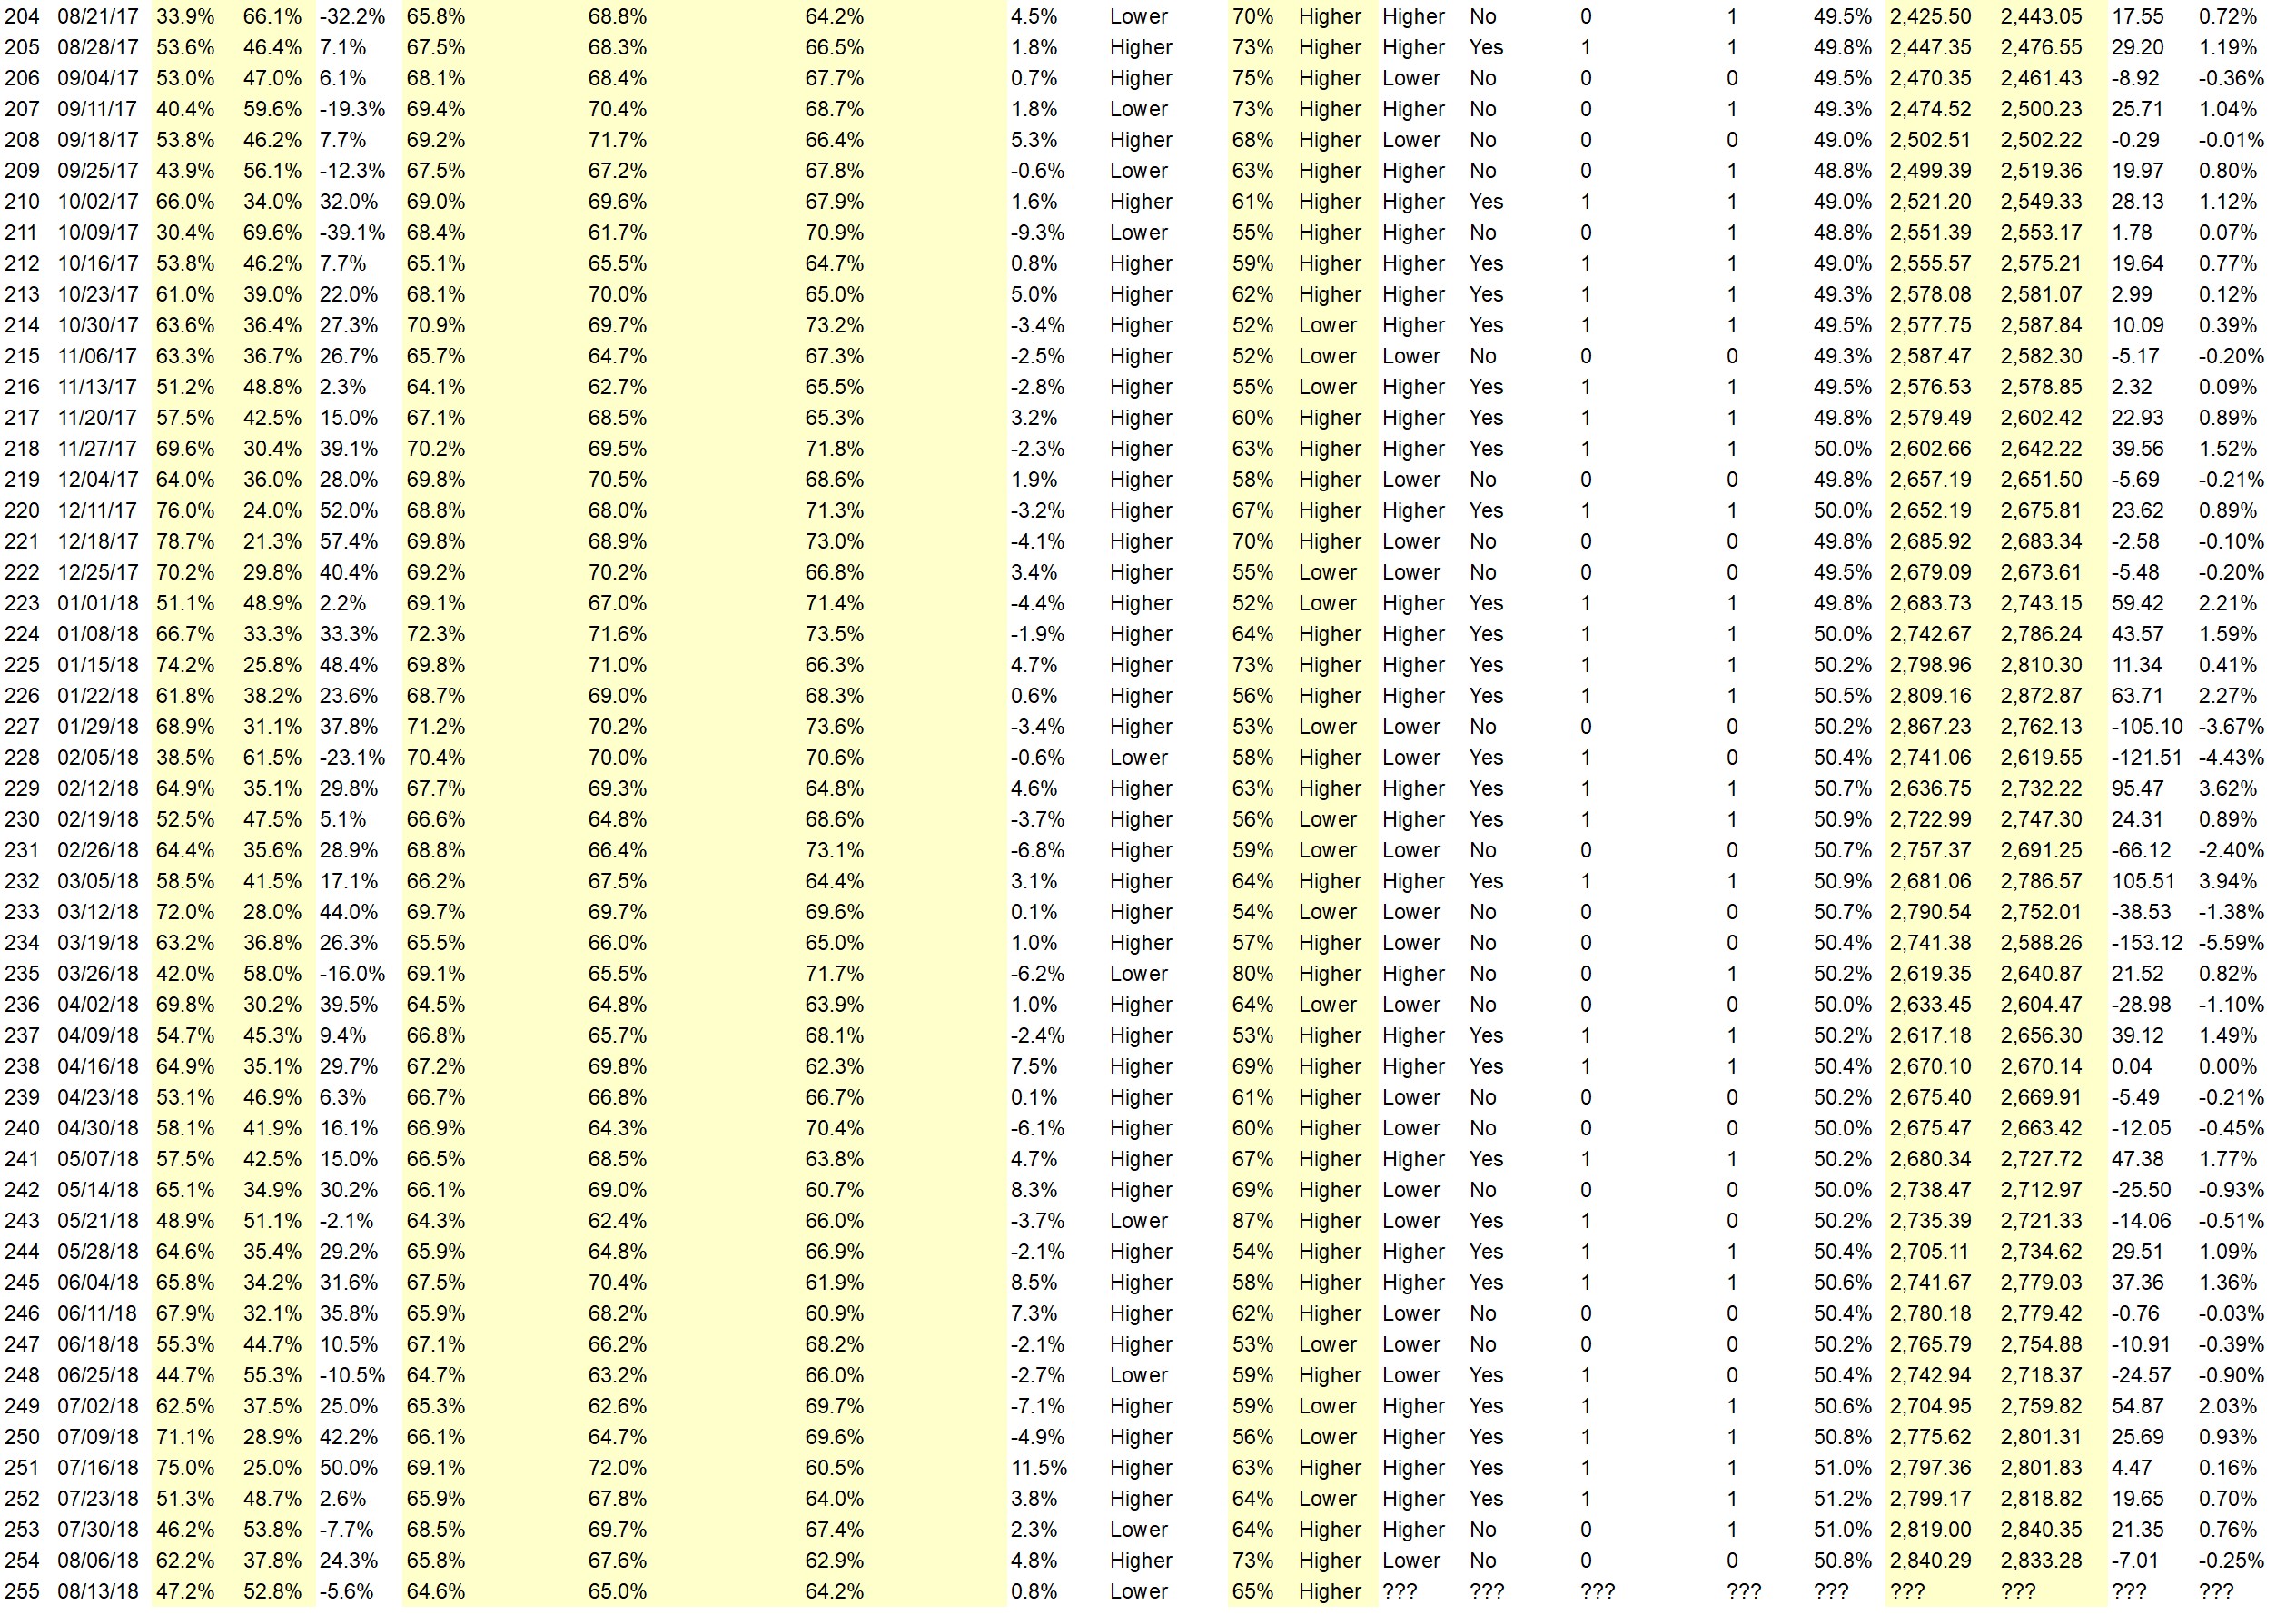
Details: Last week’s majority sentiment from the survey was 62.2% Higher, and the Crowd Forecast Indicator prediction was 73% Chance Higher; the S&P500 closed 0.25% Lower for the week. This week’s majority sentiment from the survey is 52.8% Higher with a greater average confidence from those who responded Higher. Similar conditions have been observed 34 times in the previous 254 weeks, with the majority sentiment being correct 65% of the time, with an average S&P500 move of 0.17% Higher for the week. Based on that history, the TimingResearch Crowd Forecast Indicator is forecasting a 65% Chance that the S&P500 is going to move Higher this coming week.
Full Weekly Results (full version of this chart available in the raw data spreadsheet for this week, “Date” field below lists the Monday of the week being predicted).
Overall Sentiment All-Time “Correct” Percentage: 50.8%
Overall Sentiment 52-Week “Correct” Percentage: 54.9%
Overall Sentiment 12-Week “Correct” Percentage: 63.6%
Only the previous 52 weeks of data are shown below, please download the raw data to see the full range of past data.
Weekly Reports Page: TimingResearch.com/reports
Raw Data Page: TimingResearch.com/rawdata
Current Survey Page: TimingResearch.com/currentsurvey
Any feedback: TimingResearch.com/contact
Email Alerts
Make sure you don’t miss all the future reports, show reminders, and bonus offers from TimingResearch, enter your email here:
By signing up you agree to receive newsletter and alert emails. You can unsubscribe at any time. Privacy Policies
NOTE: The following open-ended answers are solely the opinions of the anonymous respondents to this survey. Responses are mostly unedited, but some have been reformatted slightly for to make them easier to read. Some irrelevant responses (e.g. “none”), or anything obviously fake, or copy and pasted responses have been omitted. All-caps responses have been changed to all lowercase. All responses for each week, unedited, are available in the raw data spreadsheets at TimingResearch.com/data.
Question #3. For your answer to Question #1, please share what specific reason(s) you think the S&P500 will be heading the direction you chose.
“Higher” Respondent Answers:
• I’m not good on market direction.
• There is a law ? rule ? that the direction the market is in , it is MOST LIKELY to stay in that direction.
• I think stocks will remain close to unchanged as it was this week. About 0.34% higher. Too many geopolitical events in the world to rock the market. And August is usually a very slow month for stocks. I look for better things in September and October.
• The past couple days S&P took a slight pullback so Next week will rally up
• Economic job indicators are ok still maybe alittle or not really bad now
• The S&P500 & other major indices are holding their support & 10/20d ema levels during pullbacks. This, along with strong earnings continuing to be reported, lead me to look for continued strength in the markets.
• S&P 500 Looks like a test of all time high is coming.
• Uptrend has been too powerful to end so quickly. This recent pullback is just a pullback in an uptrend.
• Trend is your friend oil on the way up. Gold Joins in.
“Lower” Respondent Answers:
• Market peaked out
• Volatility, foreign markets
• fridays selloff
• Elliott Wave 4
• late summer doldrums
• Tariffs
• falling momentum
• Turkish Lira issues impacting European banks Increasing trade tensions
• Earnings calls are over. Interest rates are rising. Yield curve is inverting. Trade and shooting wars are in the air. Hardly a time to invest.
• more than likely world events will push mkt down…
• The downside correction will continue. The institutional favorites and looking to top out. Retail stocks should show weakness this week.
• Reality returning to the overvalued tech sector.
• History of the market
• Price may be high by mid week but it should then sell and be down at close of the week
Question #4. Which do you think is best, trading one methodology or system all the time or trading multiple strategies that adapt to the markets? Why?
• Multiple strategies to mitigate the risk
• You need as some one that makes lots money. That is not me.
• trend following works for me
• the 2nd. That way you are always trading with the trend direction.
• multiple
• multiple strategies that best fit the current market conditions
• A stop loss
• Adapt to market or be swallowed up in losses.
• I think it’s best to trade one methodology that adapts to the markets. :-)
• Sentiment from headlines
• Multiple strategies. Attempting to trade against the prevailing trend is most often like holding back the tide.
• The latter. There should be a different strategy for an uptrend and a different strategy for a downtrend. Because one is not simply the mirror image of the other. Markets behave differently in uptrends than in downtrends. For example, V bottoms are common but we don’t see V tops very often. Instead we see rounded tops.
• Adapt to market. You have to trade what the market gives you.
• multiple strategies, because if the set up is not right for one, maybe it’ll be right for others…
• Multiple strategies. Markets CHANGE!
• I still believe in trading one methodology/system but one that does adapt to the markets gyrations.
• Option trading
• Subject to time frame and style of trading.
Question #5. Additional Comments/Questions/Suggestions?
• None
Join us for this week’s shows:
Crowd Forecast News Episode #192
This week’s show will feature a discussion with the trading experts listed below about the most recent TimingResearch Crowd Forecast Newsletter report, where they think the S&P500 is headed, what they are watching for in the markets currently, and their best trading idea.
Date and Time:
– Monday, August 13th, 2018
– 1PM ET (10AM PT)
Moderator and Guests:
– Dave Landry of DaveLandry.com (moderator)
– Jim Kenney of OptionProfessor.com
– Lance Ippolito of AlphaShark.com & TradingCoachLance.com
Analyze Your Trade Episode #45
When you register, you will be prompted to list the top 5 stocks that you are interested in trading. We will list the top 5 from all registrants and our experts will be prepared to offer their opinions on these trades.
Date and Time:
– Tuesday, August 14th, 2018
– 4:30PM ET (1:30PM PT)
Moderator and Guests:
– E. Matthew “Whiz” Buckley of TopGunOptions.com (moderator)
– Anka Metcalf of TradeOutLoud.com
– Christian Fromhertz of TribecaTradeGroup.com
Partner Offer:
In 2015, he claimed exactly $838,353 in capital gains. In four years – he turned $15,253 into $2,855,475. Watch Kyle Dennis’ presentation:
“Learn the 3-Step Plan I Used to Turn $15,253 into $2,855,475 Trading Biotech Stocks!“


