Crowd Forecast News Report #276
The new TimingResearch report for the week has been posted, you can download the full PDF report with the link below or you can read the full report in this post below.
Click here to download report in PDF format: TRReport010619.pdf
Partner Offer:
The Alpha Fibonacci Method works on any instrument, any time frame, and any platform with ultimate accuracy at trend inception and trend reversals. You’ll see how on this online training.
Question #1. Which direction do you think the S&P500 index will move from this coming Monday’s open to Friday’s close (January 7th to 11th)?
The order of possible responses to this question on the survey were randomized for each viewer.)
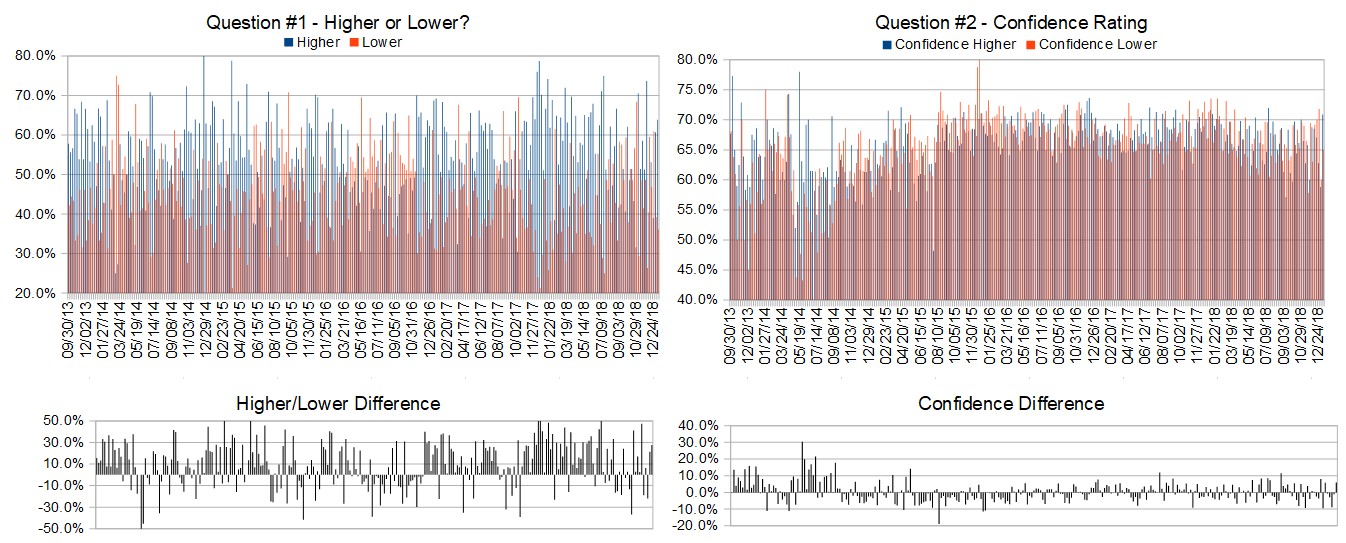
Higher: 63.9%
Lower: 36.1%
Higher/Lower Difference: 27.8%
Question #2. Rate your confidence in your answer to Question #2 by estimating the probability you have correctly predicted next week’s market move.
Average of All Responses: 68.8%
Average For “Higher” Responses: 70.9%
Average For “Lower” Responses: 65.0%
Higher/Lower Difference: 5.9%
Responses Submitted This Week: 38
52-Week Average Number of Responses: 43.5
TimingResearch Crowd Forecast Prediction: 69% Chance Higher
This prediction is an attempt by the editor of this newsletter to use the full 5 year history of data collected from this project to forecast a probability estimate for whether this week’s sentiment is going to be correct and ultimately what the markets will do this coming week.
Details: Last week’s majority sentiment from the survey was 60.7% Higher, and the Crowd Forecast Indicator prediction was 56% Chance Higher; the S&P500 closed 1.32% Higher for the week. This week’s majority sentiment from the survey is 63.9% Higher with a greater average confidence from those who responded Higher. Similar conditions have occurred 29 times in the previous 275 weeks, with the majority sentiment being correct 69% of the time and with an average S&P500 move of 0.19% Higher for the week. Based on that history, the TimingResearch Crowd Forecast Indicator is forecasting a 69% Chance that the S&P500 is going to move Higher this coming week.
Raw Data Page (raw data files include full history spreadsheet and the above charts):
TimingResearch.com/data.
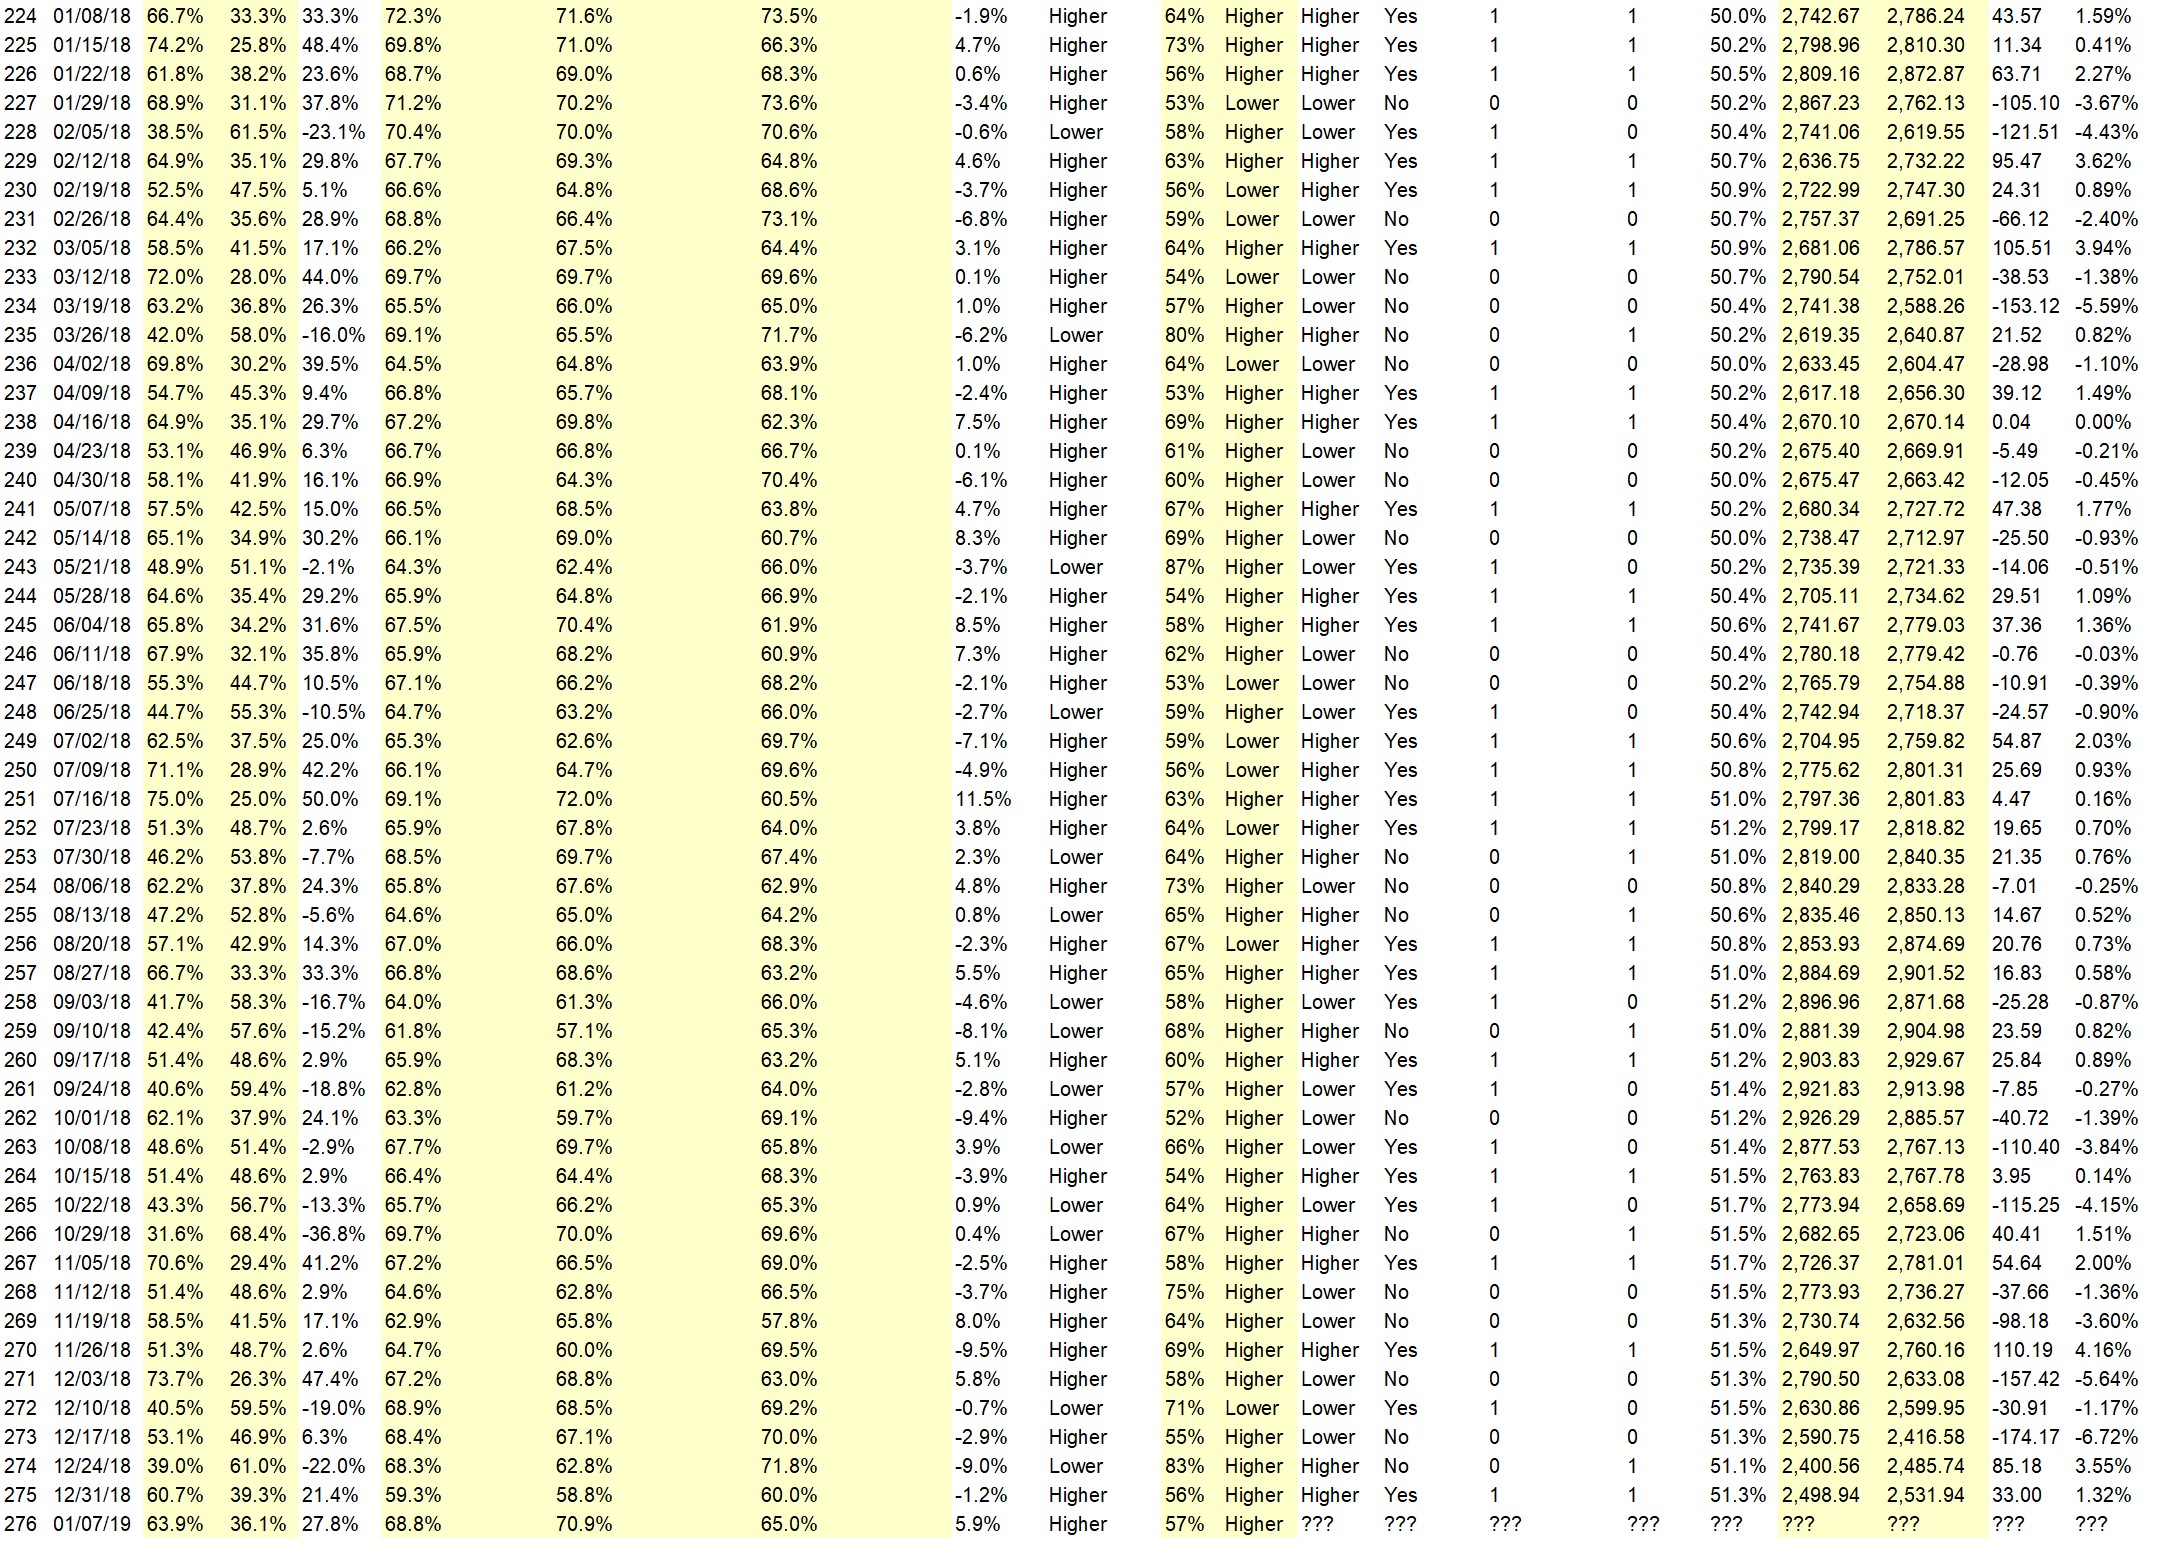
Full Weekly Results (full version of this chart available in the raw data spreadsheet for this week, “Date” field below lists the Monday of the week being predicted).
Overall Sentiment All-Time “Correct” Percentage: 51.3%
Overall Sentiment 52-Week “Correct” Percentage: 56.9%
Overall Sentiment 12-Week “Correct” Percentage: 45.5%
Only the previous 52 weeks of data are shown below, please download the raw data to see the full range of past data.
Weekly Reports Page: TimingResearch.com/reports
Raw Data Page: TimingResearch.com/rawdata
Current Survey Page: TimingResearch.com/currentsurvey
Any feedback: TimingResearch.com/contact
Email Alerts
Make sure you don’t miss all the future reports, show reminders, and bonus offers from TimingResearch, enter your email here:
By signing up you agree to receive newsletter and alert emails. You can unsubscribe at any time. Privacy Policies
NOTE: The following open-ended answers are solely the opinions of the anonymous respondents to this survey. Responses are mostly unedited, but some have been reformatted slightly for to make them easier to read. Some irrelevant responses (e.g. “none”), or anything obviously fake, or copy and pasted responses have been omitted. All-caps responses have been changed to all lowercase. All responses for each week, unedited, are available in the raw data spreadsheets at TimingResearch.com/data.
Question #3. For your answer to Question #1, please share what specific reason(s) you think the S&P500 will be heading the direction you chose.
“Higher” Respondent Answers:
• cause up
• New lows have disappeared and this week is historically up
• Some of the technicals (Fibonacci levels) indicate that next week will be up
• 1. Oversold last 2-3 months 2 Solution of China tax issues 3.January reinvestment/new funds 4. Easing of potential interest rate increase
• Historically best six months
• measured move down with a reversal up accompanied by 10 times up volume to down volume
• Market structure tells we are in a down trend. The market has already come down a lot so any upward move now is a short-term pullback.
• Blue chips have hit several times book value, the mark of bear market bottoms. Value buyers are coming in.
• momentum
• random up week in a down market
• Still looking for a move up to the next resistance of 2575 or a bit higher, before the market turns back down.
• volume
• Upmove was very strong I don’t think it’s over yet even if this might be just a bear market upmove.
“Lower” Respondent Answers:
• Sell programs
• Major down trend
• The reasons for the markets decline have not changed. The hope for change created strong short covering. The reality of “no” change will drive the markets lower again.
• We closed high on Friday and on Saturday we have a Solar Eclipse and Uranus goes direct, this normally means a reversal in the market not a continuation. Friday next week the Sun and Pluto goe into a conjunction often meaning a bottom.
• we hit the 20ema and feel we will head back down to re-test
• The downside correction continues until the public says “Just let me out”.
• market overbought
• needs to consolidate
• Downtrend continues
Partner Offer:
The Alpha Fibonacci Method works on any instrument, any time frame, and any platform with ultimate accuracy at trend inception and trend reversals. You’ll see how on this online training.
Question #4. What advice would you give and/or what resources would you recommend to someone who is new to trading?
• Learn about seasonality, market cycles, and sentiment.
• Learn skills first, then test them, then test them again.
• go in slowly-no rush unless you are sure and nobody is sure!
• finviz.com-investopedia.com–vixcentral.com-
• be a forever student
• go with your gut
• Study price action on twitter.
• Cut losses short
• McClellan oscillator don’t count on Santa
• coin flip
• Test everything thoroughly!
• Don’t get too influenced by news headlines. Learn candlestick charting.
• Learn how to read charts before you trade, especial candlesticks.
• There are way too many gurus out there. Just find some indicators you like (they don’t have to be unusual ones) and draw trendlines and look at support and resistance areas and keep your stops.
• Study the fundamentals first then the technicals
• Have a trading plan, always honor stops, and don’t exceed a preset daily loss limit
• study charts voraciously brush up math if needed go slow paper trade like you mean it open a small account – take real trades 1 lots so if it costs you commission so what, did you get you degree for free or even if scholarship, someone paid for it no pain no gain.enjoy it or do not bother-if its torture find a business you like and do that with the same described focus and attention.. this paragraph is copyrighted please do not use it publish it.. i will find it online ‘nopainnogain not included
• Stop trading
Question #5. Additional Comments/Questions/Suggestions?
• Study study study and sim trade for a long long long time to get the feel . Read some of the best books on investing and trading. Turn off the TV. Learn to read price action and order flow. Key in on the market forces that move prices and measure them.
• It may take longer than you think, but don’t give up.
• no
• thanks for your interest.
Both shows are back this week!
Crowd Forecast News Episode #209
This week’s show will feature a discussion with the trading experts listed below about the most recent TimingResearch Crowd Forecast Newsletter report, where they think the S&P500 is headed, what they are watching for in the markets currently, and their best trading idea.
Date and Time:
– Monday, January 7th, 2019
– 1PM ET (10AM PT)
Moderator and Guests:
– John Hoagland of TopstepTrader.com
– Jim Kenney of OptionProfessor.com
– Simon Klein of TradeSmart4x.com
– Rob Hanna of InvestiQuant.com & QuantifiableEdges.com (moderator)
Analyze Your Trade Episode #61
When you register, you will be prompted to list the top 5 stocks that you are interested in trading. We will list the top 5 from all registrants and our experts will be prepared to offer their opinions on these trades.
Date and Time:
– Tuesday, January 8th, 2019
– 4:30PM ET (1:30PM PT)
Moderator and Guests:
– TBA
Partner Offer:
The Alpha Fibonacci Method works on any instrument, any time frame, and any platform with ultimate accuracy at trend inception and trend reversals. You’ll see how on this online training.


