
Crowd Forecast News Report #347
[AD] • eBook: How To Profit From Earnings Announcements Using OptionsThe new TimingResearch report for the week has been posted, you can download the full PDF report with the link below or you can read the full report in this post below.
Click here to download report in PDF format: TRReport051720.pdf
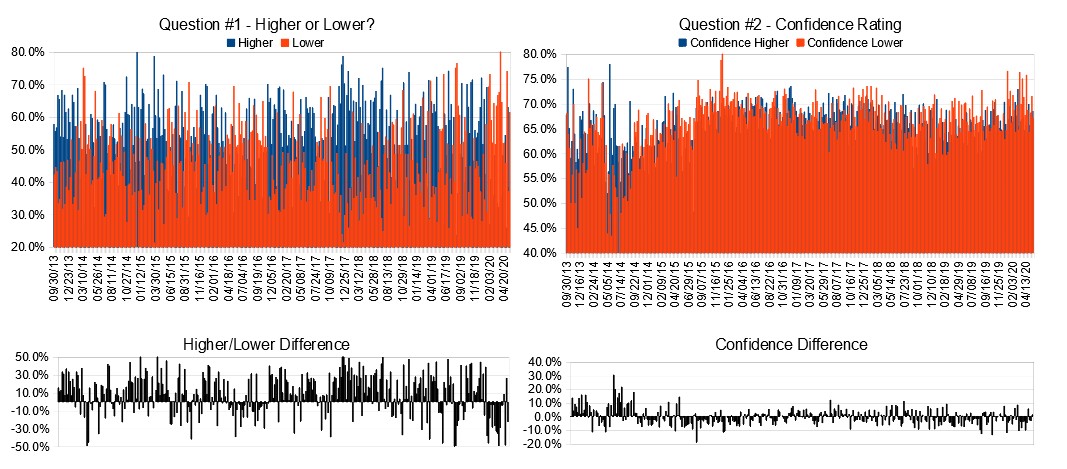
Question #1. Which direction do you think the S&P500 index will move from this coming Monday’s open to Friday’s close (May 18th to 22nd)?
Higher: 38.5%
Lower: 61.5%
Higher/Lower Difference: -23.1%
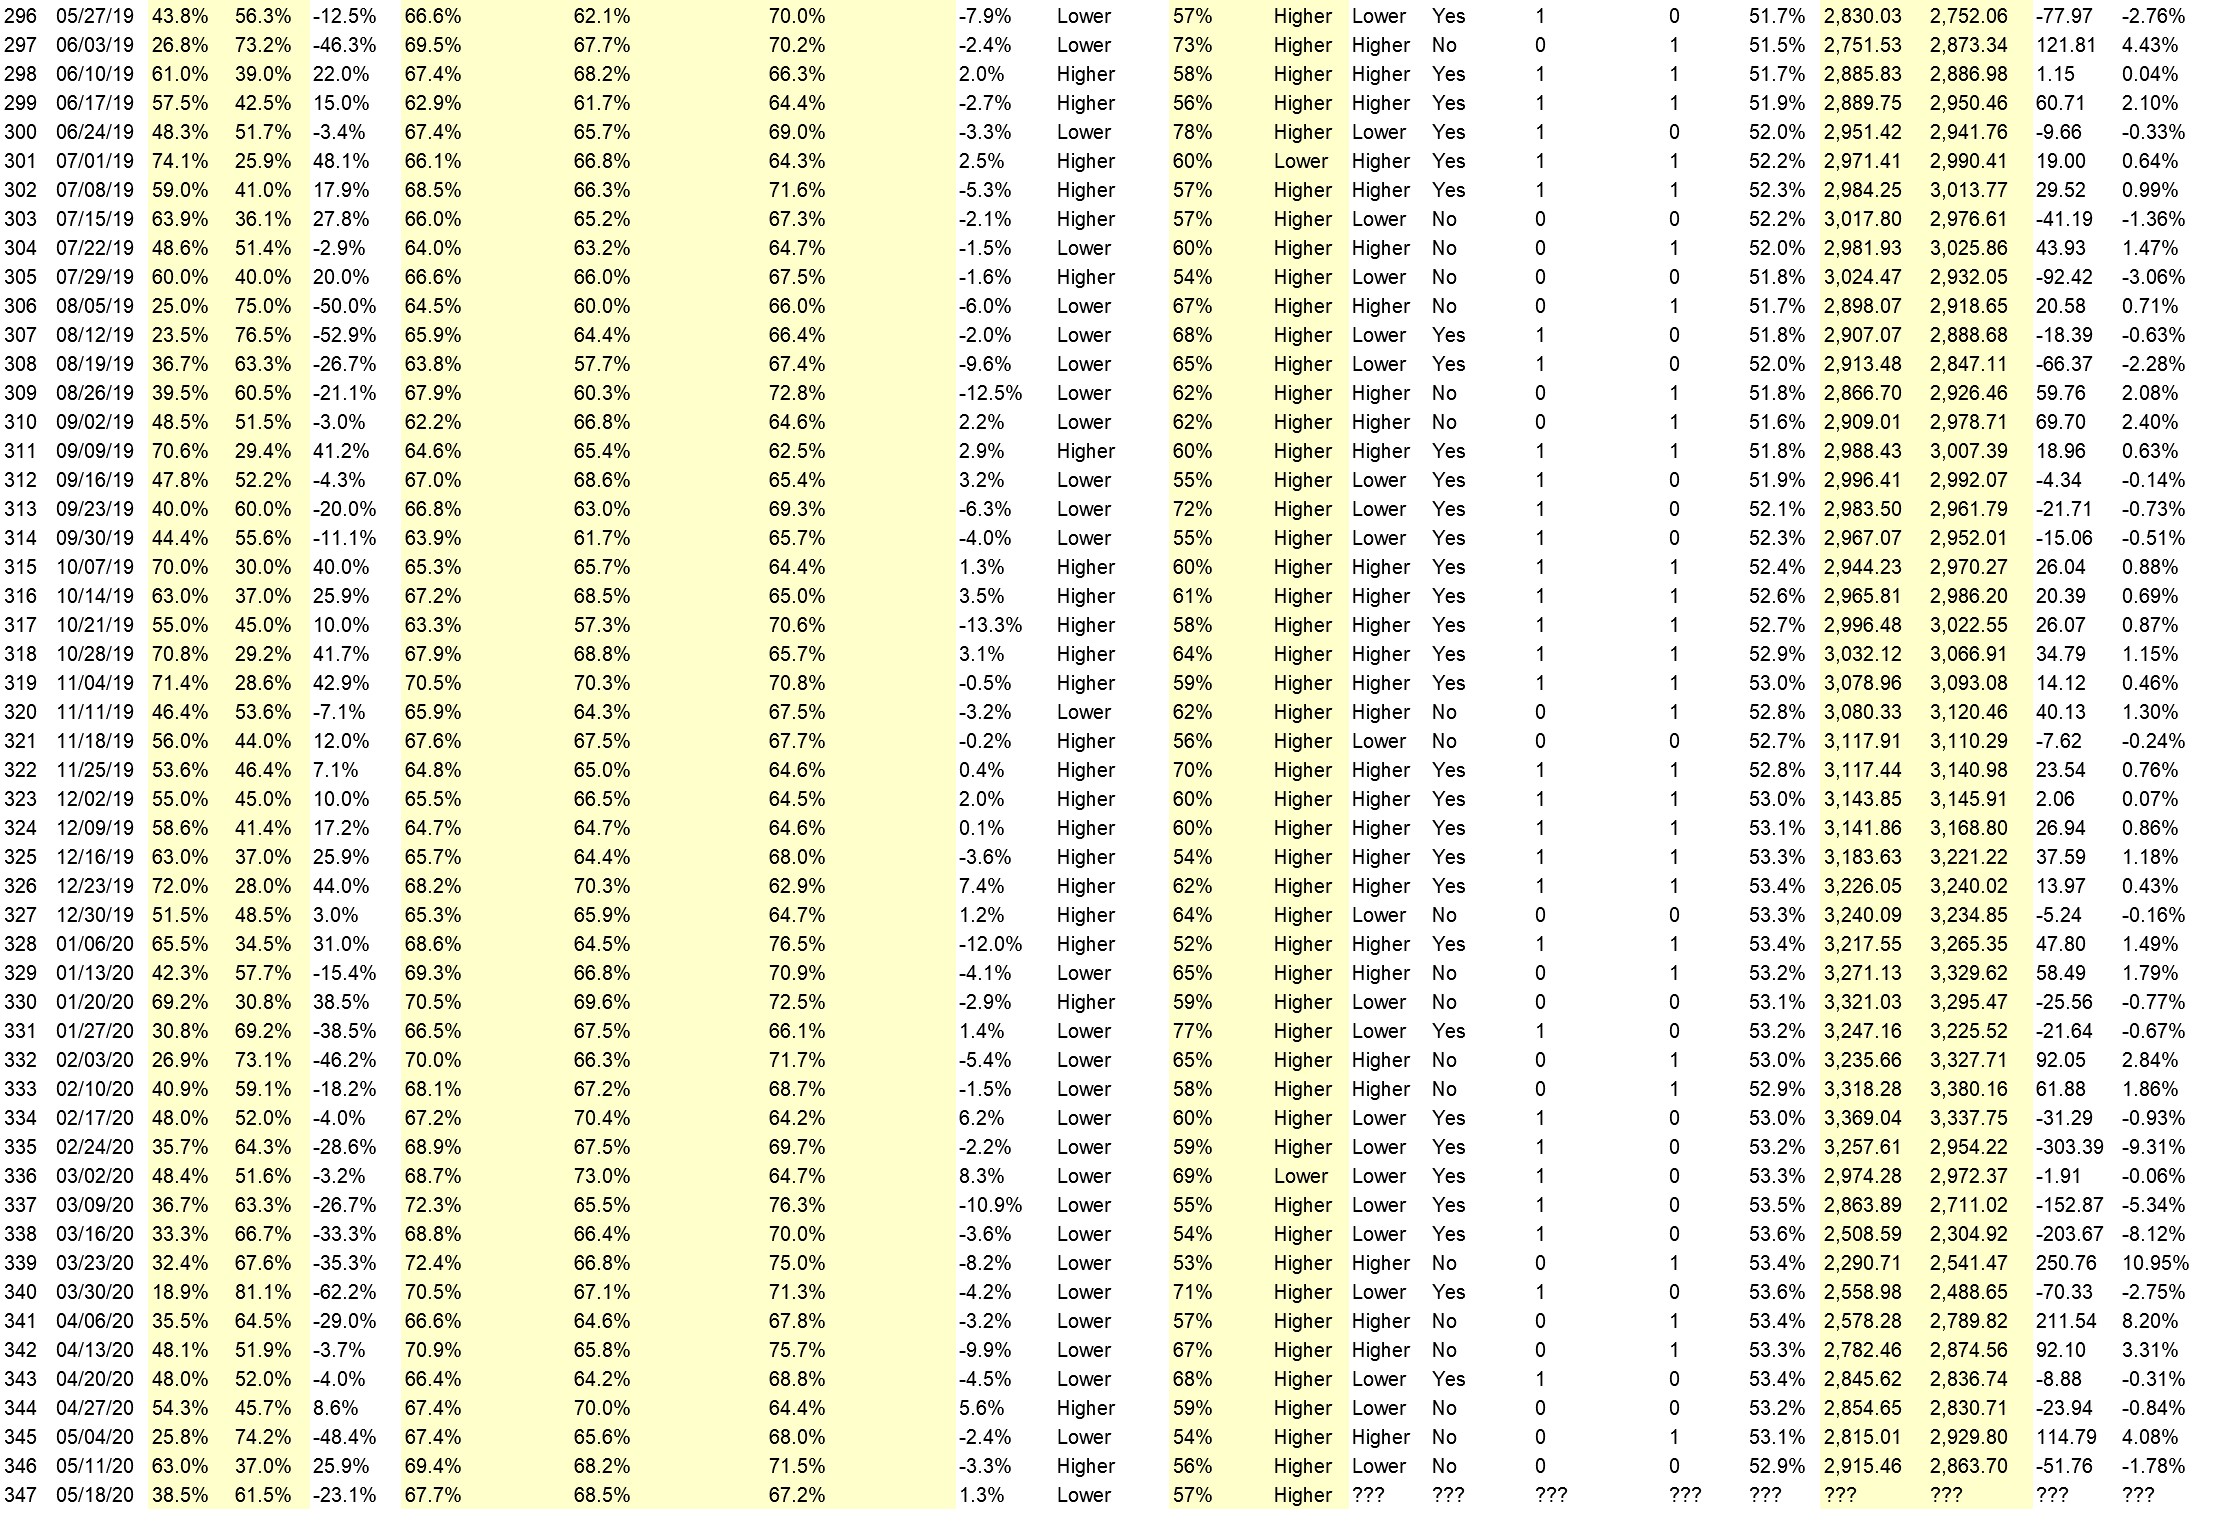
Question #2. Rate your confidence in your answer to Question #2 by estimating the probability you have correctly predicted next week’s market move.
Average of All Responses: 67.7%
Average For “Higher” Responses: 68.5%
Average For “Lower” Responses: 67.2%
Higher/Lower Difference: 1.3%
Responses Submitted This Week: 27
52-Week Average Number of Responses: 31.2
TimingResearch Crowd Forecast Prediction: 57% Chance Higher
This prediction is an attempt by the editor of this newsletter to use the full 6+ year history of data collected from this project to forecast a probability estimate for whether this week’s sentiment is going to be correct and ultimately what the markets will do this coming week.
Details: Last week’s majority sentiment from the survey was 63.0% predicting Higher, and the Crowd Forecast Indicator prediction was 56% chance Higher; the S&P500 closed 1.78% Lower for the week. This week’s majority sentiment from the survey is 63.0% predicting Higher with a greater average confidence from those who are predicting Lower. Similar conditions have occurred 44 times in the previous 346 weeks, with the majority sentiment (Lower) being correct 43% of the time and with an average S&P500 move of 0.002% Lower for the week. Based on that history, the TimingResearch Crowd Forecast Indicator is forecasting a 57% Chance that the S&P500 is going to move Higher this coming week.
Raw Data Page (raw data files include full history spreadsheet and the above charts):
TimingResearch.com/data.
[AD] • eBook: How To Profit From Earnings Announcements Using Options
Full Weekly Results (full version of this chart available in the raw data spreadsheet for this week, “Date” field below lists the Monday of the week being predicted).
Overall Sentiment All-Time “Correct” Percentage: 52.9%
Overall Sentiment 52-Week “Correct” Percentage: 60.8%
Overall Sentiment 12-Week “Correct” Percentage: 45.5%
Only the previous 52 weeks of data are shown below, please download the raw data to see the full range of past data.
Weekly Reports Page: TimingResearch.com/reports
Raw Data Page: TimingResearch.com/rawdata
Current Survey Page: TimingResearch.com/currentsurvey
Any feedback: TimingResearch.com/contact
Email Alerts
Make sure you don’t miss all the future reports, show reminders, and bonus offers from TimingResearch, enter your best email here:
By signing up you agree to receive newsletter and marketing emails. You can unsubscribe at any time.
Privacy Policies
NOTE: The following open-ended answers are solely the opinions of the anonymous respondents to this survey. Responses are mostly unedited, but some have been reformatted slightly for to make them easier to read. Some irrelevant responses (e.g. “none”), or anything obviously fake, or copy and pasted responses have been omitted. All-caps responses have been changed to all lowercase. All responses for each week, unedited, are available in the raw data spreadsheets at TimingResearch.com/data.
Question #3. For your answer to Question #1, please share what specific reason(s) you think the S&P500 will be heading the direction you chose.
“Higher” Respondent Answers:
• Hello so thenks for all person I am okay and I am care one I am always thinking world the peoples good life coming everyday. All the best
• With the Feds throwing another 3 trillion to everyone, it has to go up.
• irrational exuberance
• Positive Governance opens up states fir business!
• People are starting back to work
• The herd is running
“Lower” Respondent Answers:
• Actually the market should flatten here
• Bearish engulfing on SPX daily.
• We are range bound now
• MGI
• In the daily chart we can see a Head and Shoulders pattern that just breakout the neck line with a negative divergence in MACD and high voloume
• China tension.
• The S&P has been in a trading range the last few weeks with momentum retreating. Financials & retail doing poorly. It’s about time for the S&P to roll over.
• candles formed a chart-pattern that signals the market wants to go down
• Technical analysis
• 1. Correction of recent rally is at serious low.
• Last big week of earnings and no really good news expected. Market beginning to pullback.
• news on the virus, bank failures due to non-payment of rent and mortgages
[AD] • eBook: How To Profit From Earnings Announcements Using Options
Question #4. What procedures do you use to monitor and evaluate your trading results and progress over time?
• I watch the financial news daily
• If I hit my targets.
• P&L
• Market profile
• Hey so thenks for you I am going to my conditions Is good no problem.
• Daily charting and advisory services.
• Portfolio value.
• chart-analytics & guidance from analysts
• Excel spreadsheet
• I have backdate testing
• Plots
• Basic resistence and support charting. Evaluate a consensus of TV “talking heads” experts dialogue.
• %winning trades and $balance
Question #5. Additional Comments/Questions/Suggestions?
• Hello so thenks for everyone all the best
• The markets should be in the dumper, but the Fed and and govt orgs are running the show. Kind of weird though-every time another 3-4 million people are laid off, the markets spike up!
• President Donald Trump Best President since JFK!!
[AD] • eBook: How To Profit From Earnings Announcements Using Options
Email Alerts
Make sure you don’t miss all the future reports, show reminders, and bonus offers from TimingResearch, enter your best email here:
By signing up you agree to receive newsletter and marketing emails. You can unsubscribe at any time.
Privacy Policies