
Crowd Forecast News Report #349
[AD] • eBook: How To Profit From Earnings Announcements Using OptionsThe new TimingResearch report for the week has been posted, you can download the full PDF report with the link below or you can read the full report in this post below.
Click here to download report in PDF format: TRReport053120.pdf
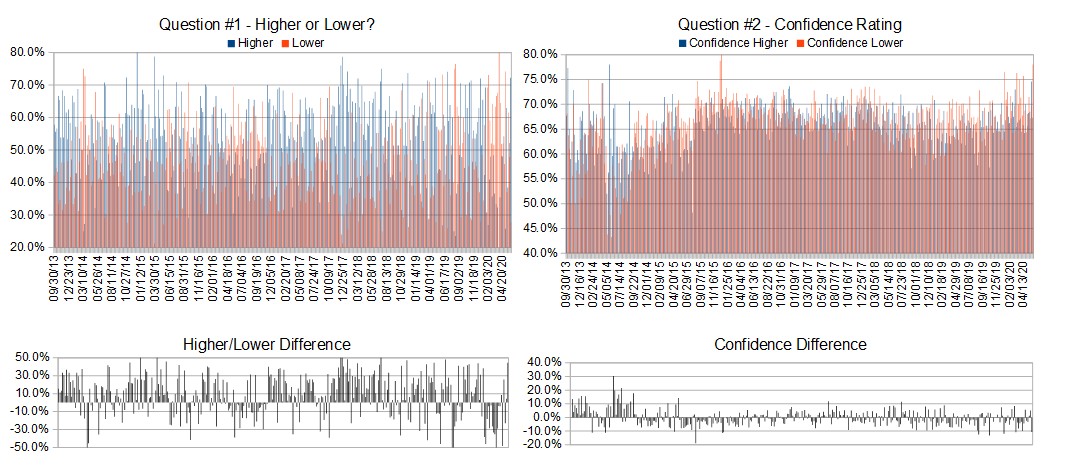
Question #1. Which direction do you think the S&P500 index will move from this coming Monday’s open to Friday’s close (June 1st-5th)?
Higher: 72.2%
Lower: 27.8%
Higher/Lower Difference: 44.4%
Question #2. Rate your confidence in your answer to Question #2 by estimating the probability you have correctly predicted next week’s market move.
Average of All Responses: 70.3%
Average For “Higher” Responses: 67.3%
Average For “Lower” Responses: 78.0%
Higher/Lower Difference: -10.7%
Responses Submitted This Week: 19
52-Week Average Number of Responses: 30.5
TimingResearch Crowd Forecast Prediction: 54% Chance Higher
This prediction is an attempt by the editor of this newsletter to use the full 6+ year history of data collected from this project to forecast a probability estimate for whether this week’s sentiment is going to be correct and ultimately what the markets will do this coming week.
Details: Last week’s majority sentiment from the survey was 52.2% predicting Higher, and the Crowd Forecast Indicator prediction was 57% chance Higher; the S&P500 closed 1.34% Higher for the week. This week’s majority sentiment from the survey is 72.2% predicting Higher (highest percentage in almost a year) but with a much greater average confidence from those who are predicting Lower. Similar conditions have occurred 41 times in the previous 348 weeks, with the majority sentiment (Higher) being correct 57% of the time but with an average S&P500 move of 0.24% Lower for the week. Based on that history, the TimingResearch Crowd Forecast Indicator is forecasting a 54% Chance that the S&P500 is going to move Higher this coming week.
Raw Data Page (raw data files include full history spreadsheet and the above charts):
TimingResearch.com/data.
[AD] • eBook: How To Profit From Earnings Announcements Using Options
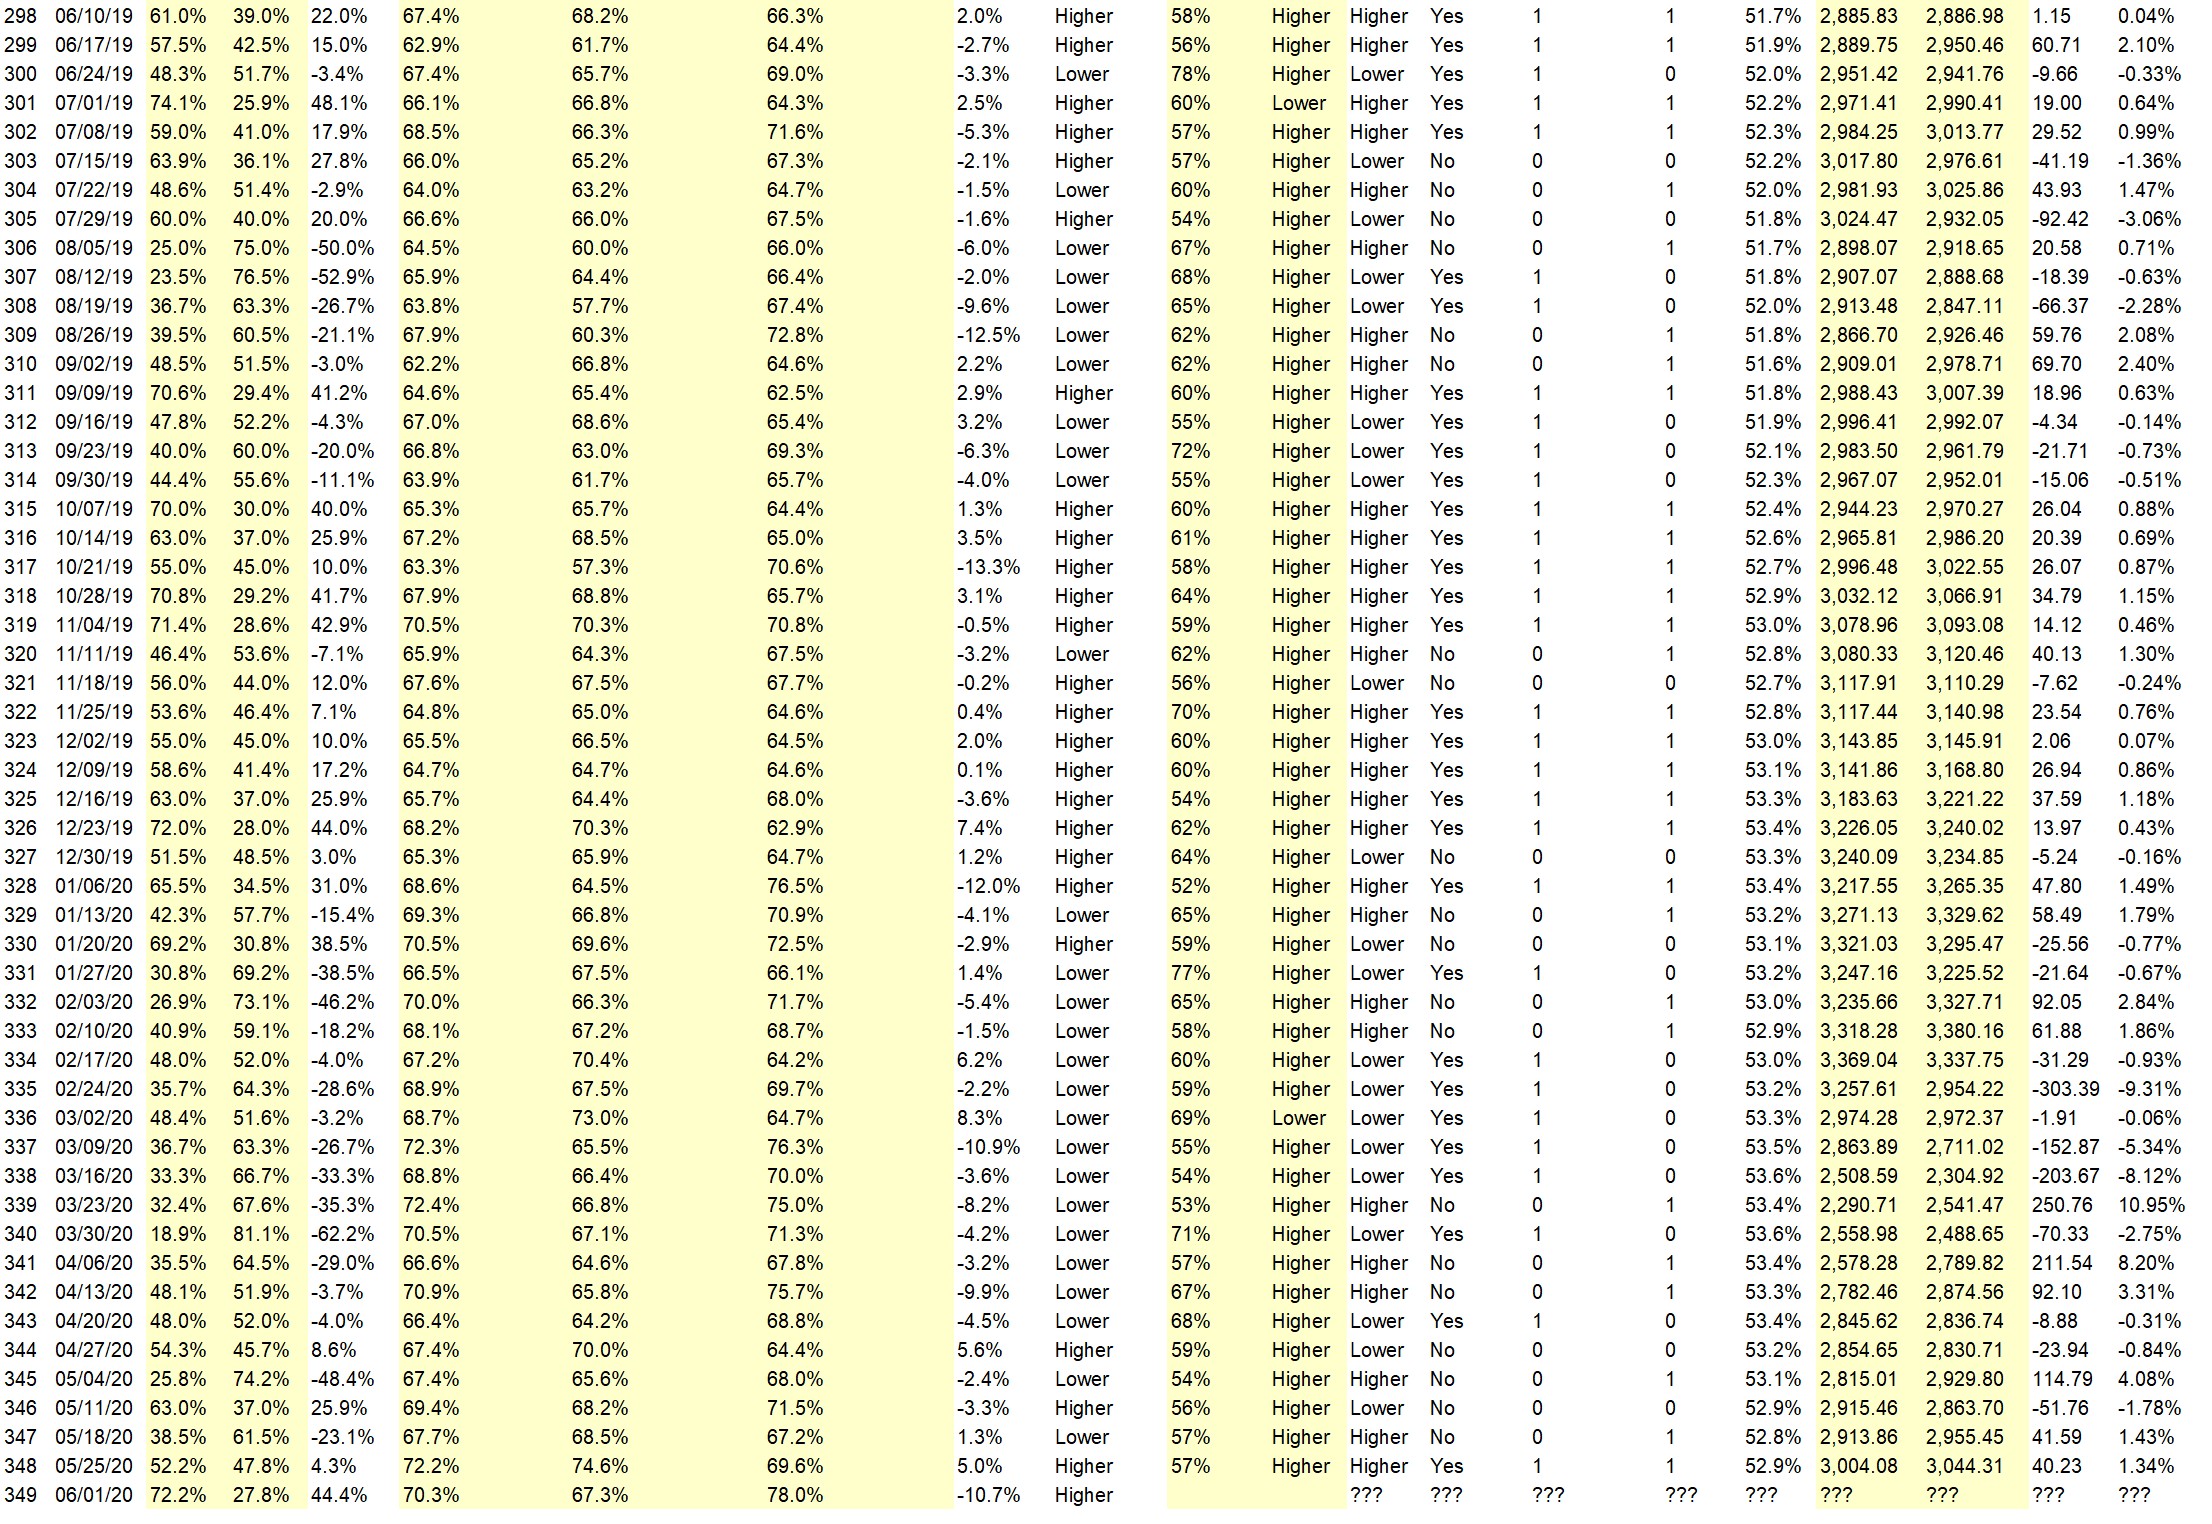
Full Weekly Results (full version of this chart available in the raw data spreadsheet for this week, “Date” field below lists the Monday of the week being predicted).
Overall Sentiment All-Time “Correct” Percentage: 52.9%
Overall Sentiment 52-Week “Correct” Percentage: 60.8%
Overall Sentiment 12-Week “Correct” Percentage: 36.4%
Only the previous 52 weeks of data are shown below, please download the raw data to see the full range of past data.
Weekly Reports Page: TimingResearch.com/reports
Raw Data Page: TimingResearch.com/rawdata
Current Survey Page: TimingResearch.com/currentsurvey
Any feedback: TimingResearch.com/contact
Email Alerts
Make sure you don’t miss all the future reports, show reminders, and bonus offers from TimingResearch, enter your best email here:
By signing up you agree to receive newsletter and marketing emails. You can unsubscribe at any time.
Privacy Policies
NOTE: The following open-ended answers are solely the opinions of the anonymous respondents to this survey. Responses are mostly unedited, but some have been reformatted slightly for to make them easier to read. Some irrelevant responses (e.g. “none”), or anything obviously fake, or copy and pasted responses have been omitted. All-caps responses have been changed to all lowercase. All responses for each week, unedited, are available in the raw data spreadsheets at TimingResearch.com/data.
Question #3. For your answer to Question #1, please share what specific reason(s) you think the S&P500 will be heading the direction you chose.
“Higher” Respondent Answers:
• Price action
• Trend
• Price is above 200 DMA. VIX go down.
• Things getting going in many states
• Well, we’ve came this far on stimulus, what’s the issue? With economy opening up and those provinces, states , countries 1st to do so will benefit most. Of course those countries who kept operating are already farther ahead!!
• increasing positive momentum
• Momentum
• business is re-opening
• next week will be up
“Lower” Respondent Answers:
• riots and more business closing
• The S&P hit it’s high last week on 5/28 a the top of a Bollinger band and at a resistance level. A dip from there should be probable. Also, the US-China trade uncertainty could discourage investors form buying equities.
• Unrest spreading, COVID-19 cases up due to not distance during memorial weekend, and market needs a breath.
• Cyclical reason
[AD] • eBook: How To Profit From Earnings Announcements Using Options
Question #4. What indicator influences your trading the most?
• trend
• RSI
• I’m simple Most time don’t have any indicators on charts. Just price Bar charts
• Support/resistance levels and Bollinger bands
• MACD
• macd
• MA, CCI
• Look to left; Price Action; volume action; CCI and Market Sediment
• MACD, weekly, daily, 30 minute chart.
Question #5. Additional Comments/Questions/Suggestions?
• none
[AD] • eBook: How To Profit From Earnings Announcements Using Options
Email Alerts
Make sure you don’t miss all the future reports, show reminders, and bonus offers from TimingResearch, enter your best email here:
By signing up you agree to receive newsletter and marketing emails. You can unsubscribe at any time.
Privacy Policies