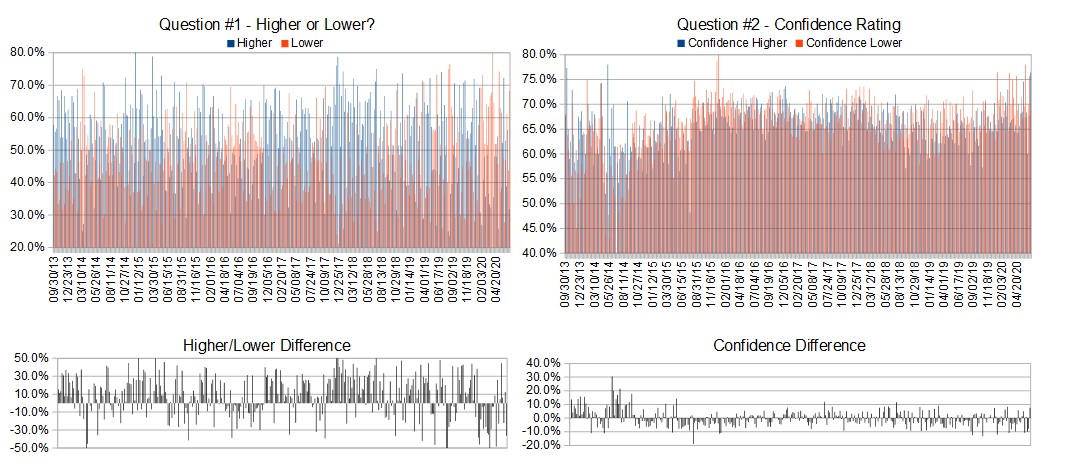
Crowd Forecast News Report #353
[AD] PDF: 10 Strategies for SuccessThe new TimingResearch report for the week has been posted, you can download the full PDF report with the link below or you can read the full report in this post below.
Click here to download report in PDF format: TRReport062920.pdf
Question #1. Which direction do you think the S&P500 index will move from this coming Monday’s open to Thursday’s close (June 29th – July 2nd)?
Higher: 31.8%
Lower: 68.2%
Higher/Lower Difference: -36.4%
Question #2. Rate your confidence in your answer to Question #2 by estimating the probability you have correctly predicted next week’s market move.
Average of All Responses: 71.4%
Average For “Higher” Responses: 76.4%
Average For “Lower” Responses: 68.9%
Higher/Lower Difference: 7.5%
Responses Submitted This Week: 22
52-Week Average Number of Responses: 29.3
TimingResearch Crowd Forecast Prediction: 70% Chance Higher
This prediction is an attempt by the editor of this newsletter to use the full 6+ year history of data collected from this project to forecast a probability estimate for whether this week’s sentiment is going to be correct and ultimately what the markets will do this coming week.
Details: Last week’s majority sentiment from the survey was 56.3% predicting Higher, and the Crowd Forecast Indicator prediction was 56% chance Higher; the S&P500 closed 2.76% Lower for the week. This week’s majority sentiment from the survey is 68.2% predicting Lower but with a greater average confidence from those who are predicting Higher. Similar conditions have occurred 20 times in the previous 352 weeks, with the majority sentiment (Higher) being correct 70% of the time and with an average S&P500 move of 0.23% Higher for the week. Based on that history, the TimingResearch Crowd Forecast Indicator is forecasting a 70% Chance that the S&P500 is going to move Higher this coming week.

Raw Data Page (raw data files include full history spreadsheet and the above charts):
TimingResearch.com/data.
[AD] PDF: 10 Strategies for Success
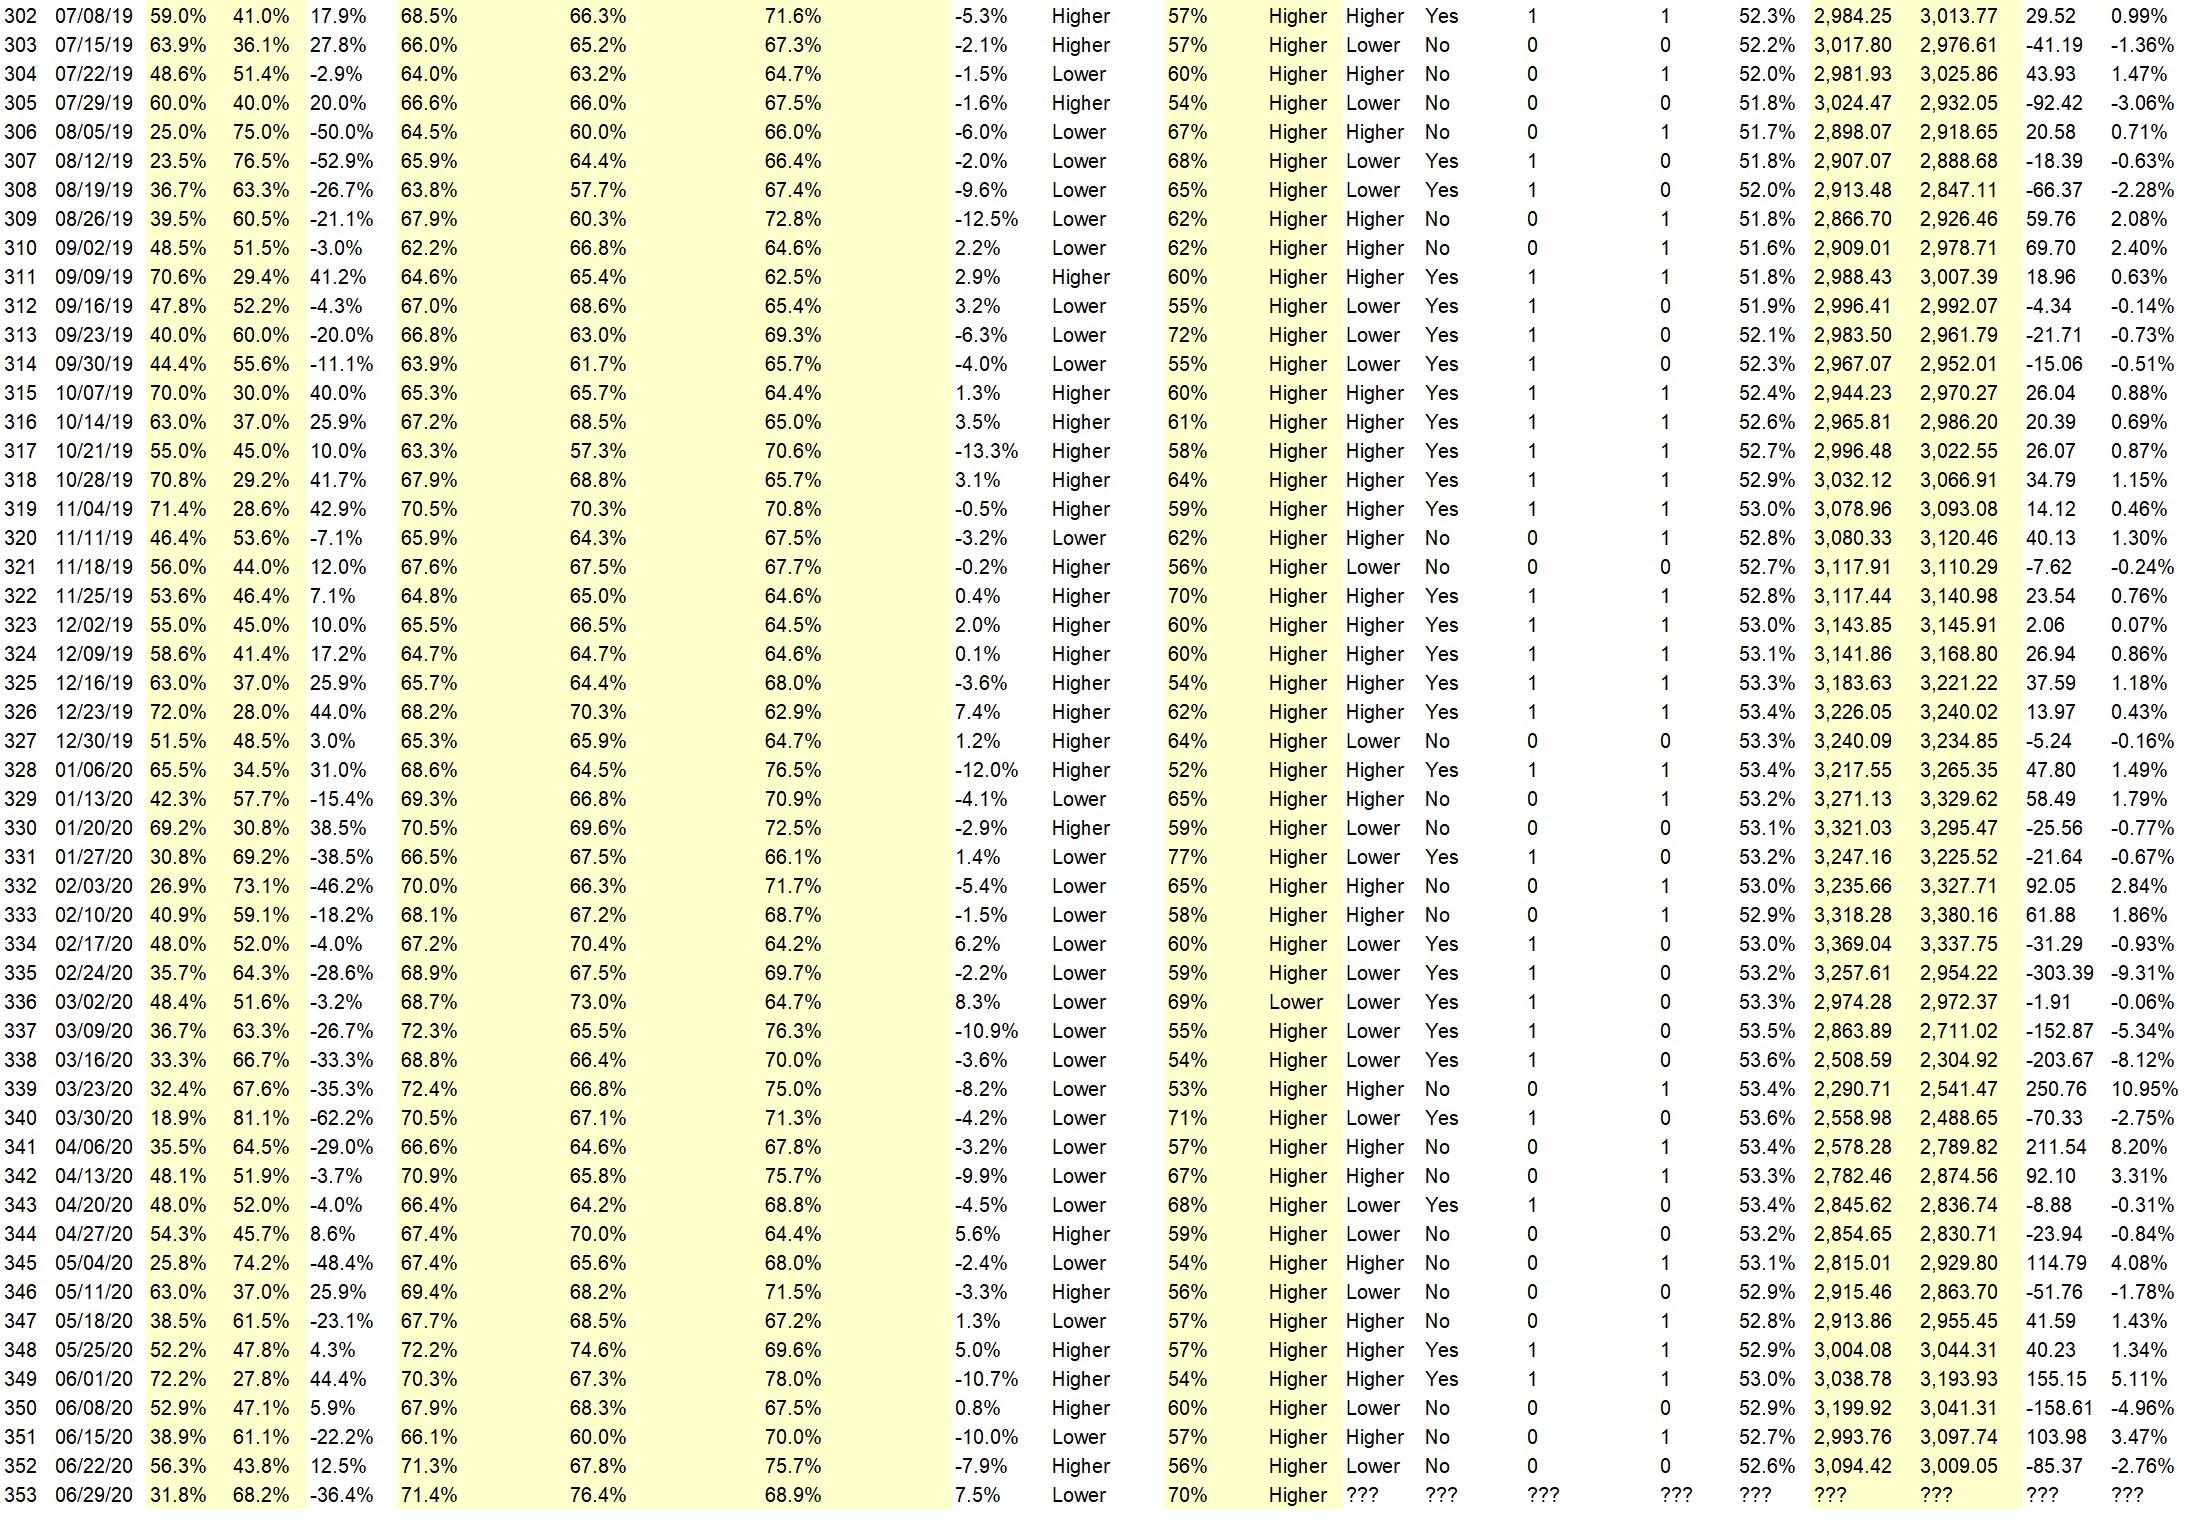
Full Weekly Results (full version of this chart available in the raw data spreadsheet for this week, “Date” field below lists the Monday of the week being predicted).
Overall Sentiment All-Time “Correct” Percentage: 52.6%
Overall Sentiment 52-Week “Correct” Percentage: 54.9%
Overall Sentiment 12-Week “Correct” Percentage: 27.3%
Only the previous 52 weeks of data are shown below, please download the raw data to see the full range of past data.

Weekly Reports Page: TimingResearch.com/reports
Raw Data Page: TimingResearch.com/rawdata
Current Survey Page: TimingResearch.com/currentsurvey
Any feedback: TimingResearch.com/contact
Email Alerts
Make sure you don’t miss all the future reports, show reminders, and bonus offers from TimingResearch, enter your best email here:
By signing up you agree to receive newsletter and marketing emails. You can unsubscribe at any time.
Privacy Policies
NOTE: The following open-ended answers are solely the opinions of the anonymous respondents to this survey. Responses are mostly unedited, but some have been reformatted slightly for to make them easier to read. Some irrelevant responses (e.g. “none”), or anything obviously fake, or copy and pasted responses have been omitted. All-caps responses have been changed to all lowercase. All responses for each week, unedited, are available in the raw data spreadsheets at TimingResearch.com/data.
Question #3. For your answer to Question #1, please share what specific reason(s) you think the S&P500 will be heading the direction you chose.
“Higher” Respondent Answers:
• Fear runs the market now.
• The week before July 4th is almost always bullish. That history should outweigh concerns about COVID spikes.
• pre 4th of July week seasonal bullish strength
• vaccin sooner redy
• lower & higher, this is not a breakdown, upward move by mid of next week is closely observed
“Lower” Respondent Answers:
• Price will be back to 2640 (FB retrace 62%), what is it like spinning on a megaphone in a weekly chart.
• Virus numbers are increase, bankruptcy of Chesapeake Energy. President Trump’s ratings are down
• more unemployment
• Rising COVID cases in big states. Report on GDP will show lower numbers. Likelihood that Biden will become President spooks the market.
• The S&P had a high in Feb and a lower high in June. Since then, it hasn’t challenged the more recent high, and closed near to the lower Bollinger band. This leans bearish. Also, Covid19 is more in charge than the Fed is.
• S&P running out of momentum
• technicals
• higher VIX
[AD] PDF: 10 Strategies for Success
Question #4. What advice would you give and/or what resources would you recommend to someone who is new to trading?
• Focus more on what is at risk if you are wrong than on what you might make if all goes your way.
• How long did it take you to get to a six figure salary in yr present career? Well its going to take you that long to get to six figure annual profits.
• Trading is tricky, with lots of traps. Practice with paper trading.
• end losing trades quickly and uncompromisingly
• papertrading
• Look for clean software and clean broker and try to avoid fxcm ,don’t take too much risk, and try to consider the contract size AND DONT GET GREEDY, one trade a time. don’t ever place 2 trades or more than one trade a time try to choose the right broker, this is because the broker will place his hand in your pocket and he wouldn’t get out till you close the trade)
• patience, discipline, then strategy
• Learn how to read charts. Do not listen to the MSM.
• stay out until October
Question #5. Additional Comments/Questions/Suggestions?
• none
[AD] PDF: 10 Strategies for Success
Email Alerts
Make sure you don’t miss all the future reports, show reminders, and bonus offers from TimingResearch, enter your best email here:
By signing up you agree to receive newsletter and marketing emails. You can unsubscribe at any time.
Privacy Policies
