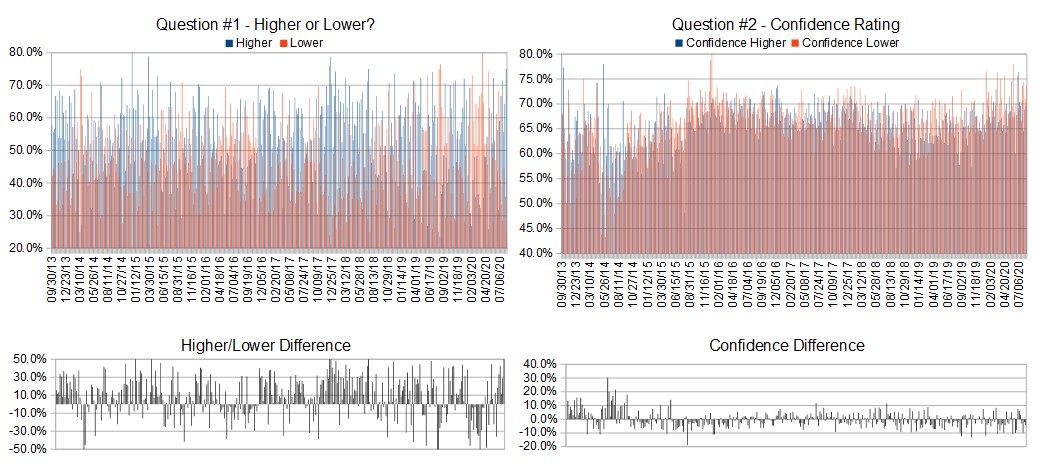
Crowd Forecast News Report #359
[AD] Report: TSLA Options Trader (Complete Strategy Guide)The new TimingResearch report for the week has been posted, you can download the full PDF report with the link below or you can read the full report in this post below.
Click here to download report in PDF format: TRReport081020.pdf
Question #1. Which direction do you think the S&P500 index will move from this coming Monday’s open to Friday’s close (August 10th-14th)?
Higher: 75.0%
Lower: 25.0%
Higher/Lower Difference: 50.0%
Question #2. Rate your confidence in your answer to Question #2 by estimating the probability you have correctly predicted next week’s market move.
Average of All Responses: 70.6%
Average For “Higher” Responses: 69.6%
Average For “Lower” Responses: 73.8%
Higher/Lower Difference: -4.2%
Responses Submitted This Week: 16
52-Week Average Number of Responses: 27.1
TimingResearch Crowd Forecast Prediction: 65% Chance Higher
This prediction is an attempt by the editor of this newsletter to use the full 6+ year history of data collected from this project to forecast a probability estimate for whether this week’s sentiment is going to be correct and ultimately what the markets will do this coming week.
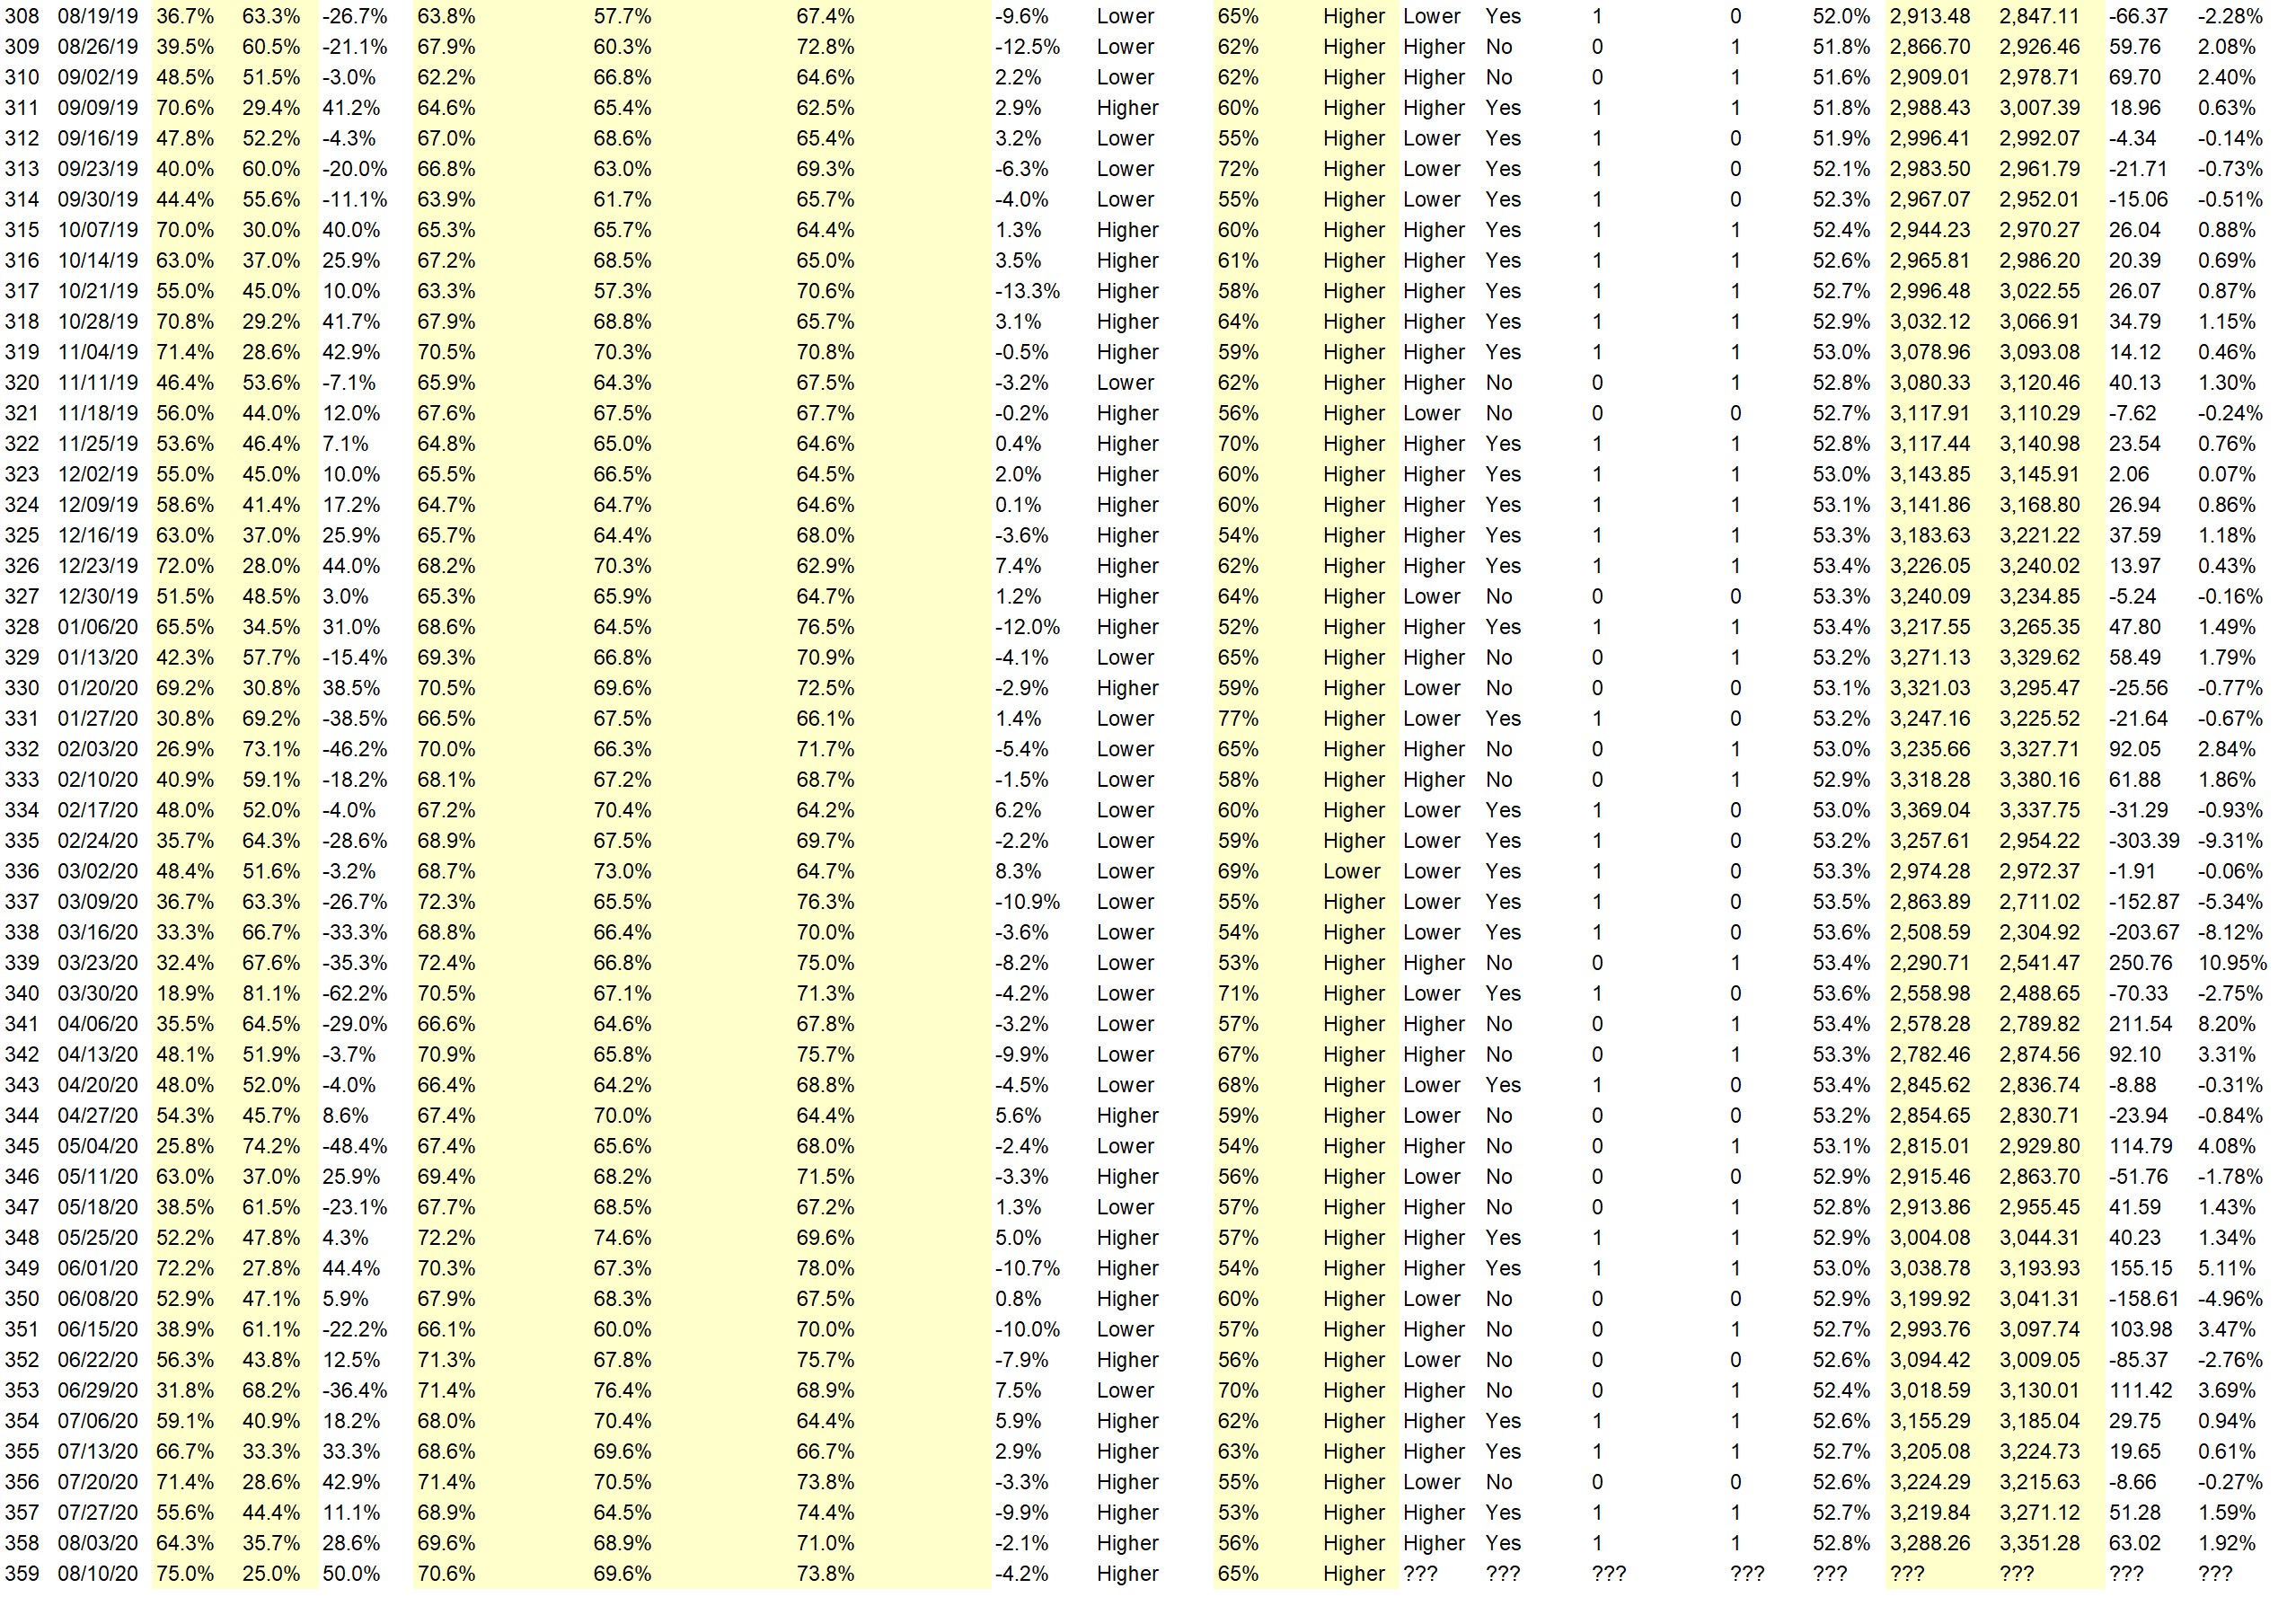
Details: Last week’s majority sentiment from the survey was 64.3% predicting Higher, and the Crowd Forecast Indicator prediction was 56% chance Higher; the S&P500 closed 1.92% Higher for the week. This week’s majority sentiment from the survey is 75% predicting Higher but with a greater average confidence from those who are predicting Lower. Similar conditions have occurred 26 times in the previous 358 weeks, with the majority sentiment (Higher) being correct 65% of the time but with an average S&P500 move of 0.31% Higher for the week. Based on that history, the TimingResearch Crowd Forecast Indicator is forecasting a 65% Chance that the S&P500 is going to move Higher this coming week.

Raw Data Page (raw data files include full history spreadsheet and the above charts):
TimingResearch.com/data.
[AD] Report: TSLA Options Trader (Complete Strategy Guide)
Full Weekly Results (full version of this chart available in the raw data spreadsheet for this week, “Date” field below lists the Monday of the week being predicted).
Overall Sentiment All-Time “Correct” Percentage: 52.8%
Overall Sentiment 52-Week “Correct” Percentage: 58.8%
Overall Sentiment 12-Week “Correct” Percentage: 54.5%
Only the previous 52 weeks of data are shown below, please download the raw data to see the full range of past data.

Weekly Reports Page: TimingResearch.com/reports
Raw Data Page: TimingResearch.com/rawdata
Current Survey Page: TimingResearch.com/currentsurvey
Any feedback: TimingResearch.com/contact
Email Alerts
Make sure you don’t miss all the future reports, show reminders, and bonus offers from TimingResearch, enter your best email here:
By signing up you agree to receive newsletter and marketing emails. You can unsubscribe at any time.
Privacy Policies
NOTE: The following open-ended answers are solely the opinions of the anonymous respondents to this survey. Responses are mostly unedited, but some have been reformatted slightly for to make them easier to read. Some irrelevant responses (e.g. “none”), or anything obviously fake, or copy and pasted responses have been omitted. All-caps responses have been changed to all lowercase. All responses for each week, unedited, are available in the raw data spreadsheets at TimingResearch.com/data.
Question #3. For your answer to Question #1, please share what specific reason(s) you think the S&P500 will be heading the direction you chose.
“Higher” Respondent Answers:
• Trend
• FAANG
• COT EMinis more postivie
• Trend continues
• The trend is still our friend
• The trend is still up. I am cautiously bullish. We do see some signs on our side of the pond (SE Asia) that not all is well in local economies and who knows, will there be a spill-over effect to US markets?
• Price will be upward with no bad news.
• The 20 day MA is way above the 50 day MA which is even feather above the 200 day MA .
• The Trillions USD from Jay Powell and the open spigot waiting to spew $$$ defies ALL other market-affecting data. Enough said– not dismal employment reports, not dumb W.H tweets, not Covid world-worst results, will affect the S&p 500.
“Lower” Respondent Answers:
• The market was upward parabolic this past week. Due for corrective action this coming week.
[AD] Report: TSLA Options Trader (Complete Strategy Guide)
Question #4. What procedures do you use for trade management?
• Stops
• I have a simple set of rules in place that cover up. down or sideways markets and especially when to roll option positions. In addition, because of the part of the world I live in and sometimes unreliable internet connection, I have made plans for incoming bad weather events and occasional natural disasters.My trade may not always end with the max potential profit but we will never wake up to “the bad surprise.”
• Stop Loss
• Take profits at 100% and exit if down three days in a row.
• T.A, Momemtum charts, GAP.
Question #5. Additional Comments/Questions/Suggestions?
• Kept moving 8 days in a row. Worried that it will need to correct.
[AD] Report: TSLA Options Trader (Complete Strategy Guide)
Email Alerts
Make sure you don’t miss all the future reports, show reminders, and bonus offers from TimingResearch, enter your best email here:
By signing up you agree to receive newsletter and marketing emails. You can unsubscribe at any time.
Privacy Policies
