Crowd Forecast News Report #362
[AD] eBook: NEW! 15 Ways to Stay Ahead in Choppy, Headline-Driven MarketsThe new TimingResearch report for the week has been posted, you can download the full PDF report with the link below or you can read the full report in this post below.
Click here to download report in PDF format: TRReport083120.pdf
Question #1. Which direction do you think the S&P500 index will move from this coming Monday’s open to Friday’s close?
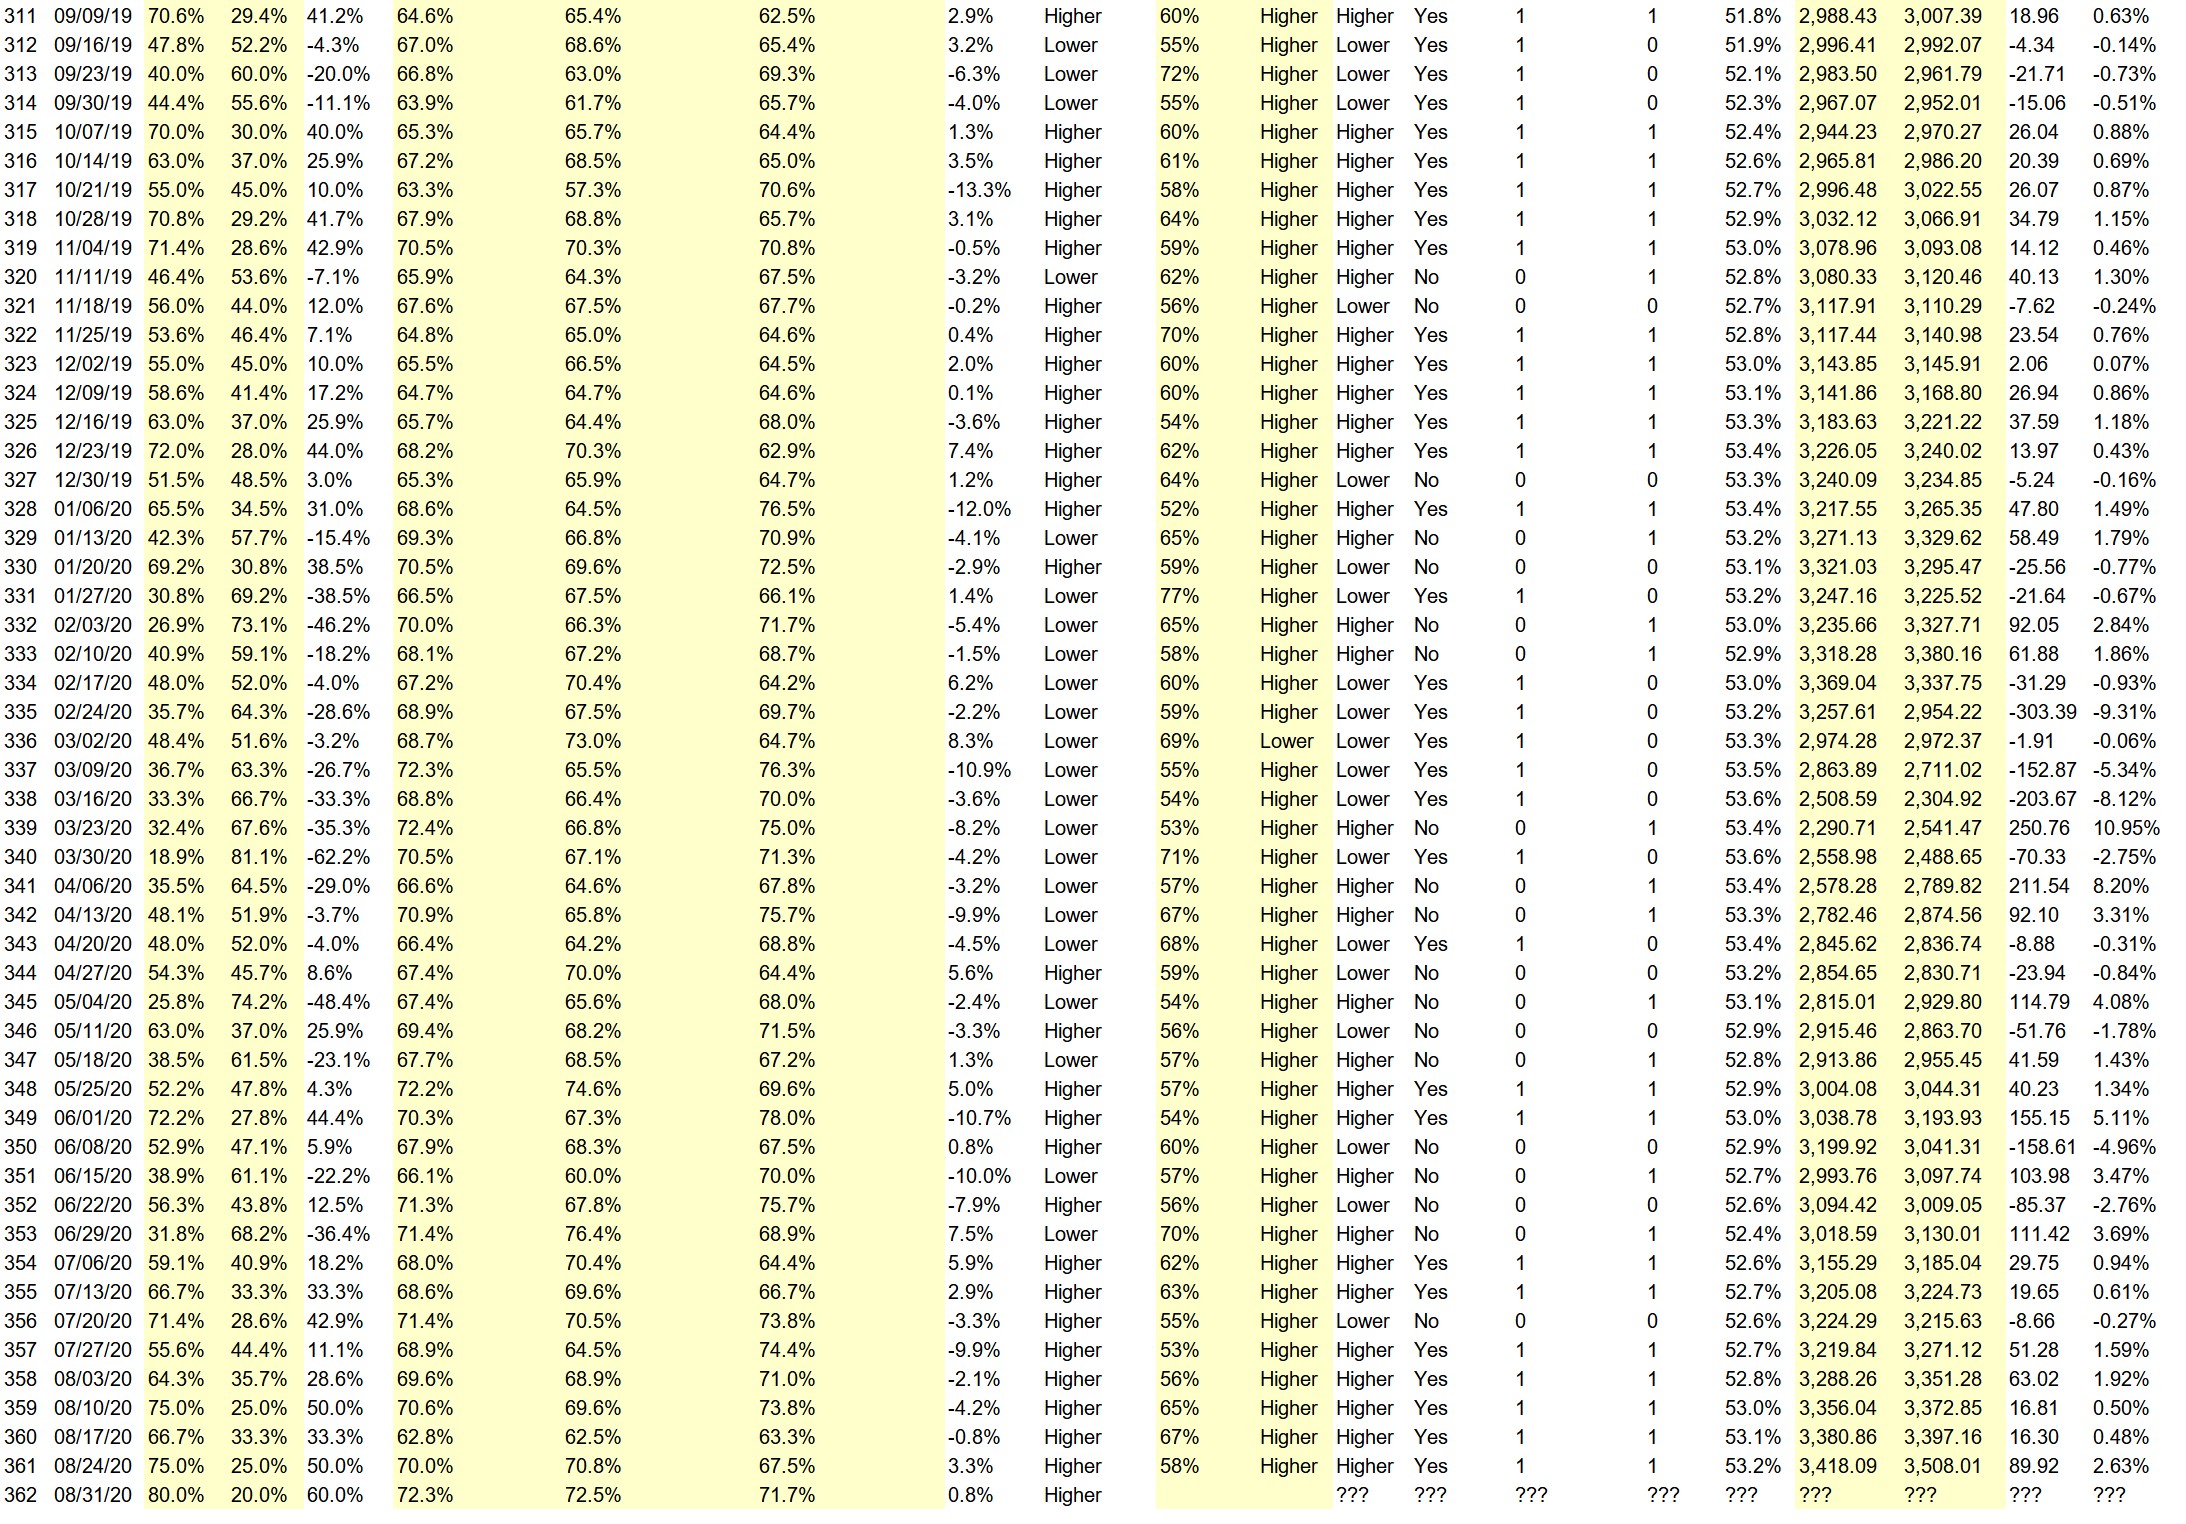
Higher: 80.0%
Lower: 20.0%
Higher/Lower Difference: 60.0%
Question #2. Rate your confidence in your answer to Question #2 by estimating the probability you have correctly predicted next week’s market move.
Average of All Responses: 72.3%
Average For “Higher” Responses: 72.5%
Average For “Lower” Responses: 71.7%
Higher/Lower Difference: 0.8%
Responses Submitted This Week: 15
52-Week Average Number of Responses: 26.0
TimingResearch Crowd Forecast Prediction: 59% Chance Higher
This prediction is an attempt by the editor of this newsletter to use the full 6+ year history of data collected from this project to forecast a probability estimate for whether this week’s sentiment is going to be correct and ultimately what the markets will do this coming week.
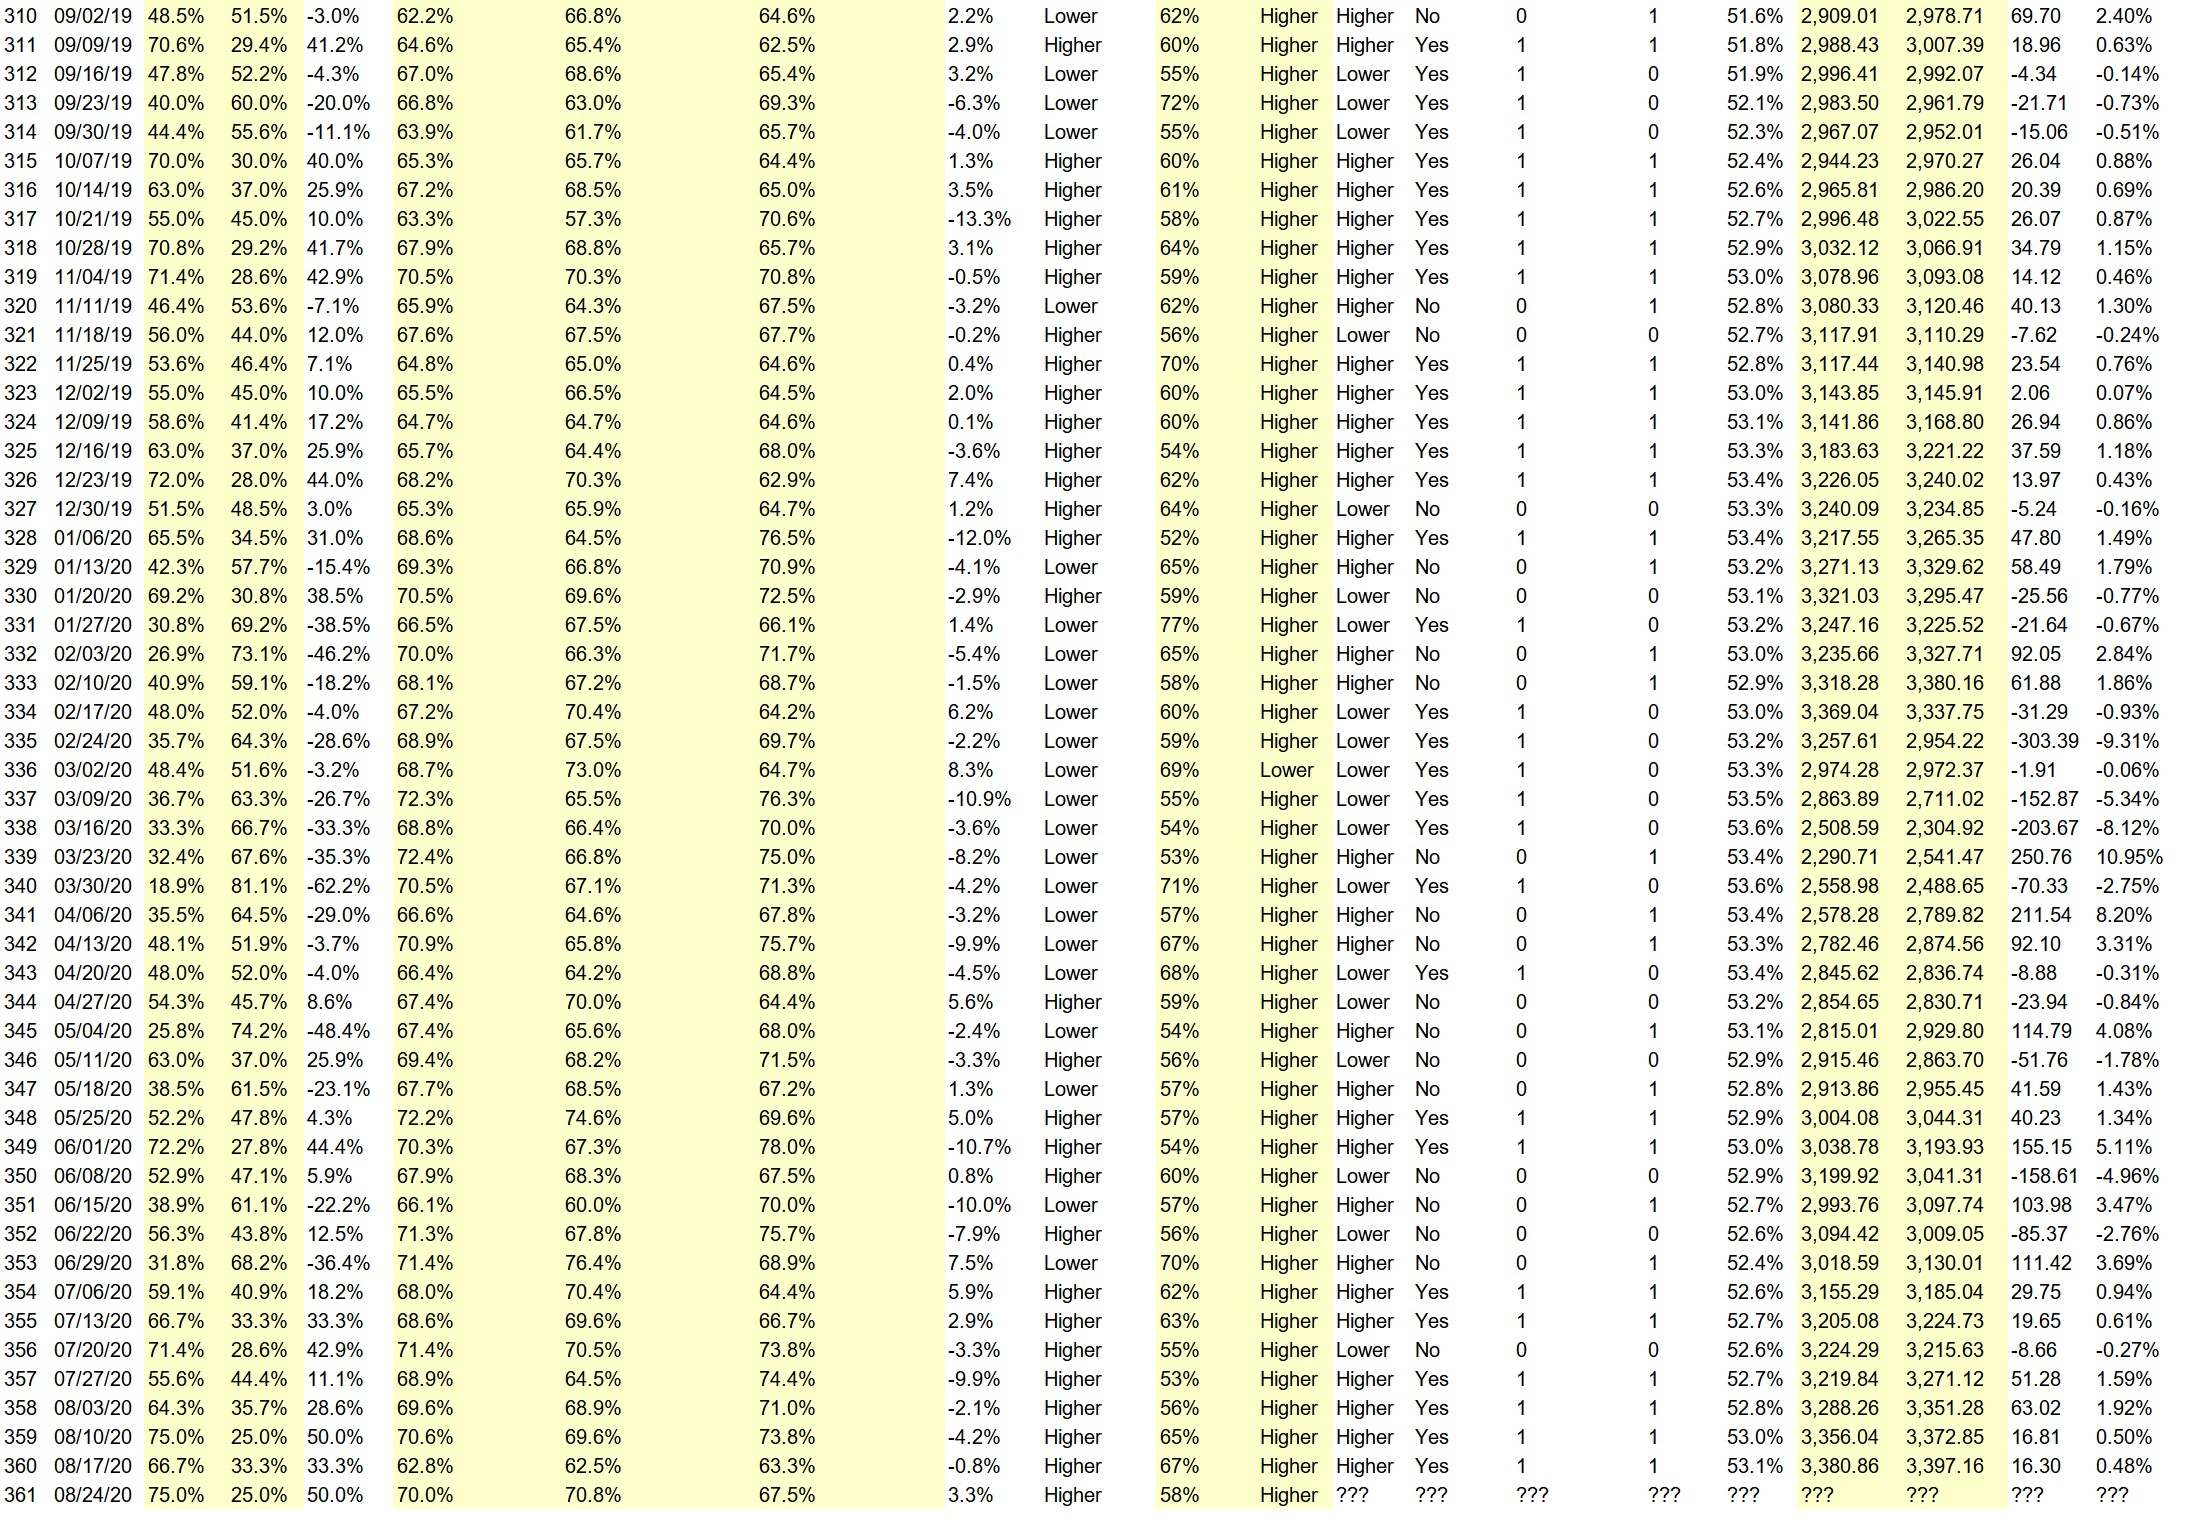
Details: Last week’s majority sentiment from the survey was 75.0% predicting Higher, and the Crowd Forecast Indicator prediction was 58% chance Higher; the S&P500 closed 2.63% Higher for the week. This week’s majority sentiment from the survey is 80.0% predicting Higher and with a greater average confidence from those who are predicting Higher. Similar conditions have occurred 37 times in the previous 361 weeks, with the majority sentiment (Higher) being correct 59% of the time and with an average S&P500 move of 0.03% Higher for the week. Based on that history, the TimingResearch Crowd Forecast Indicator is forecasting a 59% Chance that the S&P500 is going to move Higher this coming week.
Raw Data Page (raw data files include full history spreadsheet and the above charts):
TimingResearch.com/data.
[AD] eBook: NEW! 15 Ways to Stay Ahead in Choppy, Headline-Driven Markets
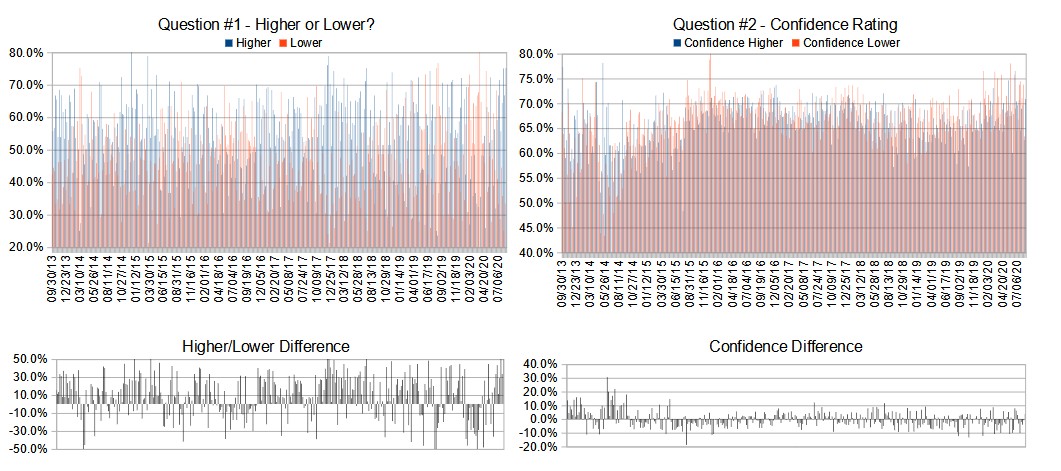
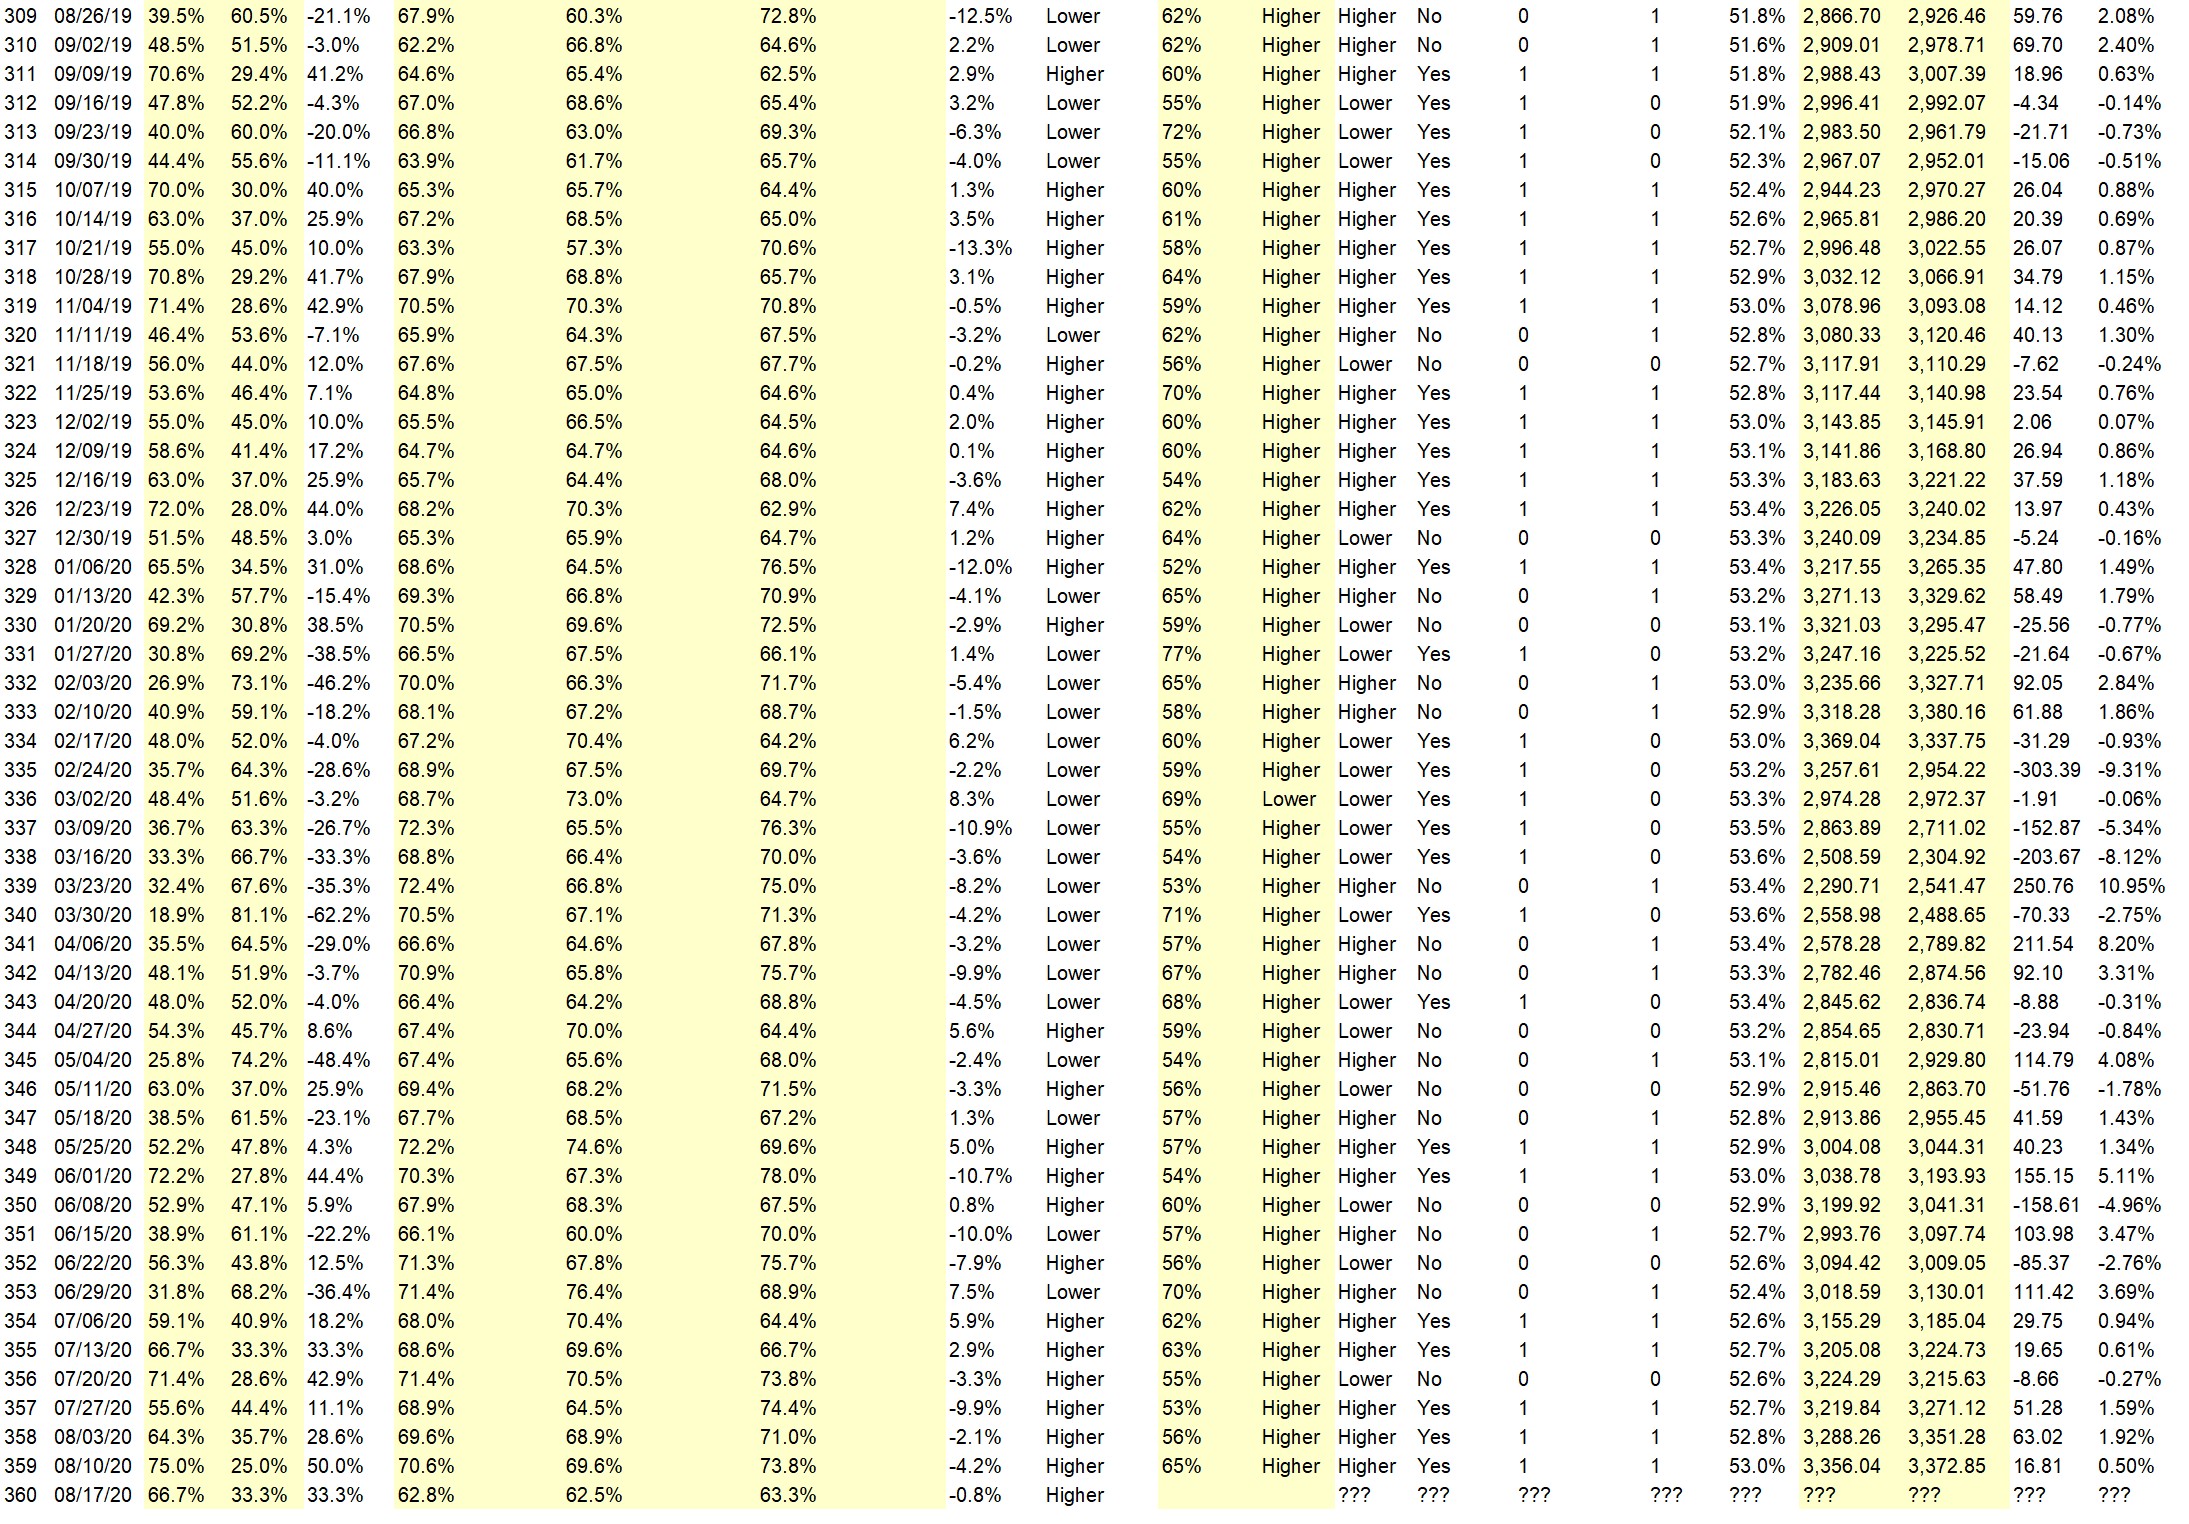
Full Weekly Results (full version of this chart available in the raw data spreadsheet for this week, “Date” field below lists the Monday of the week being predicted).
Overall Sentiment All-Time “Correct” Percentage: 53.2%
Overall Sentiment 52-Week “Correct” Percentage: 62.7%
Overall Sentiment 12-Week “Correct” Percentage: 63.6%
Only the previous 52 weeks of data are shown below, please download the raw data to see the full range of past data.
Weekly Reports Page: TimingResearch.com/reports
Raw Data Page: TimingResearch.com/rawdata
Current Survey Page: TimingResearch.com/currentsurvey
Any feedback: TimingResearch.com/contact
Email Alerts
Make sure you don’t miss all the future reports, show reminders, and bonus offers from TimingResearch, enter your best email here:
By signing up you agree to receive newsletter and marketing emails. You can unsubscribe at any time.
Privacy Policies
NOTE: The following open-ended answers are solely the opinions of the anonymous respondents to this survey. Responses are mostly unedited, but some have been reformatted slightly for to make them easier to read. Some irrelevant responses (e.g. “none”), or anything obviously fake, or copy and pasted responses have been omitted. All-caps responses have been changed to all lowercase. All responses for each week, unedited, are available in the raw data spreadsheets at TimingResearch.com/data.
Question #3. For your answer to Question #1, please share what specific reason(s) you think the S&P500 will be heading the direction you chose.
“Higher” Respondent Answers:
• Trend
• Split in AAP and TSLA will enable investor to buy more shares.Means more volume/demand and hence it will go up. It depend deal of TIK TAK that will jack the market more with an increase in Walmart and Microsoft stock prices.
• Philips curve gone
• Trend is still up
• It looks like by the end of the year the price will go to 4150 according to EW. So far, the trend is behaving like a perpetual mobile.
• Everything is going well. More good news than bad
• Election soon
• good till the election
• Trump is pulling in more votes n the polls with the Senate Red map
“Lower” Respondent Answers:
• S&P at 3500 should be the short-term resistance level; looking for an orderly pullback.
• Divergence
[AD] eBook: NEW! 15 Ways to Stay Ahead in Choppy, Headline-Driven Markets
Question #4. What topic(s) would you most like to learn about related to trading or investing?
• Inside trading and hoe it effects.
• New stocks
• Psychology
• VHF trading lacks human weaknesses, so no known strategy can be applied against it.
• Interest rates
• options stategies
• Profit
Question #5. Additional Comments/Questions/Suggestions?
• Very soon or lator TSLA will burst as it has hardly any big no of cars and nothing so fast to come in market.Prices are being pushed up
[AD] eBook: NEW! 15 Ways to Stay Ahead in Choppy, Headline-Driven Markets
Email Alerts
Make sure you don’t miss all the future reports, show reminders, and bonus offers from TimingResearch, enter your best email here:
By signing up you agree to receive newsletter and marketing emails. You can unsubscribe at any time.
Privacy Policies


