- Home
- Crowd Forecast News Reports
Crowd Forecast News Report #362
[AD] eBook: TSLA Options Trader (Complete Strategy Guide)The new TimingResearch report for the week has been posted, you can download the full PDF report with the link below or you can read the full report in this post below.
Click here to download report in PDF format: TRReport083120.pdf
Question #1. Which direction do you think the S&P500 index will move from this coming Monday’s open to Friday’s close?
Higher: 80.0%
Lower: 20.0%
Higher/Lower Difference: 60.0%
Question #2. Rate your confidence in your answer to Question #2 by estimating the probability you have correctly predicted next week’s market move.
Average of All Responses: 72.3%
Average For “Higher” Responses: 72.5%
Average For “Lower” Responses: 71.7%
Higher/Lower Difference: 0.8%
Responses Submitted This Week: 15
52-Week Average Number of Responses: 26.0
TimingResearch Crowd Forecast Prediction: 59% Chance Higher
This prediction is an attempt by the editor of this newsletter to use the full 6+ year history of data collected from this project to forecast a probability estimate for whether this week’s sentiment is going to be correct and ultimately what the markets will do this coming week.
Details: Last week’s majority sentiment from the survey was 75.0% predicting Higher, and the Crowd Forecast Indicator prediction was 58% chance Higher; the S&P500 closed 2.63% Higher for the week. This week’s majority sentiment from the survey is 80.0% predicting Higher and with a greater average confidence from those who are predicting Higher. Similar conditions have occurred 37 times in the previous 361 weeks, with the majority sentiment (Higher) being correct 59% of the time and with an average S&P500 move of 0.03% Higher for the week. Based on that history, the TimingResearch Crowd Forecast Indicator is forecasting a 59% Chance that the S&P500 is going to move Higher this coming week.
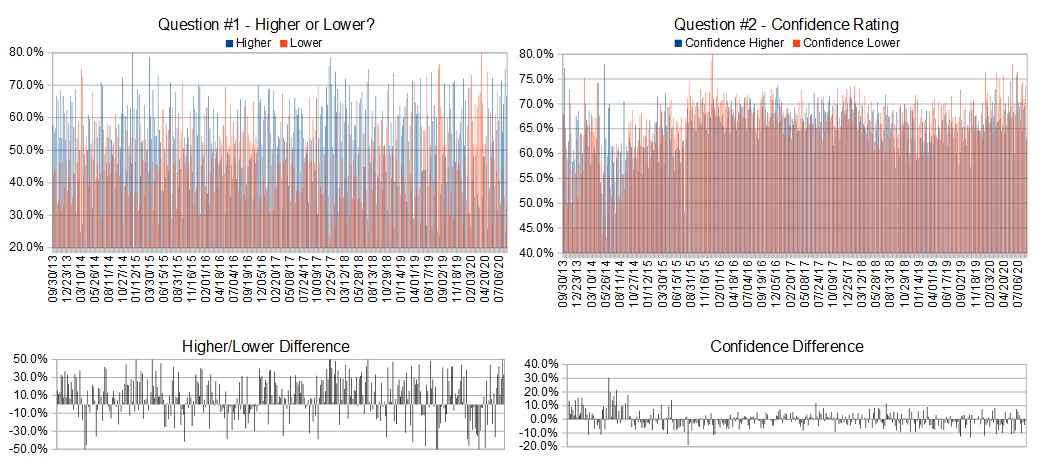
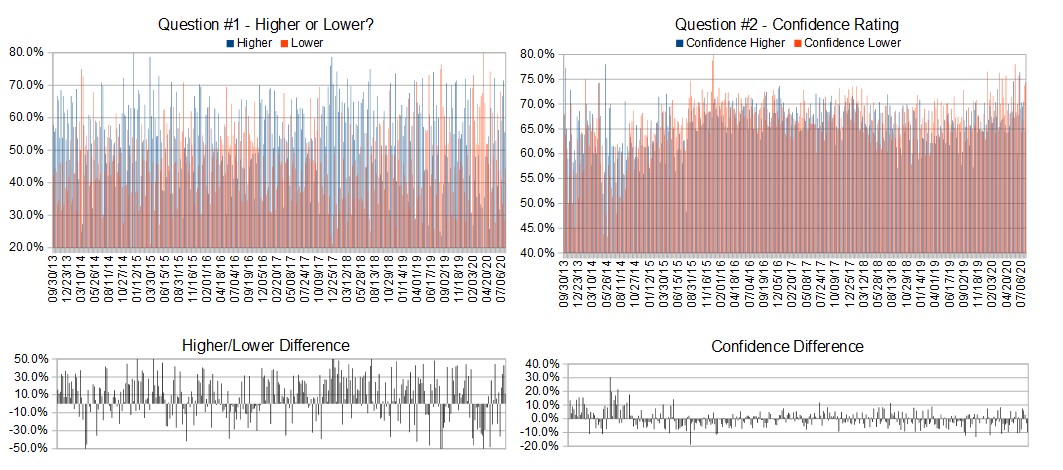
Raw Data Page (raw data files include full history spreadsheet and the above charts):
TimingResearch.com/data.
[AD] eBook: TSLA Options Trader (Complete Strategy Guide)
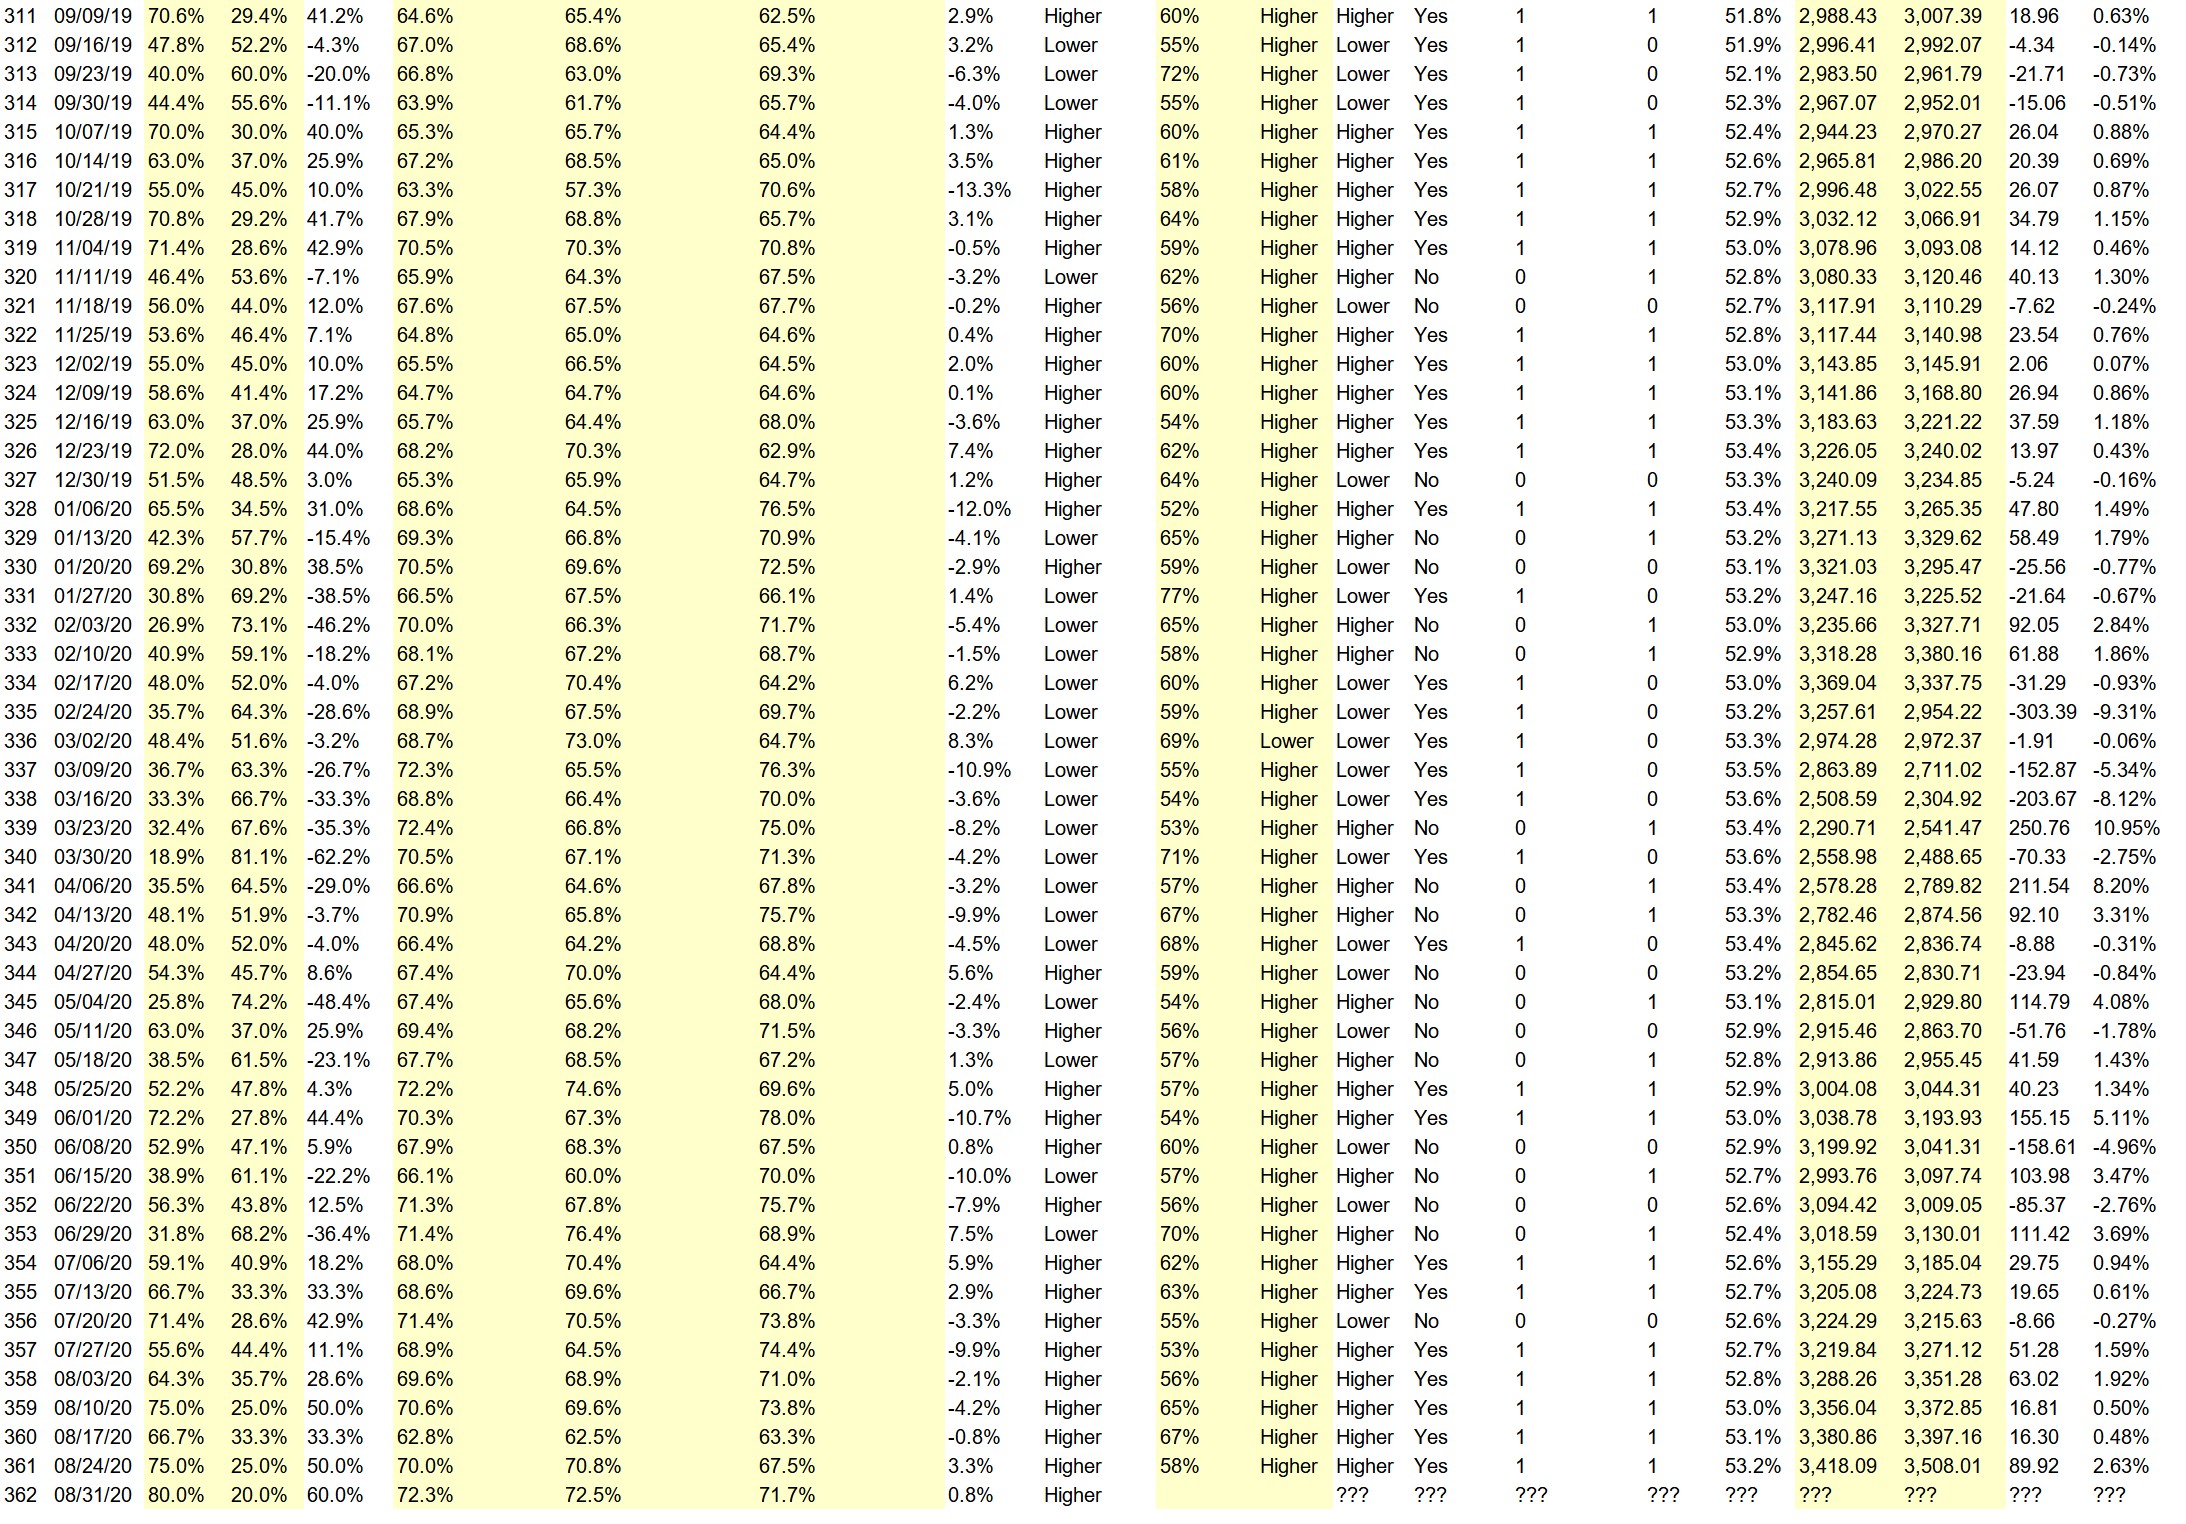
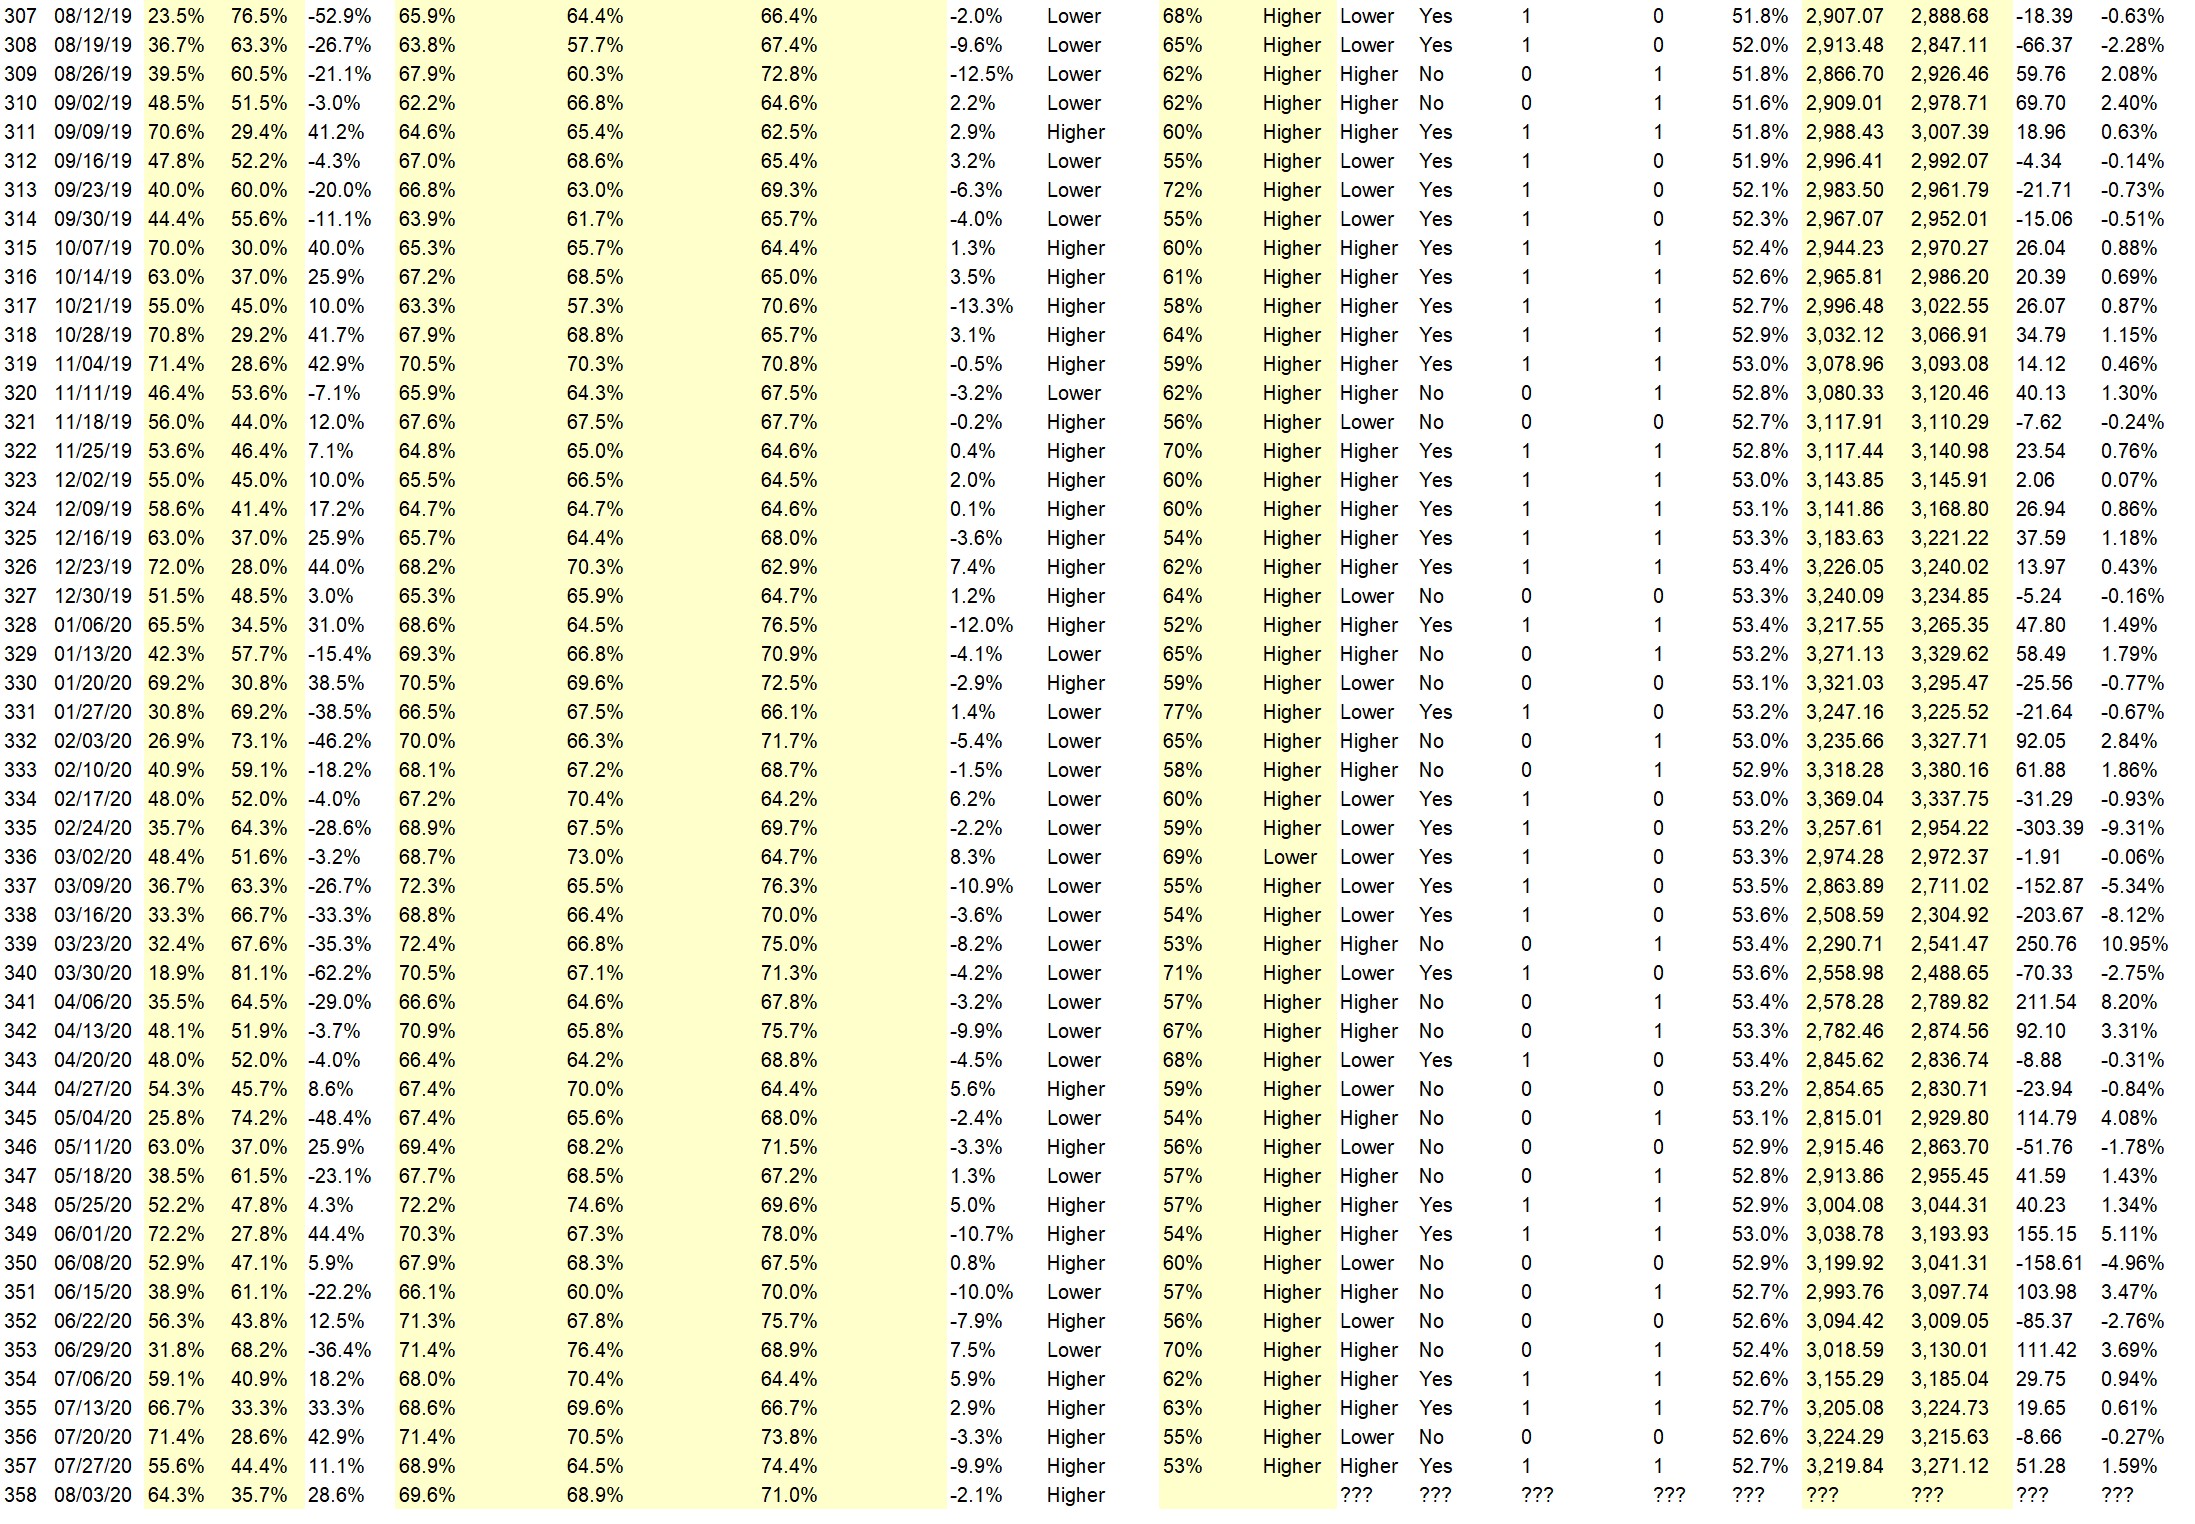
Full Weekly Results (full version of this chart available in the raw data spreadsheet for this week, “Date” field below lists the Monday of the week being predicted).
Overall Sentiment All-Time “Correct” Percentage: 53.2%
Overall Sentiment 52-Week “Correct” Percentage: 62.7%
Overall Sentiment 12-Week “Correct” Percentage: 63.6%
Only the previous 52 weeks of data are shown below, please download the raw data to see the full range of past data.
Weekly Reports Page: TimingResearch.com/reports
Raw Data Page: TimingResearch.com/rawdata
Current Survey Page: TimingResearch.com/currentsurvey
Any feedback: TimingResearch.com/contact
Email Alerts
Make sure you don’t miss all the future reports, show reminders, and bonus offers from TimingResearch, enter your best email here:
By signing up you agree to receive newsletter and marketing emails. You can unsubscribe at any time.
Privacy Policies
NOTE: The following open-ended answers are solely the opinions of the anonymous respondents to this survey. Responses are mostly unedited, but some have been reformatted slightly for to make them easier to read. Some irrelevant responses (e.g. “none”), or anything obviously fake, or copy and pasted responses have been omitted. All-caps responses have been changed to all lowercase. All responses for each week, unedited, are available in the raw data spreadsheets at TimingResearch.com/data.
Question #3. For your answer to Question #1, please share what specific reason(s) you think the S&P500 will be heading the direction you chose.
“Higher” Respondent Answers:
• Trend
• Split in AAP and TSLA will enable investor to buy more shares.Means more volume/demand and hence it will go up. It depend deal of TIK TAK that will jack the market more with an increase in Walmart and Microsoft stock prices.
• Philips curve gone
• Trend is still up
• It looks like by the end of the year the price will go to 4150 according to EW. So far, the trend is behaving like a perpetual mobile.
• Everything is going well. More good news than bad
• Election soon
• good till the election
• Trump is pulling in more votes n the polls with the Senate Red map
“Lower” Respondent Answers:
• S&P at 3500 should be the short-term resistance level; looking for an orderly pullback.
• Divergence
[AD] eBook: TSLA Options Trader (Complete Strategy Guide)
Question #4. What topic(s) would you most like to learn about related to trading or investing?
• Inside trading and hoe it effects.
• New stocks
• Psychology
• VHF trading lacks human weaknesses, so no known strategy can be applied against it.
• Interest rates
• options stategies
• Profit
Question #5. Additional Comments/Questions/Suggestions?
• Very soon or lator TSLA will burst as it has hardly any big no of cars and nothing so fast to come in market.Prices are being pushed up
[AD] eBook: TSLA Options Trader (Complete Strategy Guide)
Email Alerts
Make sure you don’t miss all the future reports, show reminders, and bonus offers from TimingResearch, enter your best email here:
By signing up you agree to receive newsletter and marketing emails. You can unsubscribe at any time.
Privacy Policies
Crowd Forecast News Report #361
[AD] eBook: TSLA Options Trader (Complete Strategy Guide)The new TimingResearch report for the week has been posted, you can download the full PDF report with the link below or you can read the full report in this post below.
Click here to download report in PDF format: TRReport082420.pdf
Question #1. Which direction do you think the S&P500 index will move from this coming Monday’s open to Friday’s close?
Higher: 75.0%
Lower: 25.0%
Higher/Lower Difference: 50.0%
Question #2. Rate your confidence in your answer to Question #2 by estimating the probability you have correctly predicted next week’s market move.
Average of All Responses: 70.0%
Average For “Higher” Responses: 70.8%
Average For “Lower” Responses: 67.5%
Higher/Lower Difference: 3.3%
Responses Submitted This Week: 15
52-Week Average Number of Responses: 26.4
TimingResearch Crowd Forecast Prediction: 58% Chance Higher
This prediction is an attempt by the editor of this newsletter to use the full 6+ year history of data collected from this project to forecast a probability estimate for whether this week’s sentiment is going to be correct and ultimately what the markets will do this coming week.
Details: Last week’s majority sentiment from the survey was 66.7% predicting Higher, and the Crowd Forecast Indicator prediction was 65% chance Higher; the S&P500 closed 0.50% Higher for the week. This week’s majority sentiment from the survey is 75.0% predicting Higher and with a greater average confidence from those who are predicting Higher. Similar conditions have occurred 36 times in the previous 360 weeks, with the majority sentiment (Higher) being correct 58% of the time but with an average S&P500 move of 0.04% Lower for the week. Based on that history, the TimingResearch Crowd Forecast Indicator is forecasting a 58% Chance that the S&P500 is going to move Higher this coming week.
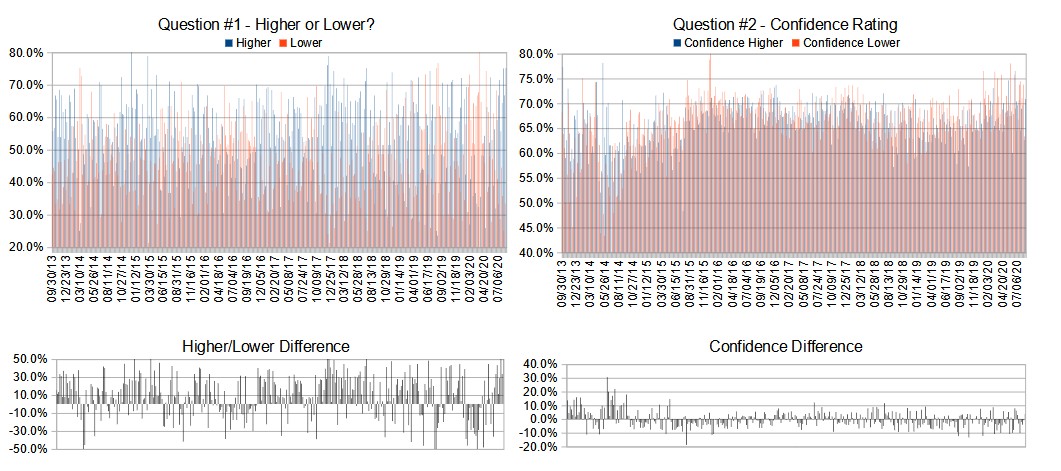
Raw Data Page (raw data files include full history spreadsheet and the above charts):
TimingResearch.com/data.
[AD] eBook: TSLA Options Trader (Complete Strategy Guide)
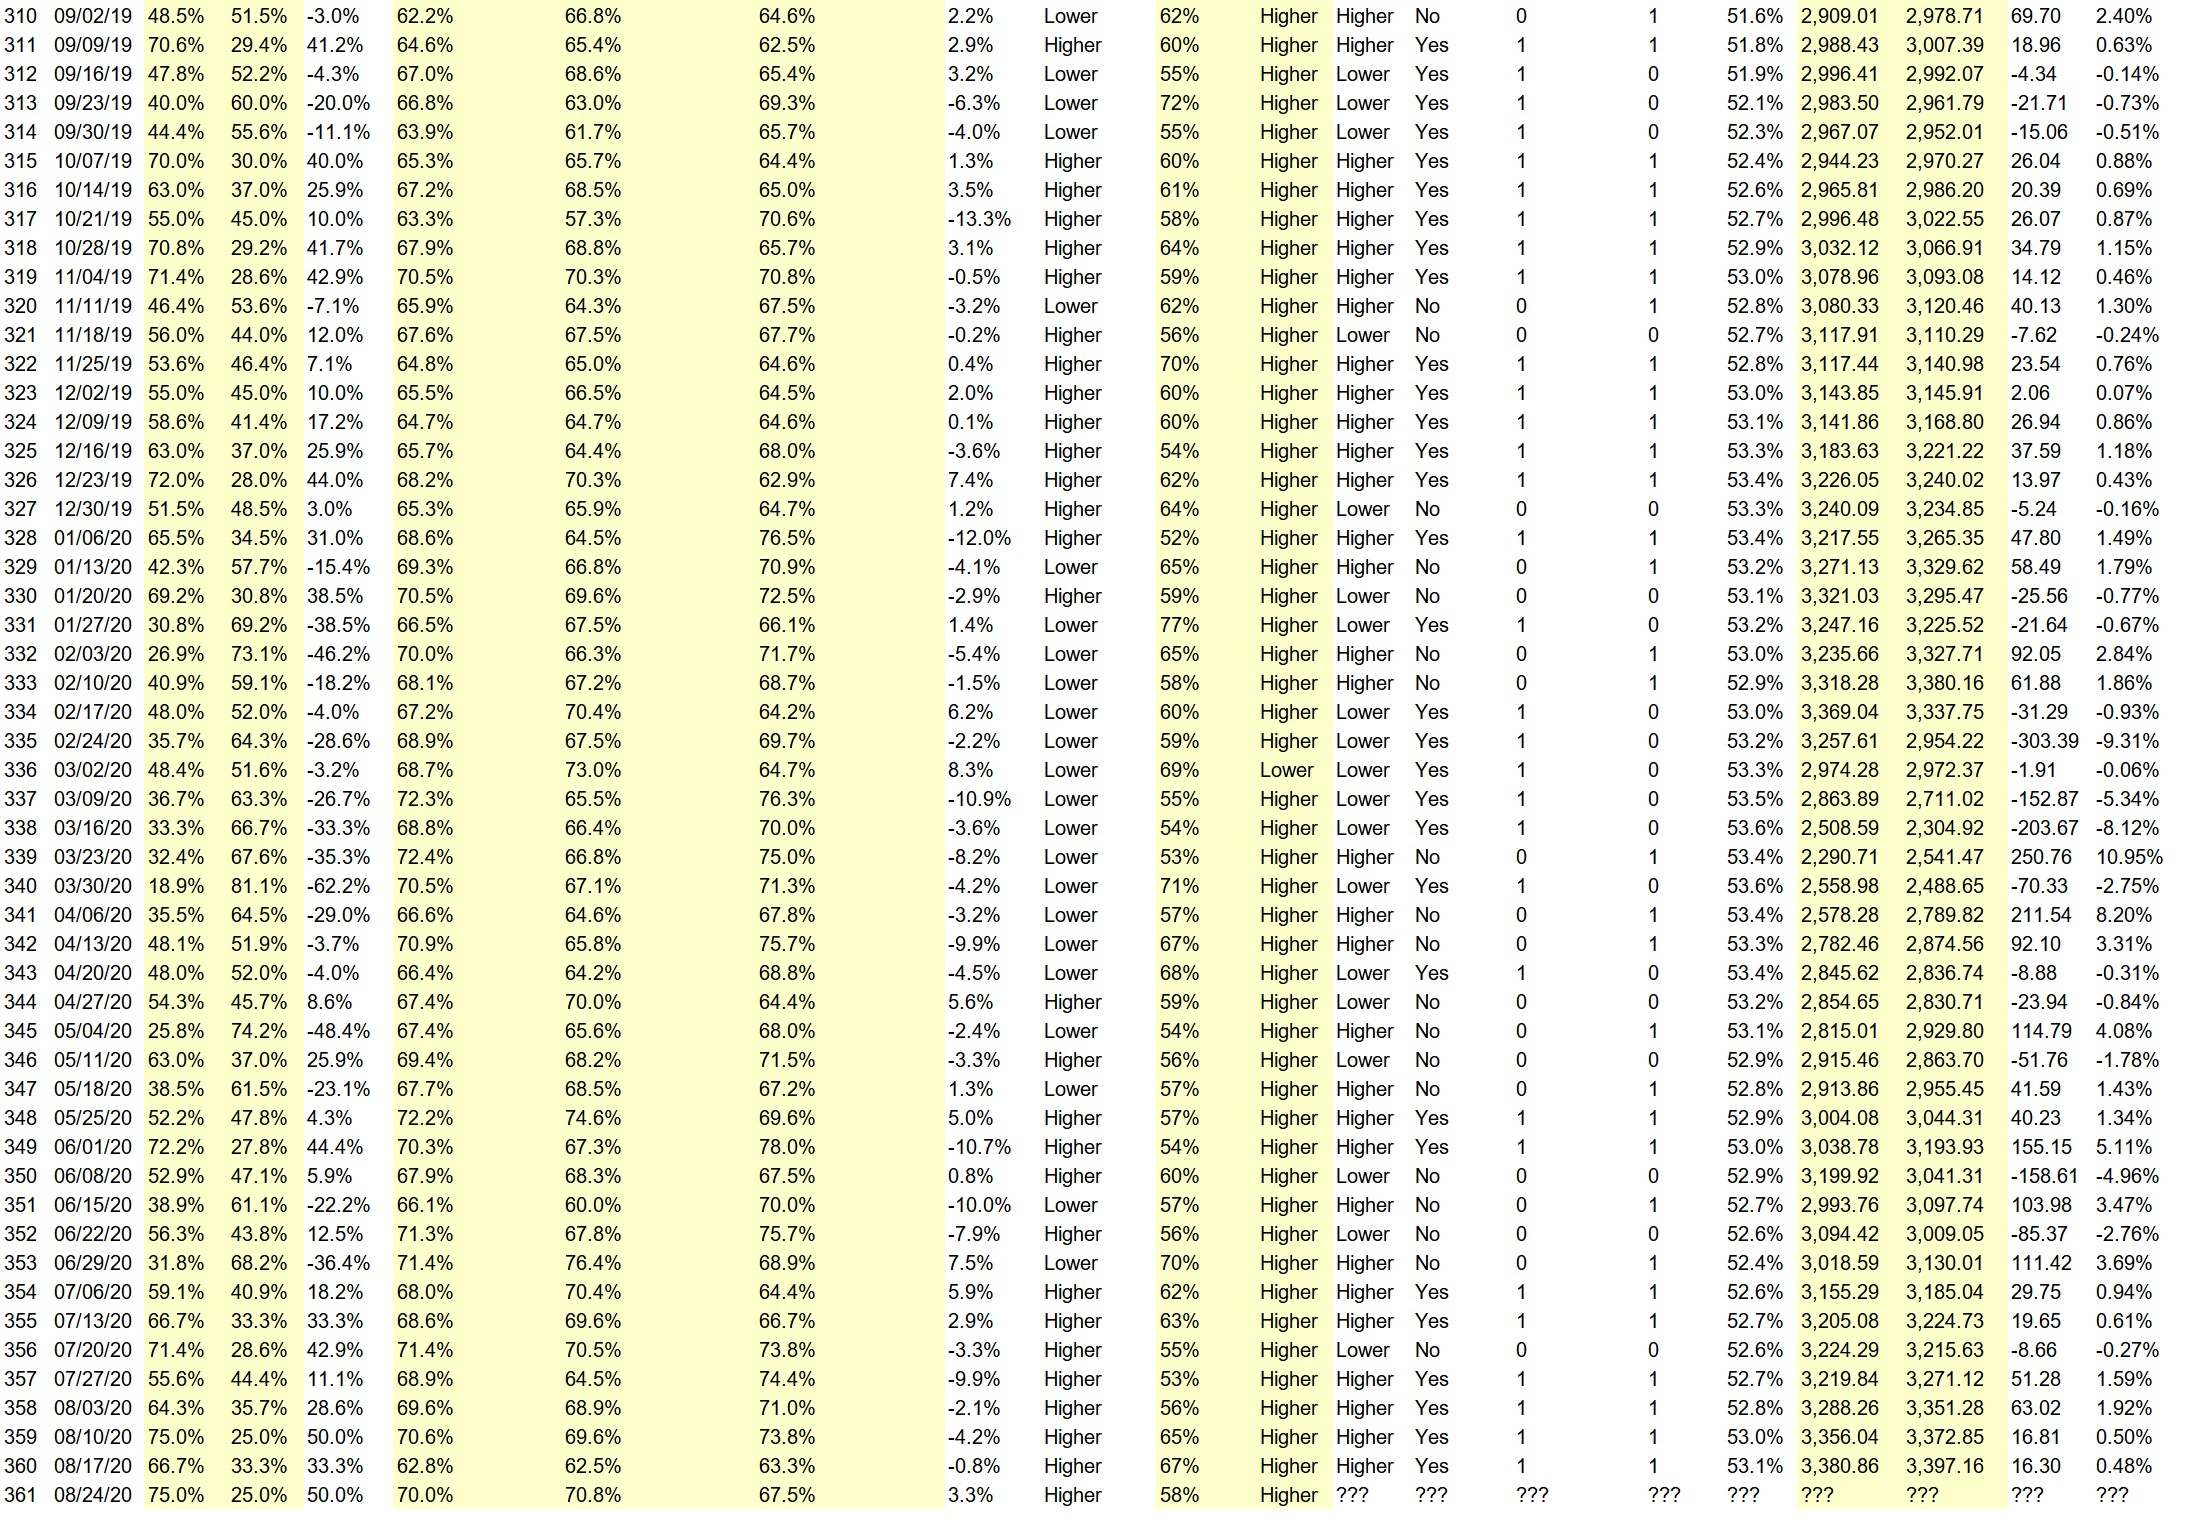
Full Weekly Results (full version of this chart available in the raw data spreadsheet for this week, “Date” field below lists the Monday of the week being predicted).
Overall Sentiment All-Time “Correct” Percentage: 53.1%
Overall Sentiment 52-Week “Correct” Percentage: 60.8%
Overall Sentiment 12-Week “Correct” Percentage: 54.5%
Only the previous 52 weeks of data are shown below, please download the raw data to see the full range of past data.
Weekly Reports Page: TimingResearch.com/reports
Raw Data Page: TimingResearch.com/rawdata
Current Survey Page: TimingResearch.com/currentsurvey
Any feedback: TimingResearch.com/contact
Email Alerts
Make sure you don’t miss all the future reports, show reminders, and bonus offers from TimingResearch, enter your best email here:
By signing up you agree to receive newsletter and marketing emails. You can unsubscribe at any time.
Privacy Policies
NOTE: The following open-ended answers are solely the opinions of the anonymous respondents to this survey. Responses are mostly unedited, but some have been reformatted slightly for to make them easier to read. Some irrelevant responses (e.g. “none”), or anything obviously fake, or copy and pasted responses have been omitted. All-caps responses have been changed to all lowercase. All responses for each week, unedited, are available in the raw data spreadsheets at TimingResearch.com/data.
Question #3. For your answer to Question #1, please share what specific reason(s) you think the S&P500 will be heading the direction you chose.
“Higher” Respondent Answers:
• Low confidence due to divergence in rates of change with SPY, IWM, QQQ Positive 40B monthly into Treasuries Positive COT Commercials buying Eminis and have been so for some time
Negative Very high sentiment by Small Trader. Usually small trader is wrong short term
• End of the month trading, more news is going to be released that will bump the markets higher
• The 20 and 50 MAE keep going up away from 200 MAE
• Irrational exuberance
• The bull is running until the election
• Trend
• Luquidity. News. Momentum.
• Optimism. Enthusiasm of APPL and TSLA stock split. Last week of August and lots of money needs to be invested in the market since interest rate is so low.
• The trend continues
“Lower” Respondent Answers:
• Lower Breath and negative volume
• The S&P appears to have stalled near the 3400 area. Also the latest leg of the advance is now long enough where a trace back is to be expected.
[AD] eBook: TSLA Options Trader (Complete Strategy Guide)
Question #4. What topic(s) would you most like to learn about related to trading or investing?
• currency exchange
• forecasting
• Psychology
• How to trade futures and how to use TOS tool for futures trading.
• Vix. Commodities.
• How find stocks with high momentum.
Question #5. Additional Comments/Questions/Suggestions?
• I don’t pay attention to the COVID madness. I do not believe the commercials for the most part do either.
[AD] eBook: TSLA Options Trader (Complete Strategy Guide)
Email Alerts
Make sure you don’t miss all the future reports, show reminders, and bonus offers from TimingResearch, enter your best email here:
By signing up you agree to receive newsletter and marketing emails. You can unsubscribe at any time.
Privacy Policies
Crowd Forecast News Report #360
[AD] eBook: TSLA Options Trader (Complete Strategy Guide)The new TimingResearch report for the week has been posted, you can download the full PDF report with the link below or you can read the full report in this post below.
Click here to download report in PDF format: TRReport081720.pdf
Question #1. Which direction do you think the S&P500 index will move from this coming Monday’s open to Friday’s close (August 17th-21st)?
Higher: 66.7%
Lower: 33.3%
Higher/Lower Difference: 33.3%
Question #2. Rate your confidence in your answer to Question #2 by estimating the probability you have correctly predicted next week’s market move.
Average of All Responses: 62.8%
Average For “Higher” Responses: 62.5%
Average For “Lower” Responses: 63.3%
Higher/Lower Difference: -0.8%
Responses Submitted This Week: 18
52-Week Average Number of Responses: 26.8
TimingResearch Crowd Forecast Prediction: 67% Chance Higher
This prediction is an attempt by the editor of this newsletter to use the full 6+ year history of data collected from this project to forecast a probability estimate for whether this week’s sentiment is going to be correct and ultimately what the markets will do this coming week.
Details: Last week’s majority sentiment from the survey was 75.0% predicting Higher, and the Crowd Forecast Indicator prediction was 65% chance Higher; the S&P500 closed 0.50% Higher for the week. This week’s majority sentiment from the survey is 66.7% predicting Higher but with a greater average confidence from those who are predicting Lower. Similar conditions have occurred 27 times in the previous 359 weeks, with the majority sentiment (Higher) being correct 67% of the time but with an average S&P500 move of 0.32% Higher for the week. Based on that history, the TimingResearch Crowd Forecast Indicator is forecasting a 67% Chance that the S&P500 is going to move Higher this coming week.
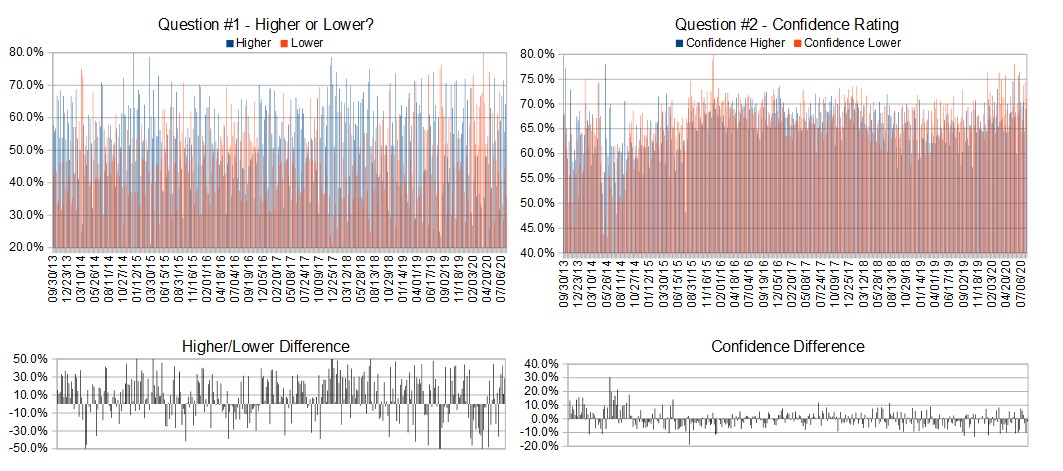
Raw Data Page (raw data files include full history spreadsheet and the above charts):
TimingResearch.com/data.
[AD] eBook: TSLA Options Trader (Complete Strategy Guide)
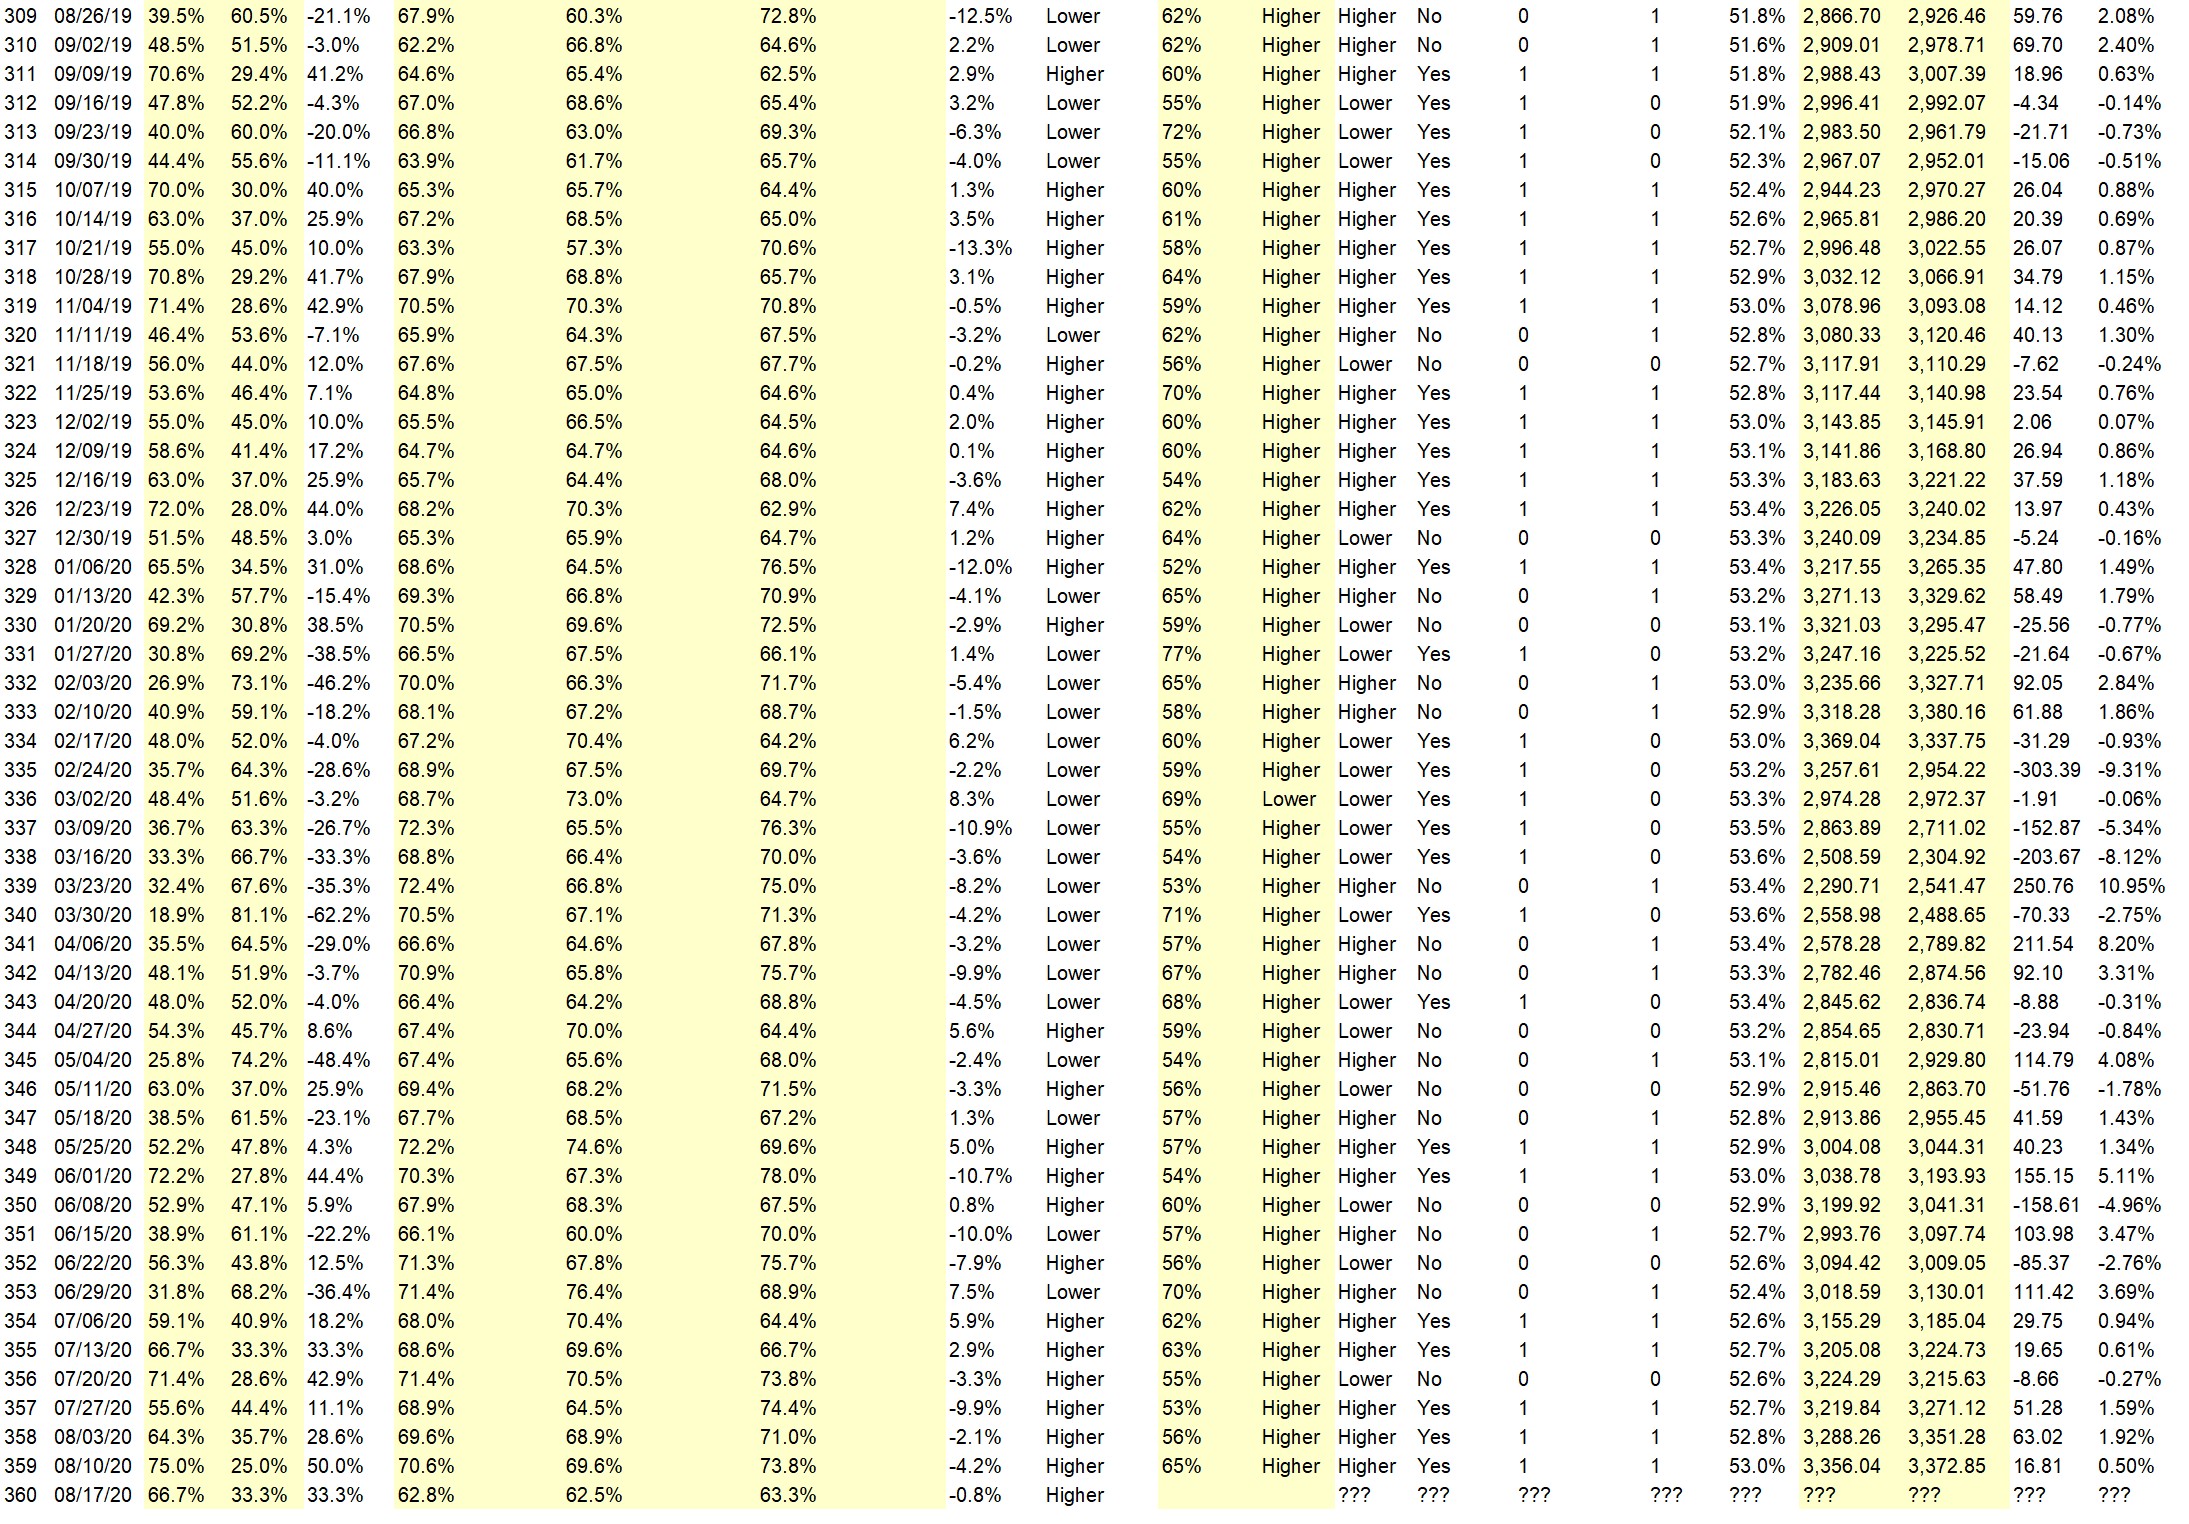
Full Weekly Results (full version of this chart available in the raw data spreadsheet for this week, “Date” field below lists the Monday of the week being predicted).
Overall Sentiment All-Time “Correct” Percentage: 53.0%
Overall Sentiment 52-Week “Correct” Percentage: 58.8%
Overall Sentiment 12-Week “Correct” Percentage: 54.5%
Only the previous 52 weeks of data are shown below, please download the raw data to see the full range of past data.
Weekly Reports Page: TimingResearch.com/reports
Raw Data Page: TimingResearch.com/rawdata
Current Survey Page: TimingResearch.com/currentsurvey
Any feedback: TimingResearch.com/contact
Email Alerts
Make sure you don’t miss all the future reports, show reminders, and bonus offers from TimingResearch, enter your best email here:
By signing up you agree to receive newsletter and marketing emails. You can unsubscribe at any time.
Privacy Policies
NOTE: The following open-ended answers are solely the opinions of the anonymous respondents to this survey. Responses are mostly unedited, but some have been reformatted slightly for to make them easier to read. Some irrelevant responses (e.g. “none”), or anything obviously fake, or copy and pasted responses have been omitted. All-caps responses have been changed to all lowercase. All responses for each week, unedited, are available in the raw data spreadsheets at TimingResearch.com/data.
Question #3. For your answer to Question #1, please share what specific reason(s) you think the S&P500 will be heading the direction you chose.
“Higher” Respondent Answers:
• COVID-19 cases are going down; NY city is opening up and created HOPE; some students will go back to school and parents will spend some money for back to school; Biden has chosen running VP, etc. In another words, less bad news.
• Trend continues, there are too many bears out there.
• It’s a continuation of the upward trend; and that liquidity is still around.
• Trend
• The trend is up until it’s not. I remain cautiously bullish. Good news bites will keep this boat afloat. Some bad news and my thought is there will be a pullback
• COT still is a Net Purchase for S&P E minies NASDAQ Eminies have a lower net sell last week
“Lower” Respondent Answers:
• excessive exhuberance
• Justing getting too high given the problem with COVID and the wrecked economy. Can’t ignore this situation forever.
• Nothing shows a possible drop in prices but the weakness of the past two trading days leads me to vigilance
• 1. reasons, The covid-19 is effecting the economy. 2. The Market will recover too soon.
[AD] eBook: TSLA Options Trader (Complete Strategy Guide)
Question #4. What would you most like to learn about related to trading?
• Trading Psychology
• How the hell do I make money?
• Overnight Trading-Options Strategies.
• Safe consistent income generation. I am semi-retired overseas and mostly work on cash flowing (inside tax advantaged IRAs) my stock and ETF holdings with covered calls. I also do some cash secured puts to earn and possibly accumulate new positions at a prices I like. I have not done any serious study on best timing methods for the sales. Should you simply sell ATM and walk away for the week? Is it better to sell options in blocks as the market moves to perhaps earn a bit more? For me, the best plan keeps it simple and as mechanical as possible.
• In a large amount of information that I gained from r.2009 telling me nothing is missing !?
• How to trade ES (E-mini), NQ, GC, ZB/ZN, and what are the characters of each
Question #5. Additional Comments/Questions/Suggestions?
• Mini-Market tradings.
[AD] eBook: TSLA Options Trader (Complete Strategy Guide)
Email Alerts
Make sure you don’t miss all the future reports, show reminders, and bonus offers from TimingResearch, enter your best email here:
By signing up you agree to receive newsletter and marketing emails. You can unsubscribe at any time.
Privacy Policies
Crowd Forecast News Report #359
[AD] eBook: TSLA Options Trader (Complete Strategy Guide)The new TimingResearch report for the week has been posted, you can download the full PDF report with the link below or you can read the full report in this post below.
Click here to download report in PDF format: TRReport081020.pdf
Question #1. Which direction do you think the S&P500 index will move from this coming Monday’s open to Friday’s close (August 10th-14th)?
Higher: 75.0%
Lower: 25.0%
Higher/Lower Difference: 50.0%
Question #2. Rate your confidence in your answer to Question #2 by estimating the probability you have correctly predicted next week’s market move.
Average of All Responses: 70.6%
Average For “Higher” Responses: 69.6%
Average For “Lower” Responses: 73.8%
Higher/Lower Difference: -4.2%
Responses Submitted This Week: 16
52-Week Average Number of Responses: 27.1
TimingResearch Crowd Forecast Prediction: 65% Chance Higher
This prediction is an attempt by the editor of this newsletter to use the full 6+ year history of data collected from this project to forecast a probability estimate for whether this week’s sentiment is going to be correct and ultimately what the markets will do this coming week.
Details: Last week’s majority sentiment from the survey was 64.3% predicting Higher, and the Crowd Forecast Indicator prediction was 56% chance Higher; the S&P500 closed 1.92% Higher for the week. This week’s majority sentiment from the survey is 75% predicting Higher but with a greater average confidence from those who are predicting Lower. Similar conditions have occurred 26 times in the previous 358 weeks, with the majority sentiment (Higher) being correct 65% of the time but with an average S&P500 move of 0.31% Higher for the week. Based on that history, the TimingResearch Crowd Forecast Indicator is forecasting a 65% Chance that the S&P500 is going to move Higher this coming week.
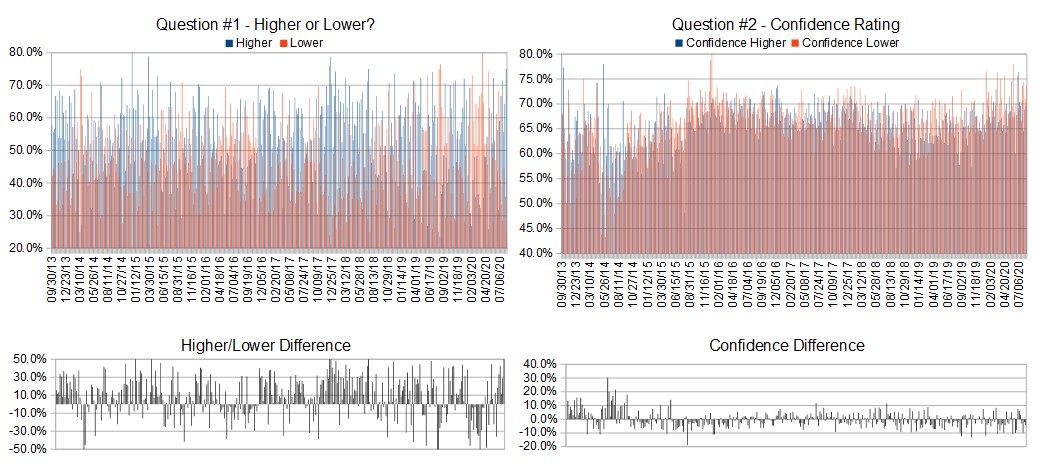
Raw Data Page (raw data files include full history spreadsheet and the above charts):
TimingResearch.com/data.
[AD] eBook: TSLA Options Trader (Complete Strategy Guide)
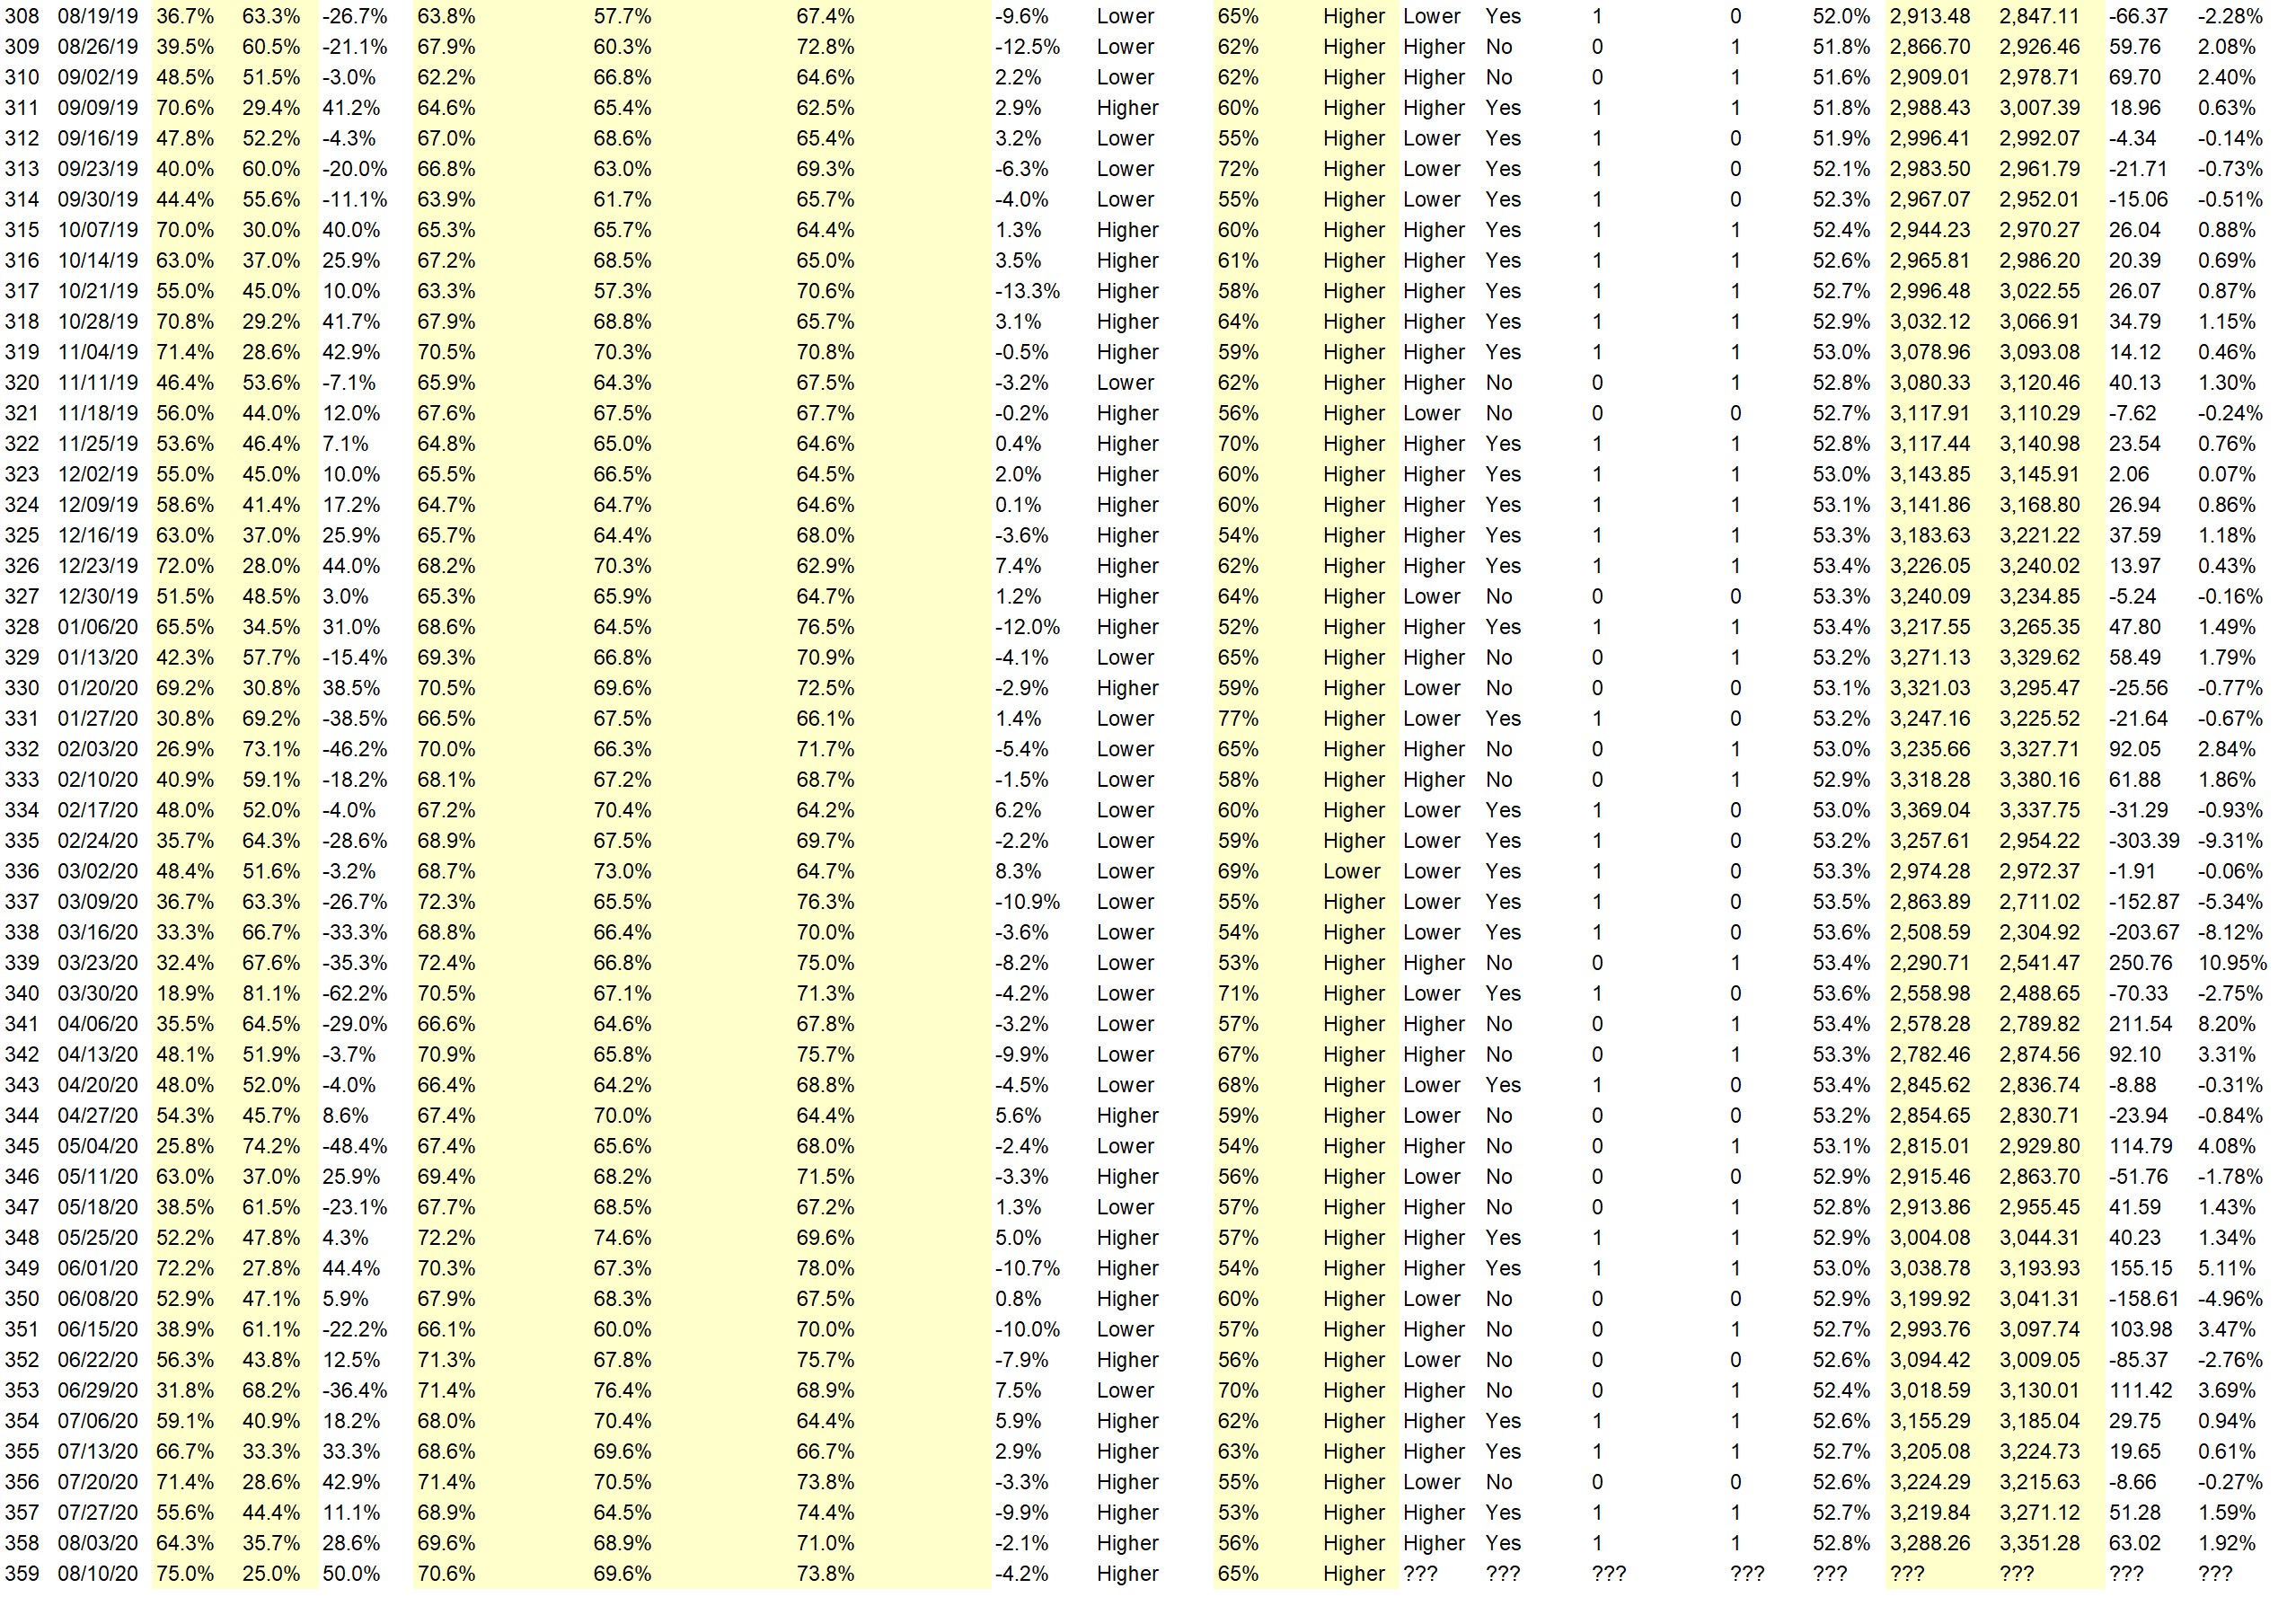
Full Weekly Results (full version of this chart available in the raw data spreadsheet for this week, “Date” field below lists the Monday of the week being predicted).
Overall Sentiment All-Time “Correct” Percentage: 52.8%
Overall Sentiment 52-Week “Correct” Percentage: 58.8%
Overall Sentiment 12-Week “Correct” Percentage: 54.5%
Only the previous 52 weeks of data are shown below, please download the raw data to see the full range of past data.
Weekly Reports Page: TimingResearch.com/reports
Raw Data Page: TimingResearch.com/rawdata
Current Survey Page: TimingResearch.com/currentsurvey
Any feedback: TimingResearch.com/contact
Email Alerts
Make sure you don’t miss all the future reports, show reminders, and bonus offers from TimingResearch, enter your best email here:
By signing up you agree to receive newsletter and marketing emails. You can unsubscribe at any time.
Privacy Policies
NOTE: The following open-ended answers are solely the opinions of the anonymous respondents to this survey. Responses are mostly unedited, but some have been reformatted slightly for to make them easier to read. Some irrelevant responses (e.g. “none”), or anything obviously fake, or copy and pasted responses have been omitted. All-caps responses have been changed to all lowercase. All responses for each week, unedited, are available in the raw data spreadsheets at TimingResearch.com/data.
Question #3. For your answer to Question #1, please share what specific reason(s) you think the S&P500 will be heading the direction you chose.
“Higher” Respondent Answers:
• Trend
• FAANG
• COT EMinis more postivie
• Trend continues
• The trend is still our friend
• The trend is still up. I am cautiously bullish. We do see some signs on our side of the pond (SE Asia) that not all is well in local economies and who knows, will there be a spill-over effect to US markets?
• Price will be upward with no bad news.
• The 20 day MA is way above the 50 day MA which is even feather above the 200 day MA .
• The Trillions USD from Jay Powell and the open spigot waiting to spew $$$ defies ALL other market-affecting data. Enough said– not dismal employment reports, not dumb W.H tweets, not Covid world-worst results, will affect the S&p 500.
“Lower” Respondent Answers:
• The market was upward parabolic this past week. Due for corrective action this coming week.
[AD] eBook: TSLA Options Trader (Complete Strategy Guide)
Question #4. What procedures do you use for trade management?
• Stops
• I have a simple set of rules in place that cover up. down or sideways markets and especially when to roll option positions. In addition, because of the part of the world I live in and sometimes unreliable internet connection, I have made plans for incoming bad weather events and occasional natural disasters.My trade may not always end with the max potential profit but we will never wake up to “the bad surprise.”
• Stop Loss
• Take profits at 100% and exit if down three days in a row.
• T.A, Momemtum charts, GAP.
Question #5. Additional Comments/Questions/Suggestions?
• Kept moving 8 days in a row. Worried that it will need to correct.
[AD] eBook: TSLA Options Trader (Complete Strategy Guide)
Email Alerts
Make sure you don’t miss all the future reports, show reminders, and bonus offers from TimingResearch, enter your best email here:
By signing up you agree to receive newsletter and marketing emails. You can unsubscribe at any time.
Privacy Policies
Crowd Forecast News Report #358
[AD] eBook: TSLA Options Trader (Complete Strategy Guide)The new TimingResearch report for the week has been posted, you can download the full PDF report with the link below or you can read the full report in this post below.
Click here to download report in PDF format: TRReport080320.pdf
Question #1. Which direction do you think the S&P500 index will move from this coming Monday’s open to Friday’s close (August 3rd-7th)?
Higher: 64.3%
Lower: 35.7%
Higher/Lower Difference: 28.6%
Question #2. Rate your confidence in your answer to Question #2 by estimating the probability you have correctly predicted next week’s market move.
Average of All Responses: 69.6%
Average For “Higher” Responses: 68.9%
Average For “Lower” Responses: 71.0%
Higher/Lower Difference: -2.1%
Responses Submitted This Week: 15
52-Week Average Number of Responses: 27.4
TimingResearch Crowd Forecast Prediction: 56% Chance Higher
This prediction is an attempt by the editor of this newsletter to use the full 6+ year history of data collected from this project to forecast a probability estimate for whether this week’s sentiment is going to be correct and ultimately what the markets will do this coming week.
Details: Last week’s majority sentiment from the survey was 55.6% predicting Higher, and the Crowd Forecast Indicator prediction was 53% chance Higher; the S&P500 closed 1.59% Higher for the week. This week’s majority sentiment from the survey is 64.3% predicting Higher but with a greater average confidence from those who are predicting Lower. Similar conditions have occurred 52 times in the previous 357 weeks, with the majority sentiment (Higher) being correct 56% of the time but with an average S&P500 move of 0.05% Lower for the week. Based on that history, the TimingResearch Crowd Forecast Indicator is forecasting a 56% Chance that the S&P500 is going to move Higher this coming week.
Raw Data Page (raw data files include full history spreadsheet and the above charts):
TimingResearch.com/data.
[AD] eBook: TSLA Options Trader (Complete Strategy Guide)
Full Weekly Results (full version of this chart available in the raw data spreadsheet for this week, “Date” field below lists the Monday of the week being predicted).
Overall Sentiment All-Time “Correct” Percentage: 52.7%
Overall Sentiment 52-Week “Correct” Percentage: 58.8%
Overall Sentiment 12-Week “Correct” Percentage: 45.5%
Only the previous 52 weeks of data are shown below, please download the raw data to see the full range of past data.
Weekly Reports Page: TimingResearch.com/reports
Raw Data Page: TimingResearch.com/rawdata
Current Survey Page: TimingResearch.com/currentsurvey
Any feedback: TimingResearch.com/contact
Email Alerts
Make sure you don’t miss all the future reports, show reminders, and bonus offers from TimingResearch, enter your best email here:
By signing up you agree to receive newsletter and marketing emails. You can unsubscribe at any time.
Privacy Policies
NOTE: The following open-ended answers are solely the opinions of the anonymous respondents to this survey. Responses are mostly unedited, but some have been reformatted slightly for to make them easier to read. Some irrelevant responses (e.g. “none”), or anything obviously fake, or copy and pasted responses have been omitted. All-caps responses have been changed to all lowercase. All responses for each week, unedited, are available in the raw data spreadsheets at TimingResearch.com/data.
Question #3. For your answer to Question #1, please share what specific reason(s) you think the S&P500 will be heading the direction you chose.
“Higher” Respondent Answers:
• Companies earnings have been good so far and the next stimulus package would be passed by the Congress.
• August is up to start with then turns down
• Expecting that optimism in the tech sector and continued market support from the Fed will lead to a higher S&P this coming week.
• Technical analysis
• Trend continues :(
• Trend
“Lower” Respondent Answers:
• stocks are too close to their highs.
• Forcibly raising the price acts like a resurrection of a dead cat.
• sentiment Corona
[AD] eBook: TSLA Options Trader (Complete Strategy Guide)
Question #4. What styles of trading or methodologies have you had the most success with?
• Options & trading securities
• Swing trading of stocks.
• elliott wave Fibonacci on price and time moments analysis
• options
• Position trading
• With Elliot wave strategy+crossing MA.
Question #5. Additional Comments/Questions/Suggestions?
• none
[AD] eBook: TSLA Options Trader (Complete Strategy Guide)
Email Alerts
Make sure you don’t miss all the future reports, show reminders, and bonus offers from TimingResearch, enter your best email here:
By signing up you agree to receive newsletter and marketing emails. You can unsubscribe at any time.
Privacy Policies
Crowd Forecast News Report #357
[AD] eBook: TSLA Options Trader (Complete Strategy Guide)The new TimingResearch report for the week has been posted, you can download the full PDF report with the link below or you can read the full report in this post below.
Click here to download report in PDF format: TRReport072720.pdf
Question #1. Which direction do you think the S&P500 index will move from this coming Monday’s open to Friday’s close (July 27th-31st)?
Higher: 55.6%
Lower: 44.4%
Higher/Lower Difference: 11.1%
Question #2. Rate your confidence in your answer to Question #2 by estimating the probability you have correctly predicted next week’s market move.
Average of All Responses: 68.9%
Average For “Higher” Responses: 64.5%
Average For “Lower” Responses: 74.4%
Higher/Lower Difference: -9.9%
Responses Submitted This Week: 18
52-Week Average Number of Responses: 27.8
TimingResearch Crowd Forecast Prediction: 53% Chance Higher
This prediction is an attempt by the editor of this newsletter to use the full 6+ year history of data collected from this project to forecast a probability estimate for whether this week’s sentiment is going to be correct and ultimately what the markets will do this coming week.
Details: Last week’s majority sentiment from the survey was 71.4% predicting Higher, and the Crowd Forecast Indicator prediction was 55% chance Higher; the S&P500 closed 0.27% Lower for the week. This week’s majority sentiment from the survey is 55.6% predicting Higher but with a greater average confidence from those who are predicting Lower. Similar conditions have occurred 45 times in the previous 356 weeks, with the majority sentiment (Higher) being correct 53% of the time and with an average S&P500 move of 0.05% Higher for the week. Based on that history, the TimingResearch Crowd Forecast Indicator is forecasting a 53% Chance that the S&P500 is going to move Higher this coming week.
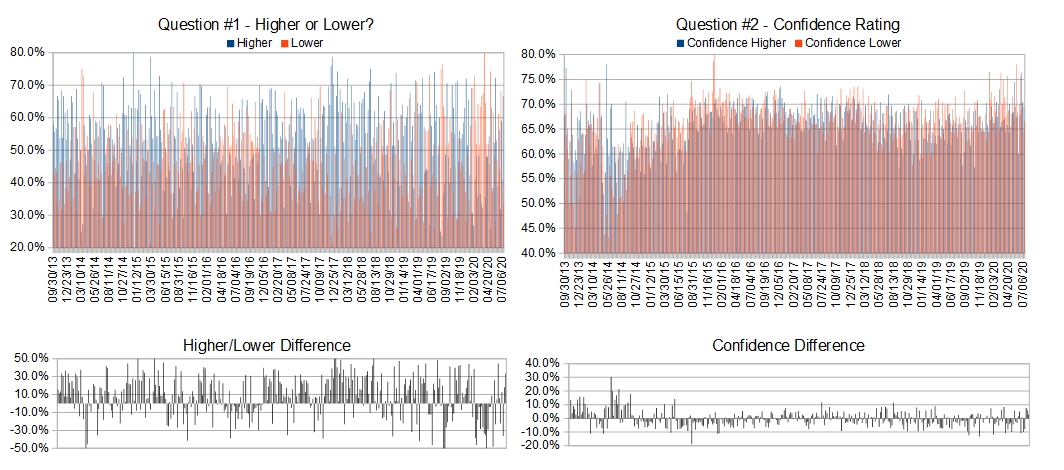
Raw Data Page (raw data files include full history spreadsheet and the above charts):
TimingResearch.com/data.
[AD] eBook: TSLA Options Trader (Complete Strategy Guide)
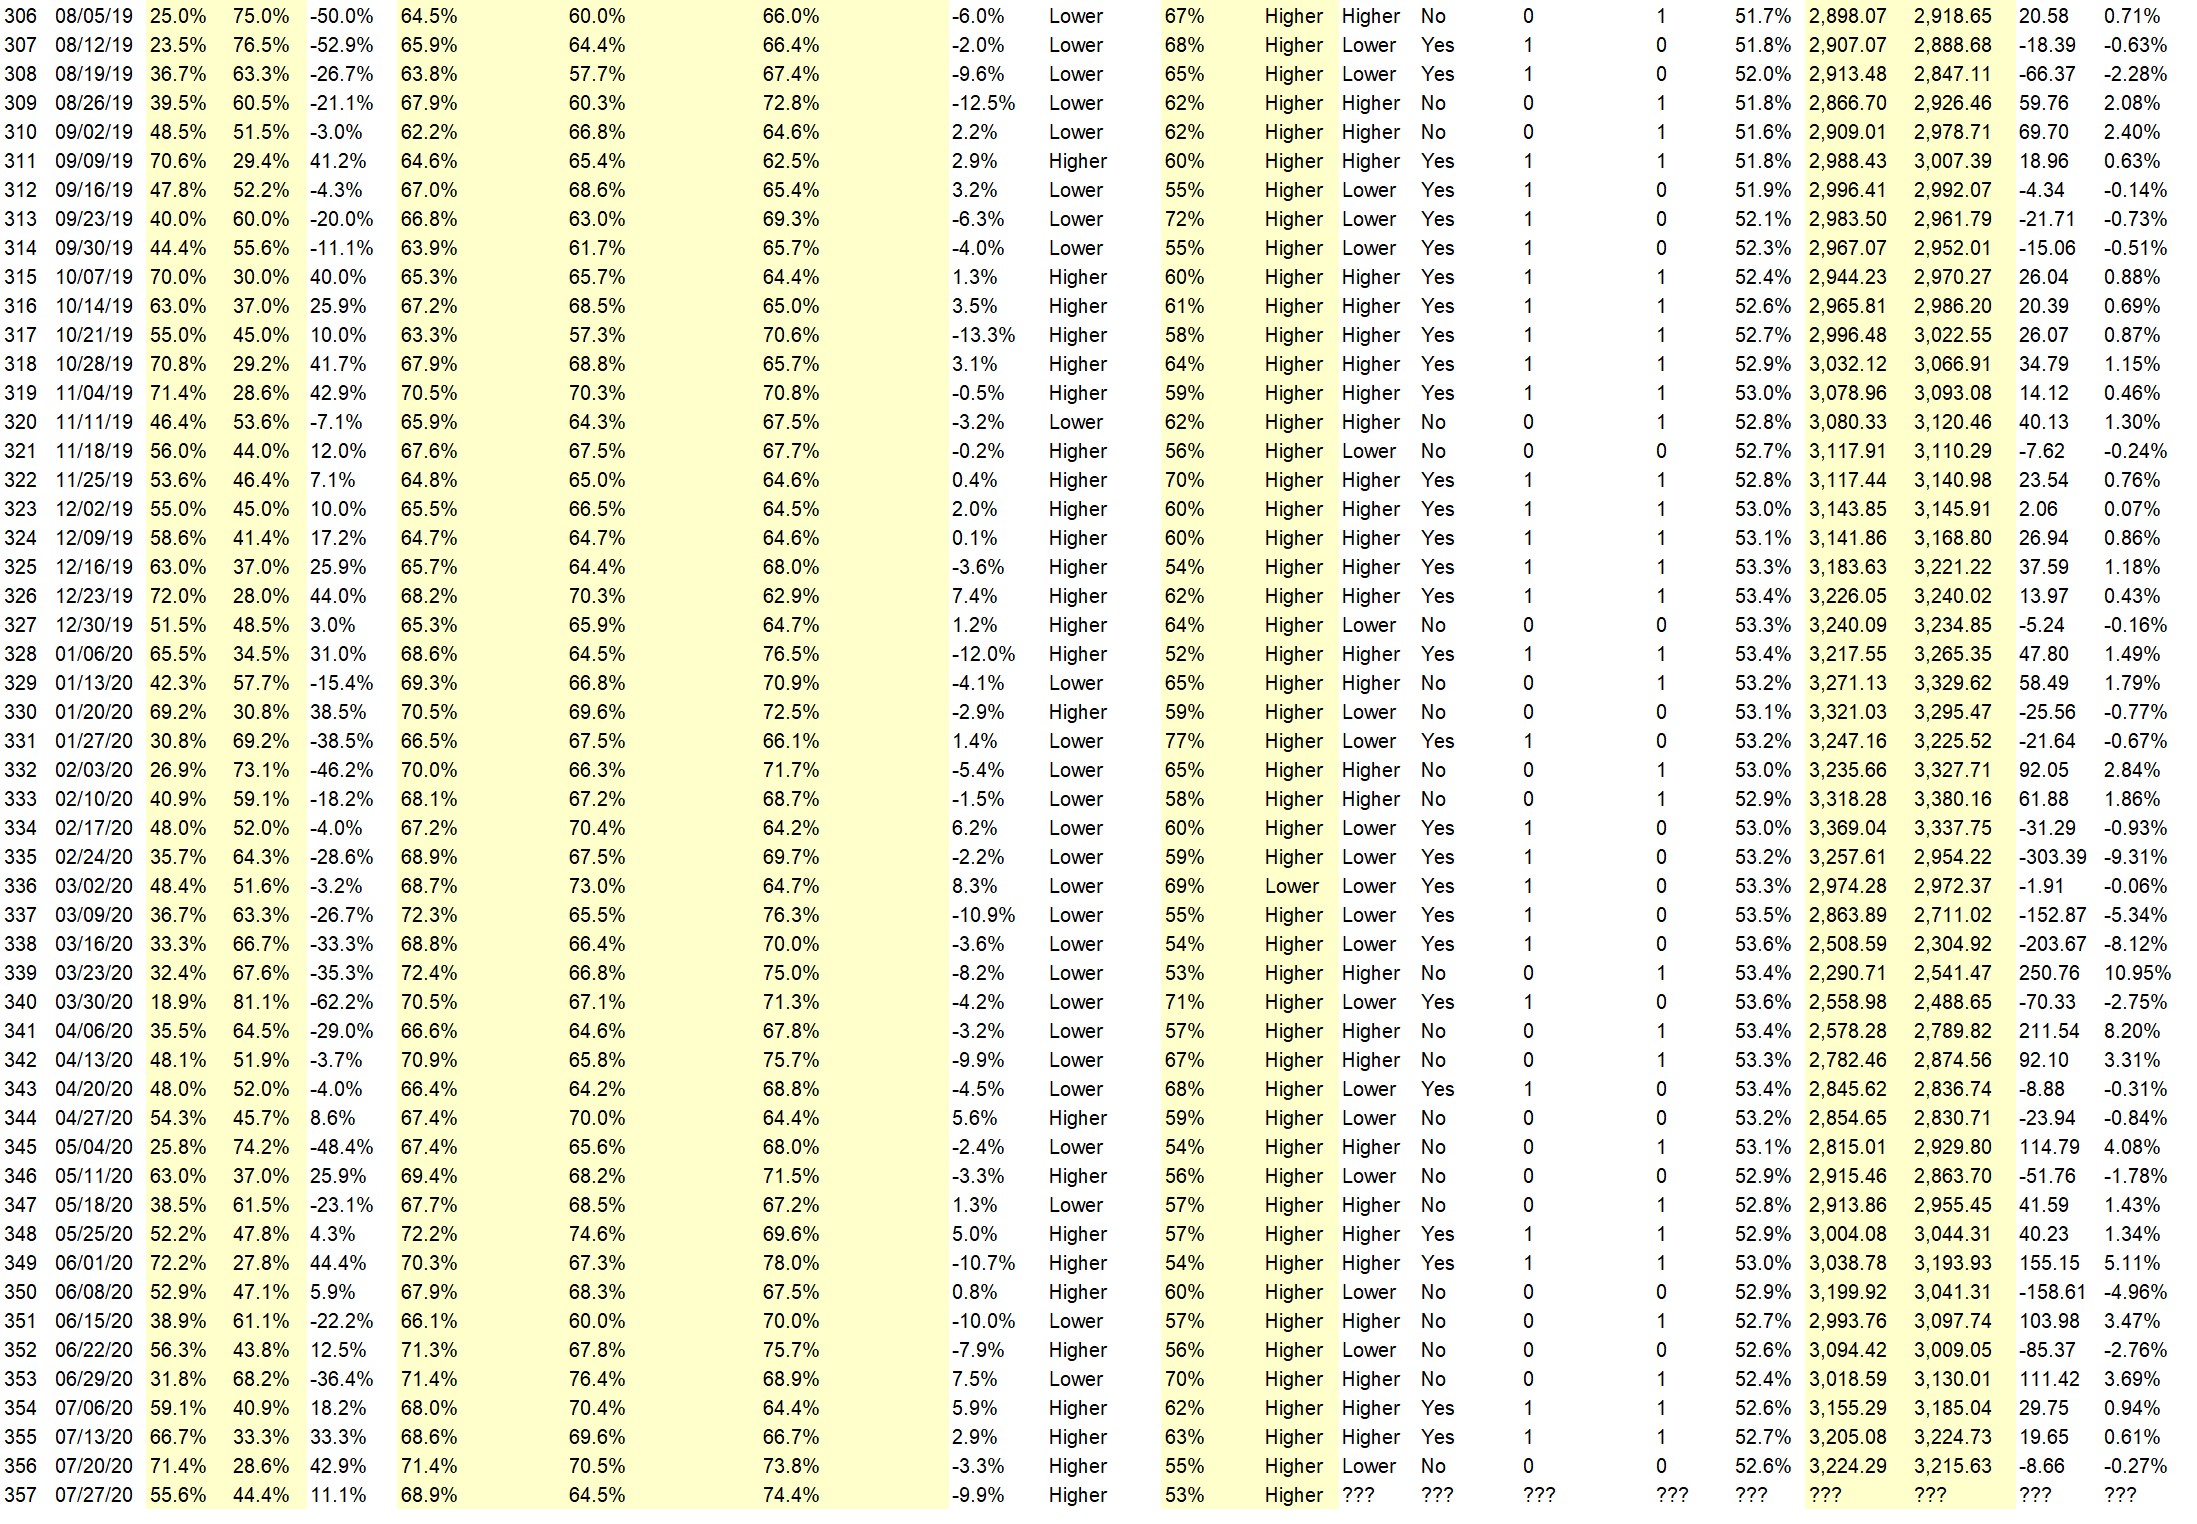
Full Weekly Results (full version of this chart available in the raw data spreadsheet for this week, “Date” field below lists the Monday of the week being predicted).
Overall Sentiment All-Time “Correct” Percentage: 52.6%
Overall Sentiment 52-Week “Correct” Percentage: 56.9%
Overall Sentiment 12-Week “Correct” Percentage: 36.4%
Only the previous 52 weeks of data are shown below, please download the raw data to see the full range of past data.
Weekly Reports Page: TimingResearch.com/reports
Raw Data Page: TimingResearch.com/rawdata
Current Survey Page: TimingResearch.com/currentsurvey
Any feedback: TimingResearch.com/contact
Email Alerts
Make sure you don’t miss all the future reports, show reminders, and bonus offers from TimingResearch, enter your best email here:
By signing up you agree to receive newsletter and marketing emails. You can unsubscribe at any time.
Privacy Policies
NOTE: The following open-ended answers are solely the opinions of the anonymous respondents to this survey. Responses are mostly unedited, but some have been reformatted slightly for to make them easier to read. Some irrelevant responses (e.g. “none”), or anything obviously fake, or copy and pasted responses have been omitted. All-caps responses have been changed to all lowercase. All responses for each week, unedited, are available in the raw data spreadsheets at TimingResearch.com/data.
Question #3. For your answer to Question #1, please share what specific reason(s) you think the S&P500 will be heading the direction you chose.
“Higher” Respondent Answers:
• COT positive more buys than sells
• Earnings reports China and it’s bad politics won’t stop American businesses
• Positive earnings outlook
• Positive bias, expectations of continued injects of monetary and fiscal stimulus, retail participation.
• Buing opportunities and new virus medicals
• The trend is still up
“Lower” Respondent Answers:
• By last veek candles, maybe to 3000 USD price.
• The relentless growth of COVID cases and deaths, China issues, bad poll numbers for Trump, market overbought all contribute.
• Rally needs a rest
• The chart looks similar to what it looked like in Feb (3rd week), when it was starting to turn down into a sizable drop.
• A. Market is totally overbought, especially tech B. Bad news continues – Civil unrest, China conflict, continued pandemic
• USA & china trade conflict , Covid-19 and breaking below 16 of july low (3198) and next 28 june low ( 2994) further downward move on it is way , re daily chart.
[AD] eBook: TSLA Options Trader (Complete Strategy Guide)
Question #4. What trading software/platform(s) do you use to execute your trades?
• Schwab StreetSmart Edge
• MT4 platform , i prefer simple trading platform as i am a software dump)
• E-Trade
• TOS
• IB, Fidessa
• Trade station.
• Think or Swim
• Fidelity & Infinity
• mt4
Question #5. Additional Comments/Questions/Suggestions?
• Viva standard & poor 500
[AD] eBook: TSLA Options Trader (Complete Strategy Guide)
Email Alerts
Make sure you don’t miss all the future reports, show reminders, and bonus offers from TimingResearch, enter your best email here:
By signing up you agree to receive newsletter and marketing emails. You can unsubscribe at any time.
Privacy Policies
Crowd Forecast News Report #356
[AD] eBook: TSLA Options Trader (Complete Strategy Guide)The new TimingResearch report for the week has been posted, you can download the full PDF report with the link below or you can read the full report in this post below.
Click here to download report in PDF format: TRReport072020.pdf
Question #1. Which direction do you think the S&P500 index will move from this coming Monday’s open to Friday’s close (July 20th-24th)?
Higher: 71.4%
Lower: 28.6%
Higher/Lower Difference: 42.9%
Question #2. Rate your confidence in your answer to Question #2 by estimating the probability you have correctly predicted next week’s market move.
Average of All Responses: 71.4%
Average For “Higher” Responses: 70.5%
Average For “Lower” Responses: 73.8%
Higher/Lower Difference: -3.3%
Responses Submitted This Week: 16
52-Week Average Number of Responses: 28.2
TimingResearch Crowd Forecast Prediction: 55% Chance Higher
This prediction is an attempt by the editor of this newsletter to use the full 6+ year history of data collected from this project to forecast a probability estimate for whether this week’s sentiment is going to be correct and ultimately what the markets will do this coming week.
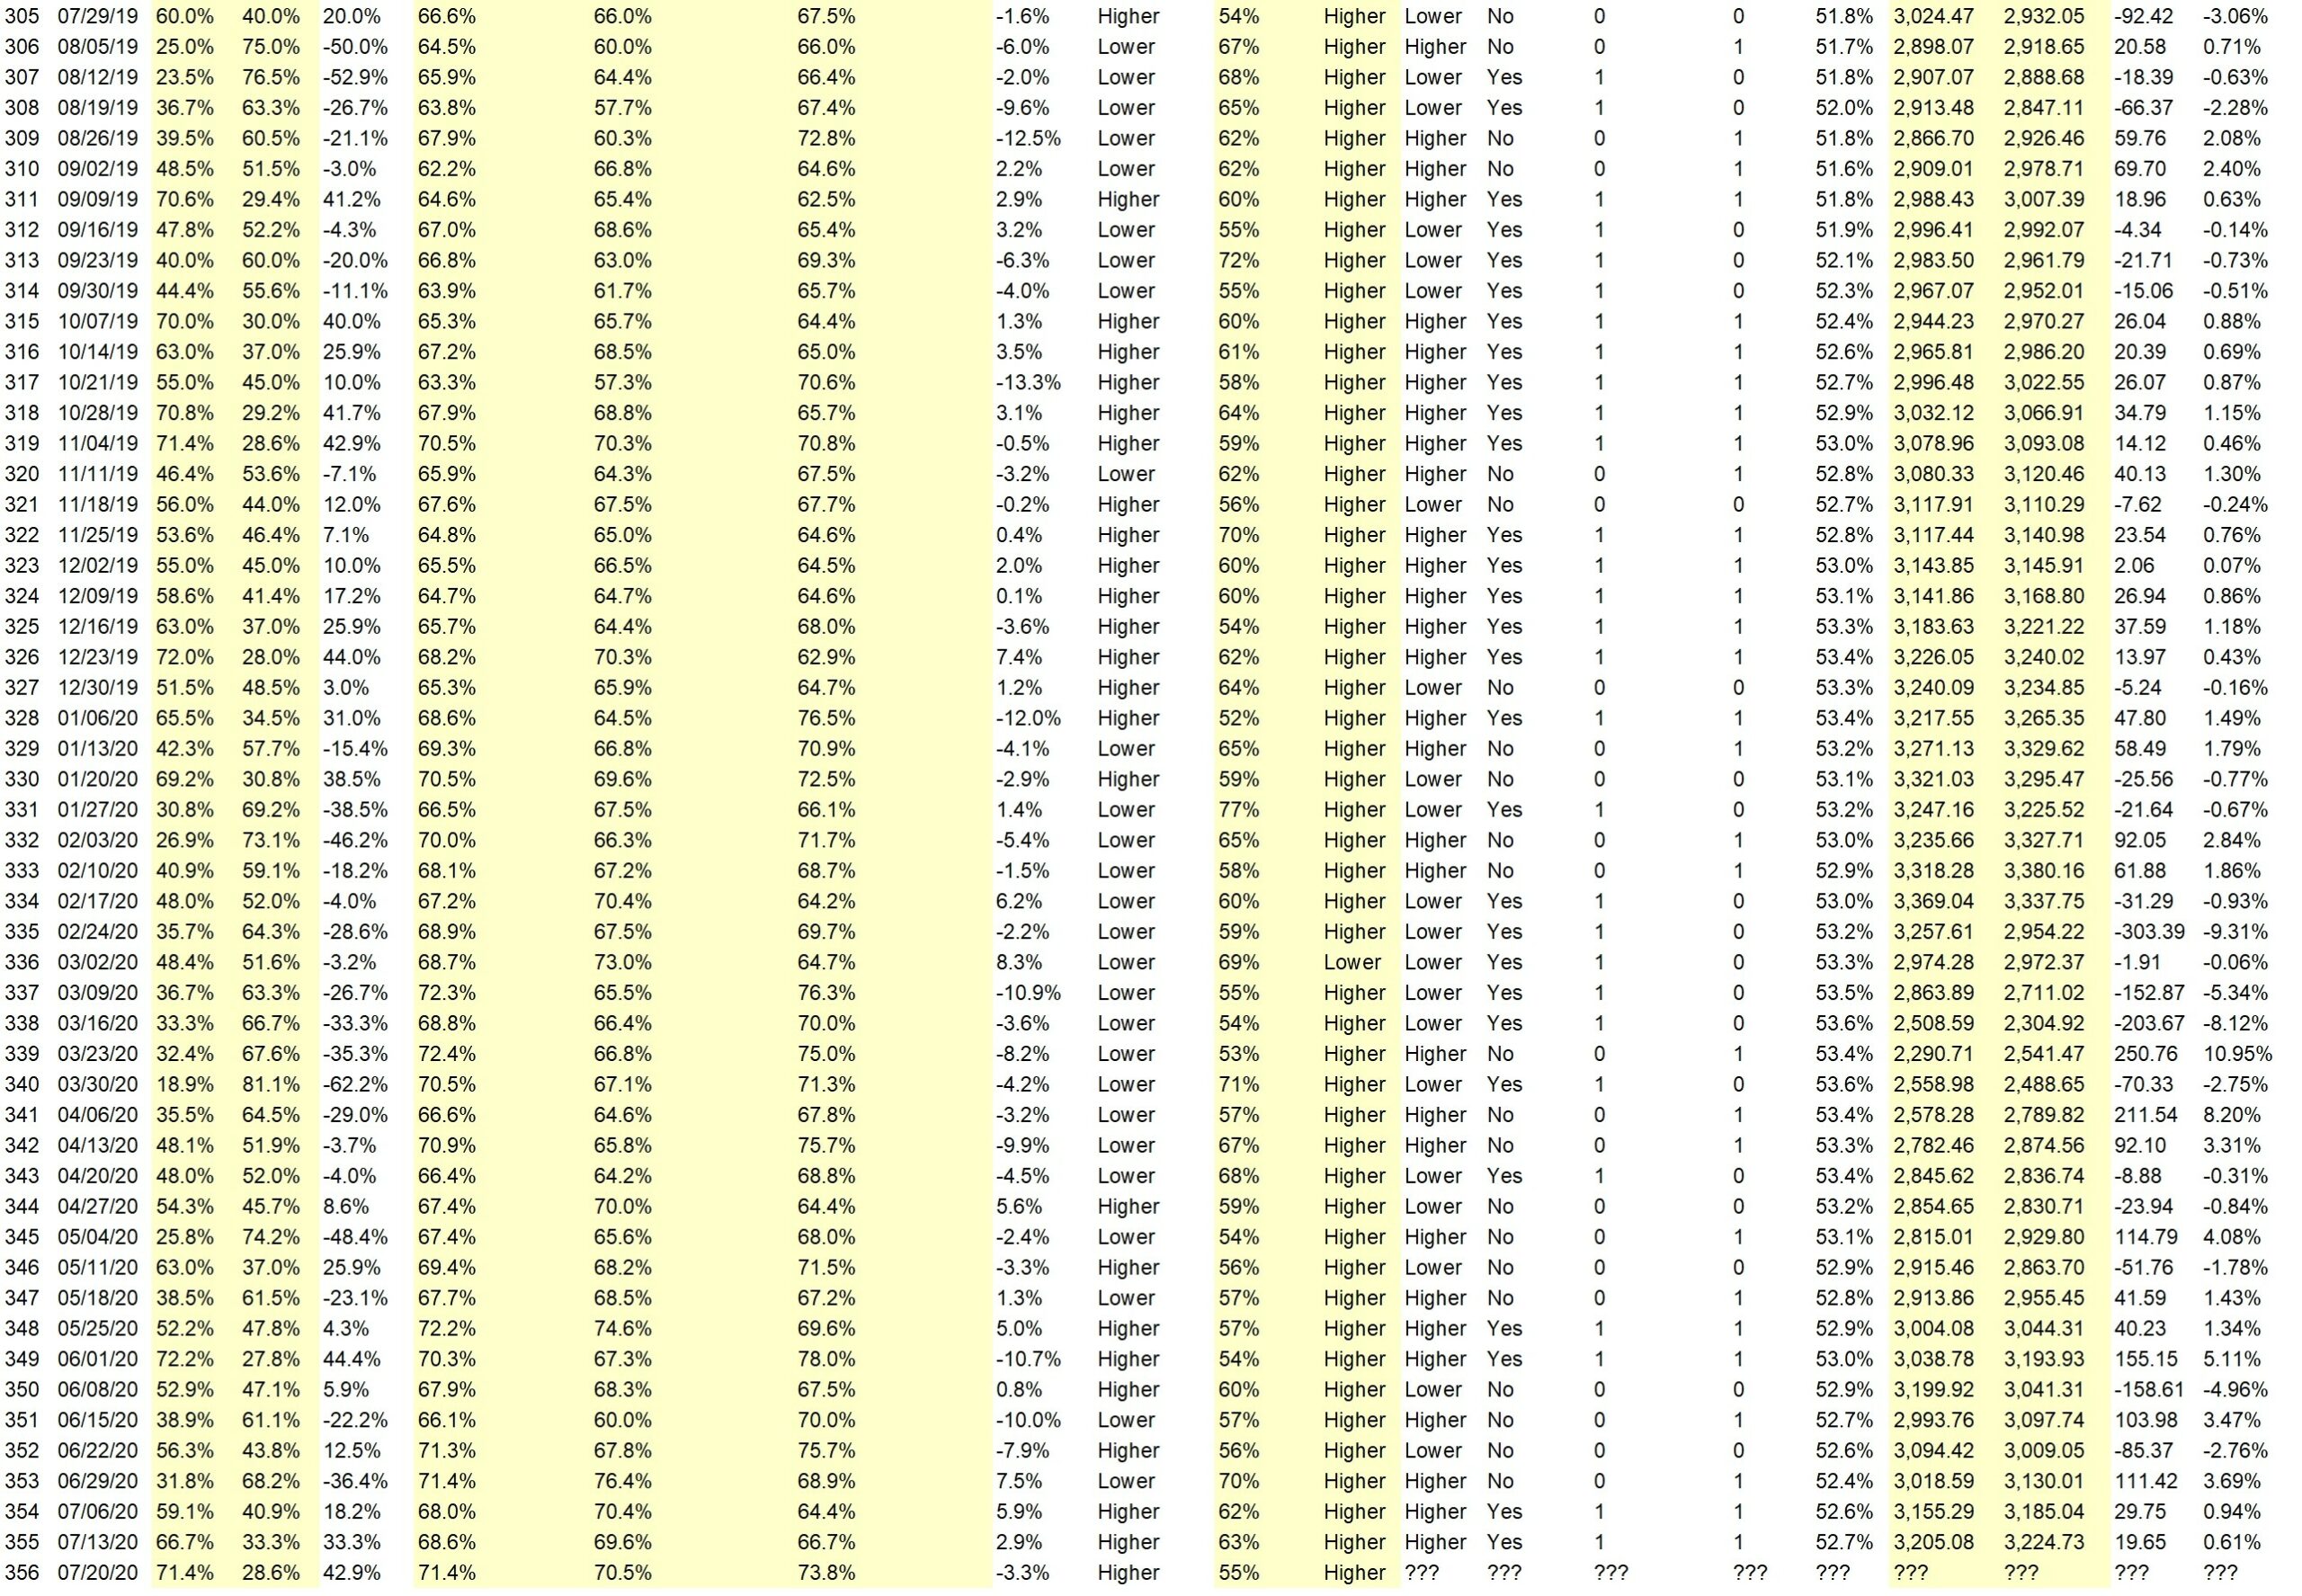
Details: Last week’s majority sentiment from the survey was 66.7% predicting Higher, and the Crowd Forecast Indicator prediction was 63% chance Higher; the S&P500 closed 0.61% Higher for the week. This week’s majority sentiment from the survey is 71.4% predicting Higher and with a greater average confidence from those who are predicting Lower. Similar conditions have occurred 73 times in the previous 355 weeks, with the majority sentiment (Higher) being correct 55% of the time but with an average S&P500 move of 0.03% Lower for the week. Based on that history, the TimingResearch Crowd Forecast Indicator is forecasting a 55% Chance that the S&P500 is going to move Higher this coming week.
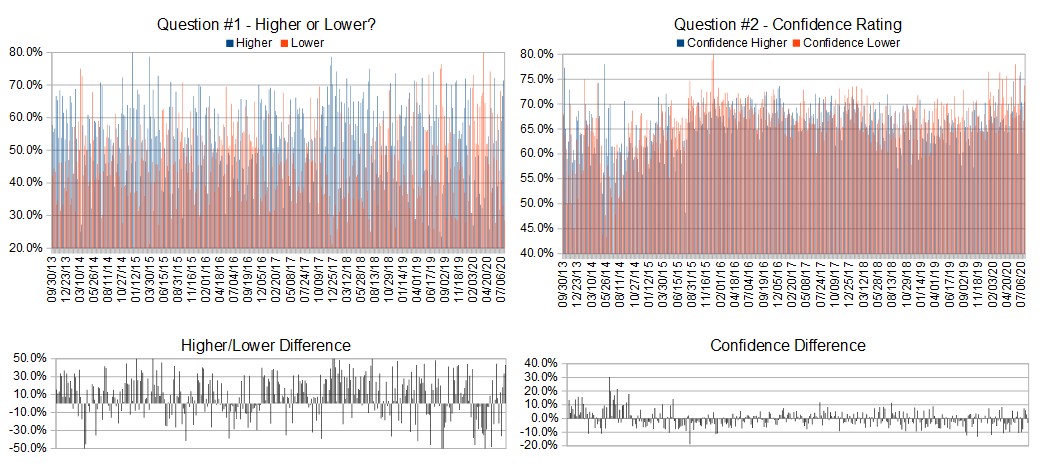
Raw Data Page (raw data files include full history spreadsheet and the above charts):
TimingResearch.com/data.
[AD] eBook: TSLA Options Trader (Complete Strategy Guide)
Full Weekly Results (full version of this chart available in the raw data spreadsheet for this week, “Date” field below lists the Monday of the week being predicted).
Overall Sentiment All-Time “Correct” Percentage: 52.7%
Overall Sentiment 52-Week “Correct” Percentage: 56.9%
Overall Sentiment 12-Week “Correct” Percentage: 36.4%
Only the previous 52 weeks of data are shown below, please download the raw data to see the full range of past data.
Weekly Reports Page: TimingResearch.com/reports
Raw Data Page: TimingResearch.com/rawdata
Current Survey Page: TimingResearch.com/currentsurvey
Any feedback: TimingResearch.com/contact
Email Alerts
Make sure you don’t miss all the future reports, show reminders, and bonus offers from TimingResearch, enter your best email here:
By signing up you agree to receive newsletter and marketing emails. You can unsubscribe at any time.
Privacy Policies
NOTE: The following open-ended answers are solely the opinions of the anonymous respondents to this survey. Responses are mostly unedited, but some have been reformatted slightly for to make them easier to read. Some irrelevant responses (e.g. “none”), or anything obviously fake, or copy and pasted responses have been omitted. All-caps responses have been changed to all lowercase. All responses for each week, unedited, are available in the raw data spreadsheets at TimingResearch.com/data.
Question #3. For your answer to Question #1, please share what specific reason(s) you think the S&P500 will be heading the direction you chose.
“Higher” Respondent Answers:
• trend continues
• momentum
• The market moved up last week, with bank earnings coming in well enough. Have to go with continuing up movement for the near term.
• Earnings reports and employment reports
• trend
“Lower” Respondent Answers:
• After 3 weeks of advances, a relatively small decline is called for.
• Virus cases at new highs and the Nasdag went down last week
[AD] eBook: TSLA Options Trader (Complete Strategy Guide)
Question #4. What methods or techniques do you use to overcome the emotional aspects of trading?
• fixed rules for entry and exit
• none necessary
• I use charts a lot. Charts are just historical data, no emotion there.
Question #5. Additional Comments/Questions/Suggestions?
• none
[AD] eBook: TSLA Options Trader (Complete Strategy Guide)
Email Alerts
Make sure you don’t miss all the future reports, show reminders, and bonus offers from TimingResearch, enter your best email here:
By signing up you agree to receive newsletter and marketing emails. You can unsubscribe at any time.
Privacy Policies
Crowd Forecast News Report #355
[AD] eBook: TSLA Options Trader (Complete Strategy Guide)The new TimingResearch report for the week has been posted, you can download the full PDF report with the link below or you can read the full report in this post below.
Click here to download report in PDF format: TRReport071320.pdf
Question #1. Which direction do you think the S&P500 index will move from this coming Monday’s open to Friday’s close (July 13th-17th)?
Higher: 66.7%
Lower: 33.3%
Higher/Lower Difference: 33.3%
Question #2. Rate your confidence in your answer to Question #2 by estimating the probability you have correctly predicted next week’s market move.
Average of All Responses: 68.6%
Average For “Higher” Responses: 69.6%
Average For “Lower” Responses: 66.7%
Higher/Lower Difference: 2.9%
Responses Submitted This Week: 19
52-Week Average Number of Responses: 28.6
TimingResearch Crowd Forecast Prediction: 63% Chance Higher
This prediction is an attempt by the editor of this newsletter to use the full 6+ year history of data collected from this project to forecast a probability estimate for whether this week’s sentiment is going to be correct and ultimately what the markets will do this coming week.
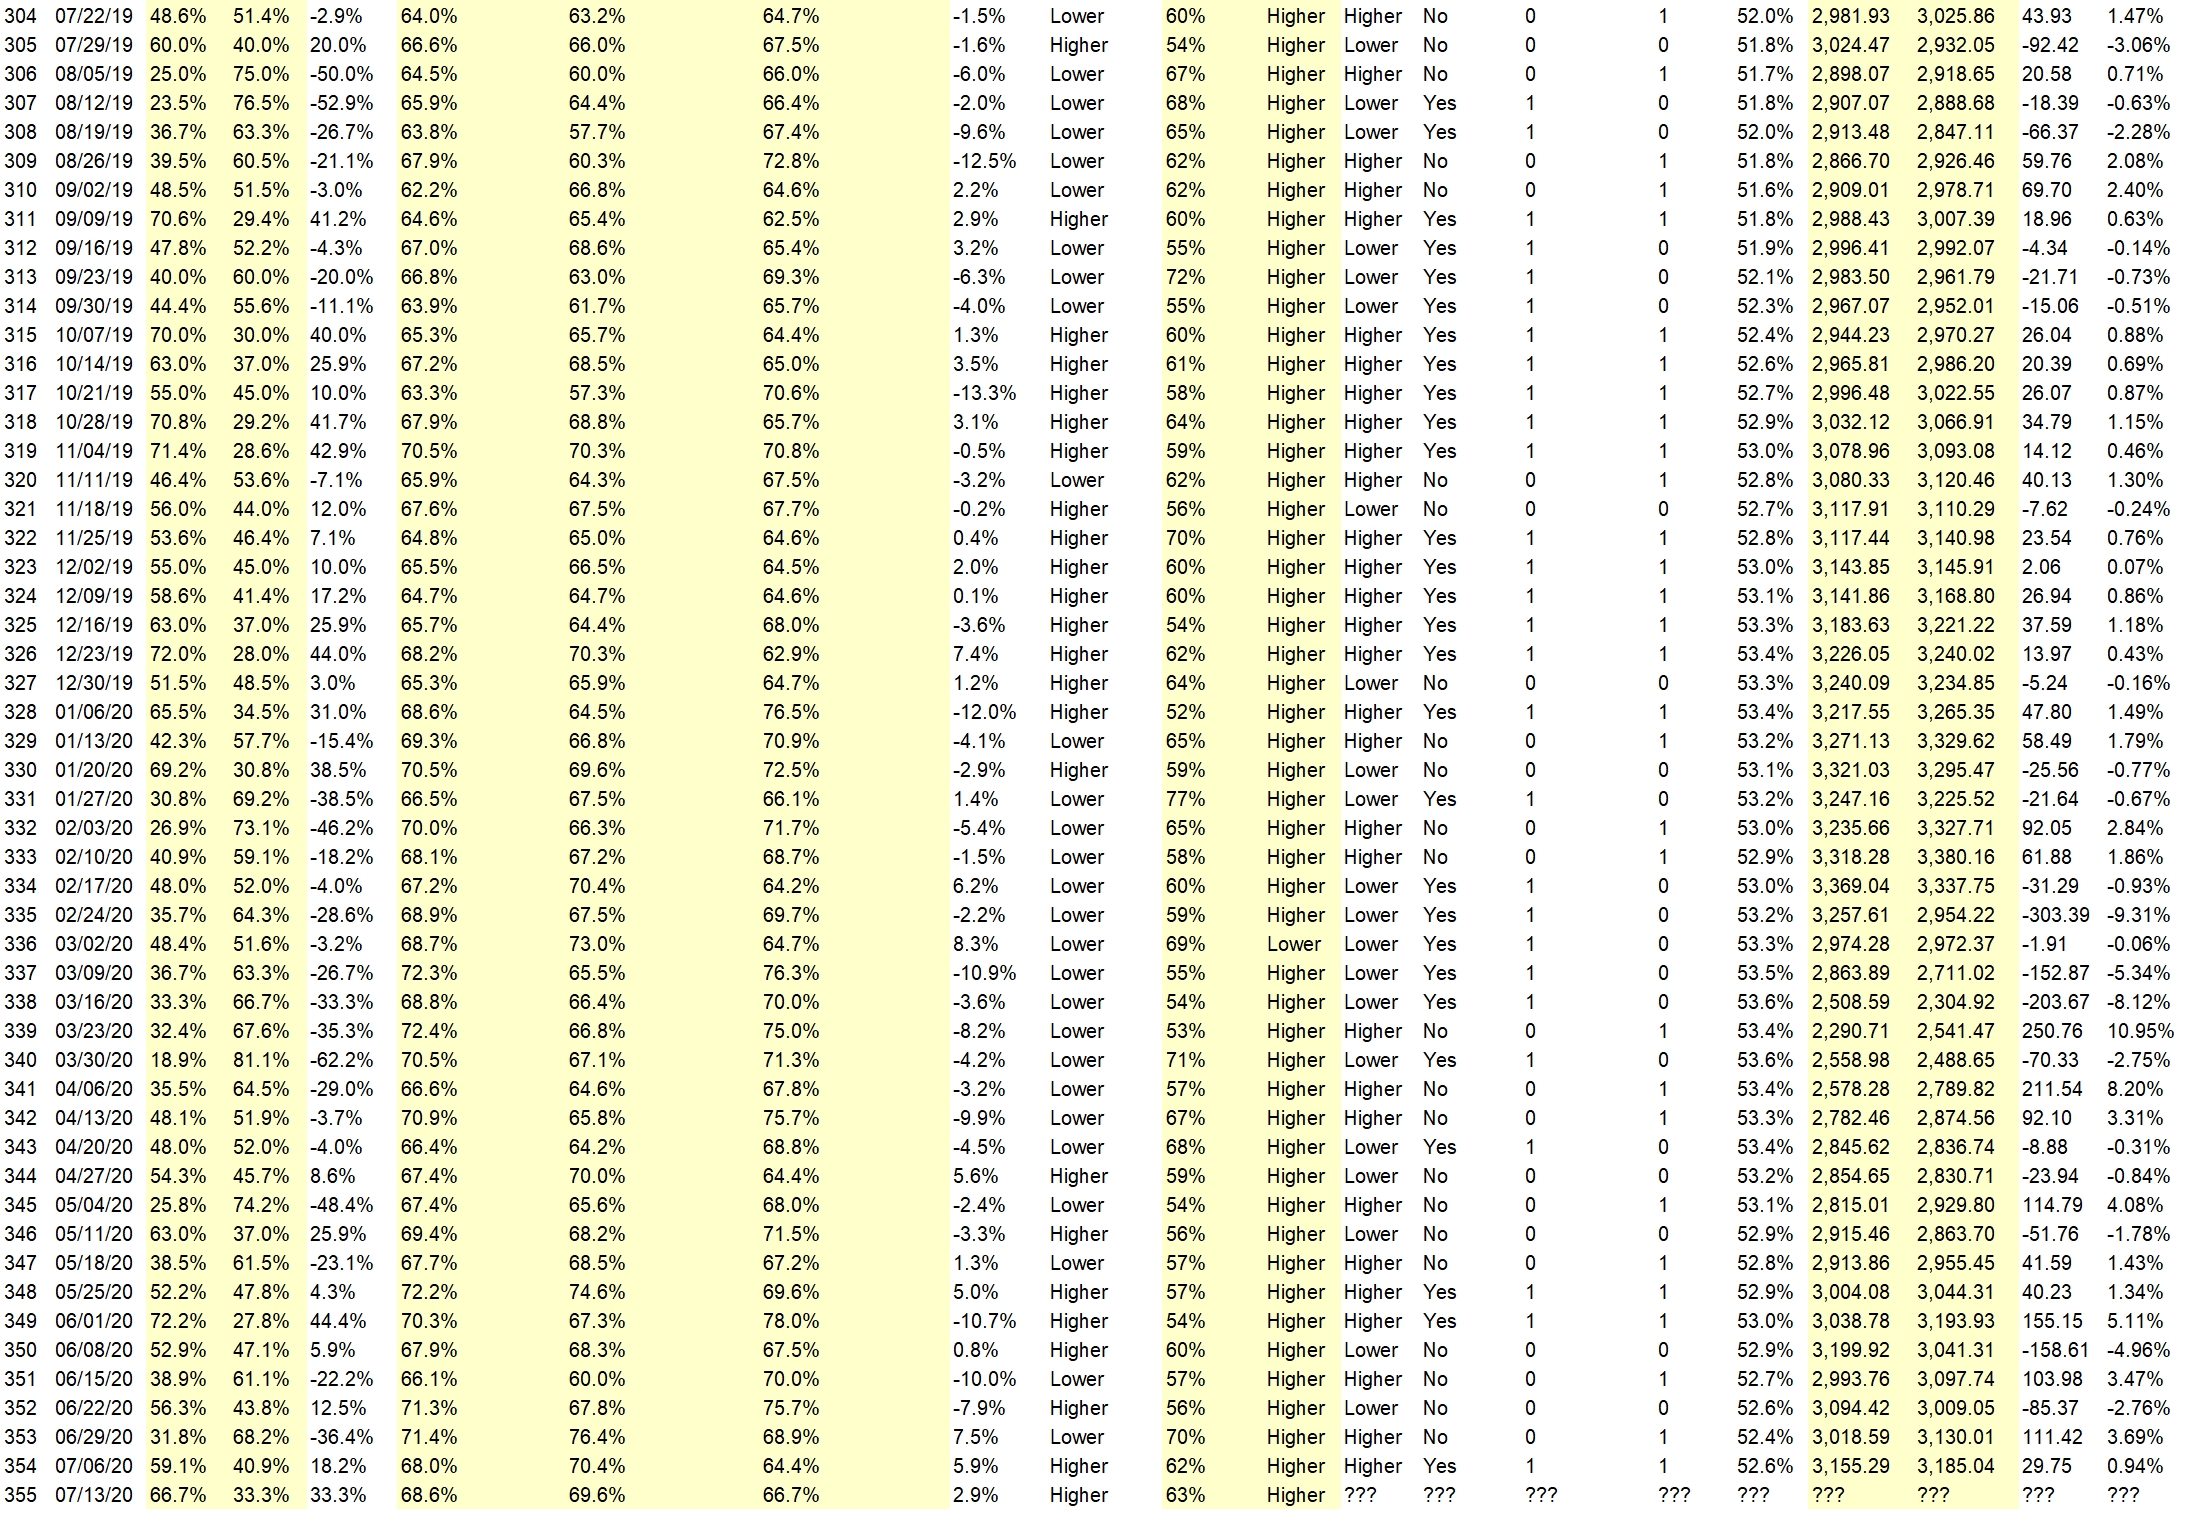
Details: Last week’s majority sentiment from the survey was 59.1% predicting Higher, and the Crowd Forecast Indicator prediction was 62% chance Higher; the S&P500 closed 0.94% Higher for the week. This week’s majority sentiment from the survey is 66.7% predicting Higher and with a greater average confidence from those who are predicting Higher. Similar conditions have occurred 88 times in the previous 354 weeks, with the majority sentiment (Higher) being correct 63% of the time and with an average S&P500 move of 0.21% Higher for the week. Based on that history, the TimingResearch Crowd Forecast Indicator is forecasting a 63% Chance that the S&P500 is going to move Higher this coming week.
Raw Data Page (raw data files include full history spreadsheet and the above charts):
TimingResearch.com/data.
[AD] eBook: TSLA Options Trader (Complete Strategy Guide)
Full Weekly Results (full version of this chart available in the raw data spreadsheet for this week, “Date” field below lists the Monday of the week being predicted).
Overall Sentiment All-Time “Correct” Percentage: 52.6%
Overall Sentiment 52-Week “Correct” Percentage: 54.9%
Overall Sentiment 12-Week “Correct” Percentage: 27.3%
Only the previous 52 weeks of data are shown below, please download the raw data to see the full range of past data.
Weekly Reports Page: TimingResearch.com/reports
Raw Data Page: TimingResearch.com/rawdata
Current Survey Page: TimingResearch.com/currentsurvey
Any feedback: TimingResearch.com/contact
Email Alerts
Make sure you don’t miss all the future reports, show reminders, and bonus offers from TimingResearch, enter your best email here:
By signing up you agree to receive newsletter and marketing emails. You can unsubscribe at any time.
Privacy Policies
NOTE: The following open-ended answers are solely the opinions of the anonymous respondents to this survey. Responses are mostly unedited, but some have been reformatted slightly for to make them easier to read. Some irrelevant responses (e.g. “none”), or anything obviously fake, or copy and pasted responses have been omitted. All-caps responses have been changed to all lowercase. All responses for each week, unedited, are available in the raw data spreadsheets at TimingResearch.com/data.
Question #3. For your answer to Question #1, please share what specific reason(s) you think the S&P500 will be heading the direction you chose.
“Higher” Respondent Answers:
• Trend
• Banks need to get their money back after march drop
• Trump poll position continues to drop with no negative market reaction. Looks like markets are factoring in chance of Biden win with little impact. also massive amounts of money on sidelines will eventually have to be deployed. Those hoping for rising rates will be crushed and will throw in the towel which will be the point to reassess.
• Continued QE by the Fed, liquidity measures of the banks.
• Even with all the negative news regarding Covid on Friday, the early dip was bought, and looked strong into the close. The high momentum looks like a positive sign.
• Too many bears out there
“Lower” Respondent Answers:
• Too much money chasing stocks. overvalued. PE to high.
• More COvid-19 cases than expexted over the wholw world.
[AD] eBook: TSLA Options Trader (Complete Strategy Guide)
Question #4. What trading-related questions or topics would you like our experts to discuss on future episodes of the weekly Crowd Forecast News show? (The TimingResearch shows are off this coming week for Wealth365, but back on July 20th.)
• Talk about trading tactics that will work in an up, sideways and down markets.
• Future growth. Secor rotation
• What is the outlook for gold and have any “experts” increased their allocation?
Question #5. Additional Comments/Questions/Suggestions?
• none
[AD] eBook: TSLA Options Trader (Complete Strategy Guide)
Email Alerts
Make sure you don’t miss all the future reports, show reminders, and bonus offers from TimingResearch, enter your best email here:
By signing up you agree to receive newsletter and marketing emails. You can unsubscribe at any time.
Privacy Policies
Crowd Forecast News Report #354
[AD] eBook: TSLA Options Trader (Complete Strategy Guide)The new TimingResearch report for the week has been posted, you can download the full PDF report with the link below or you can read the full report in this post below.
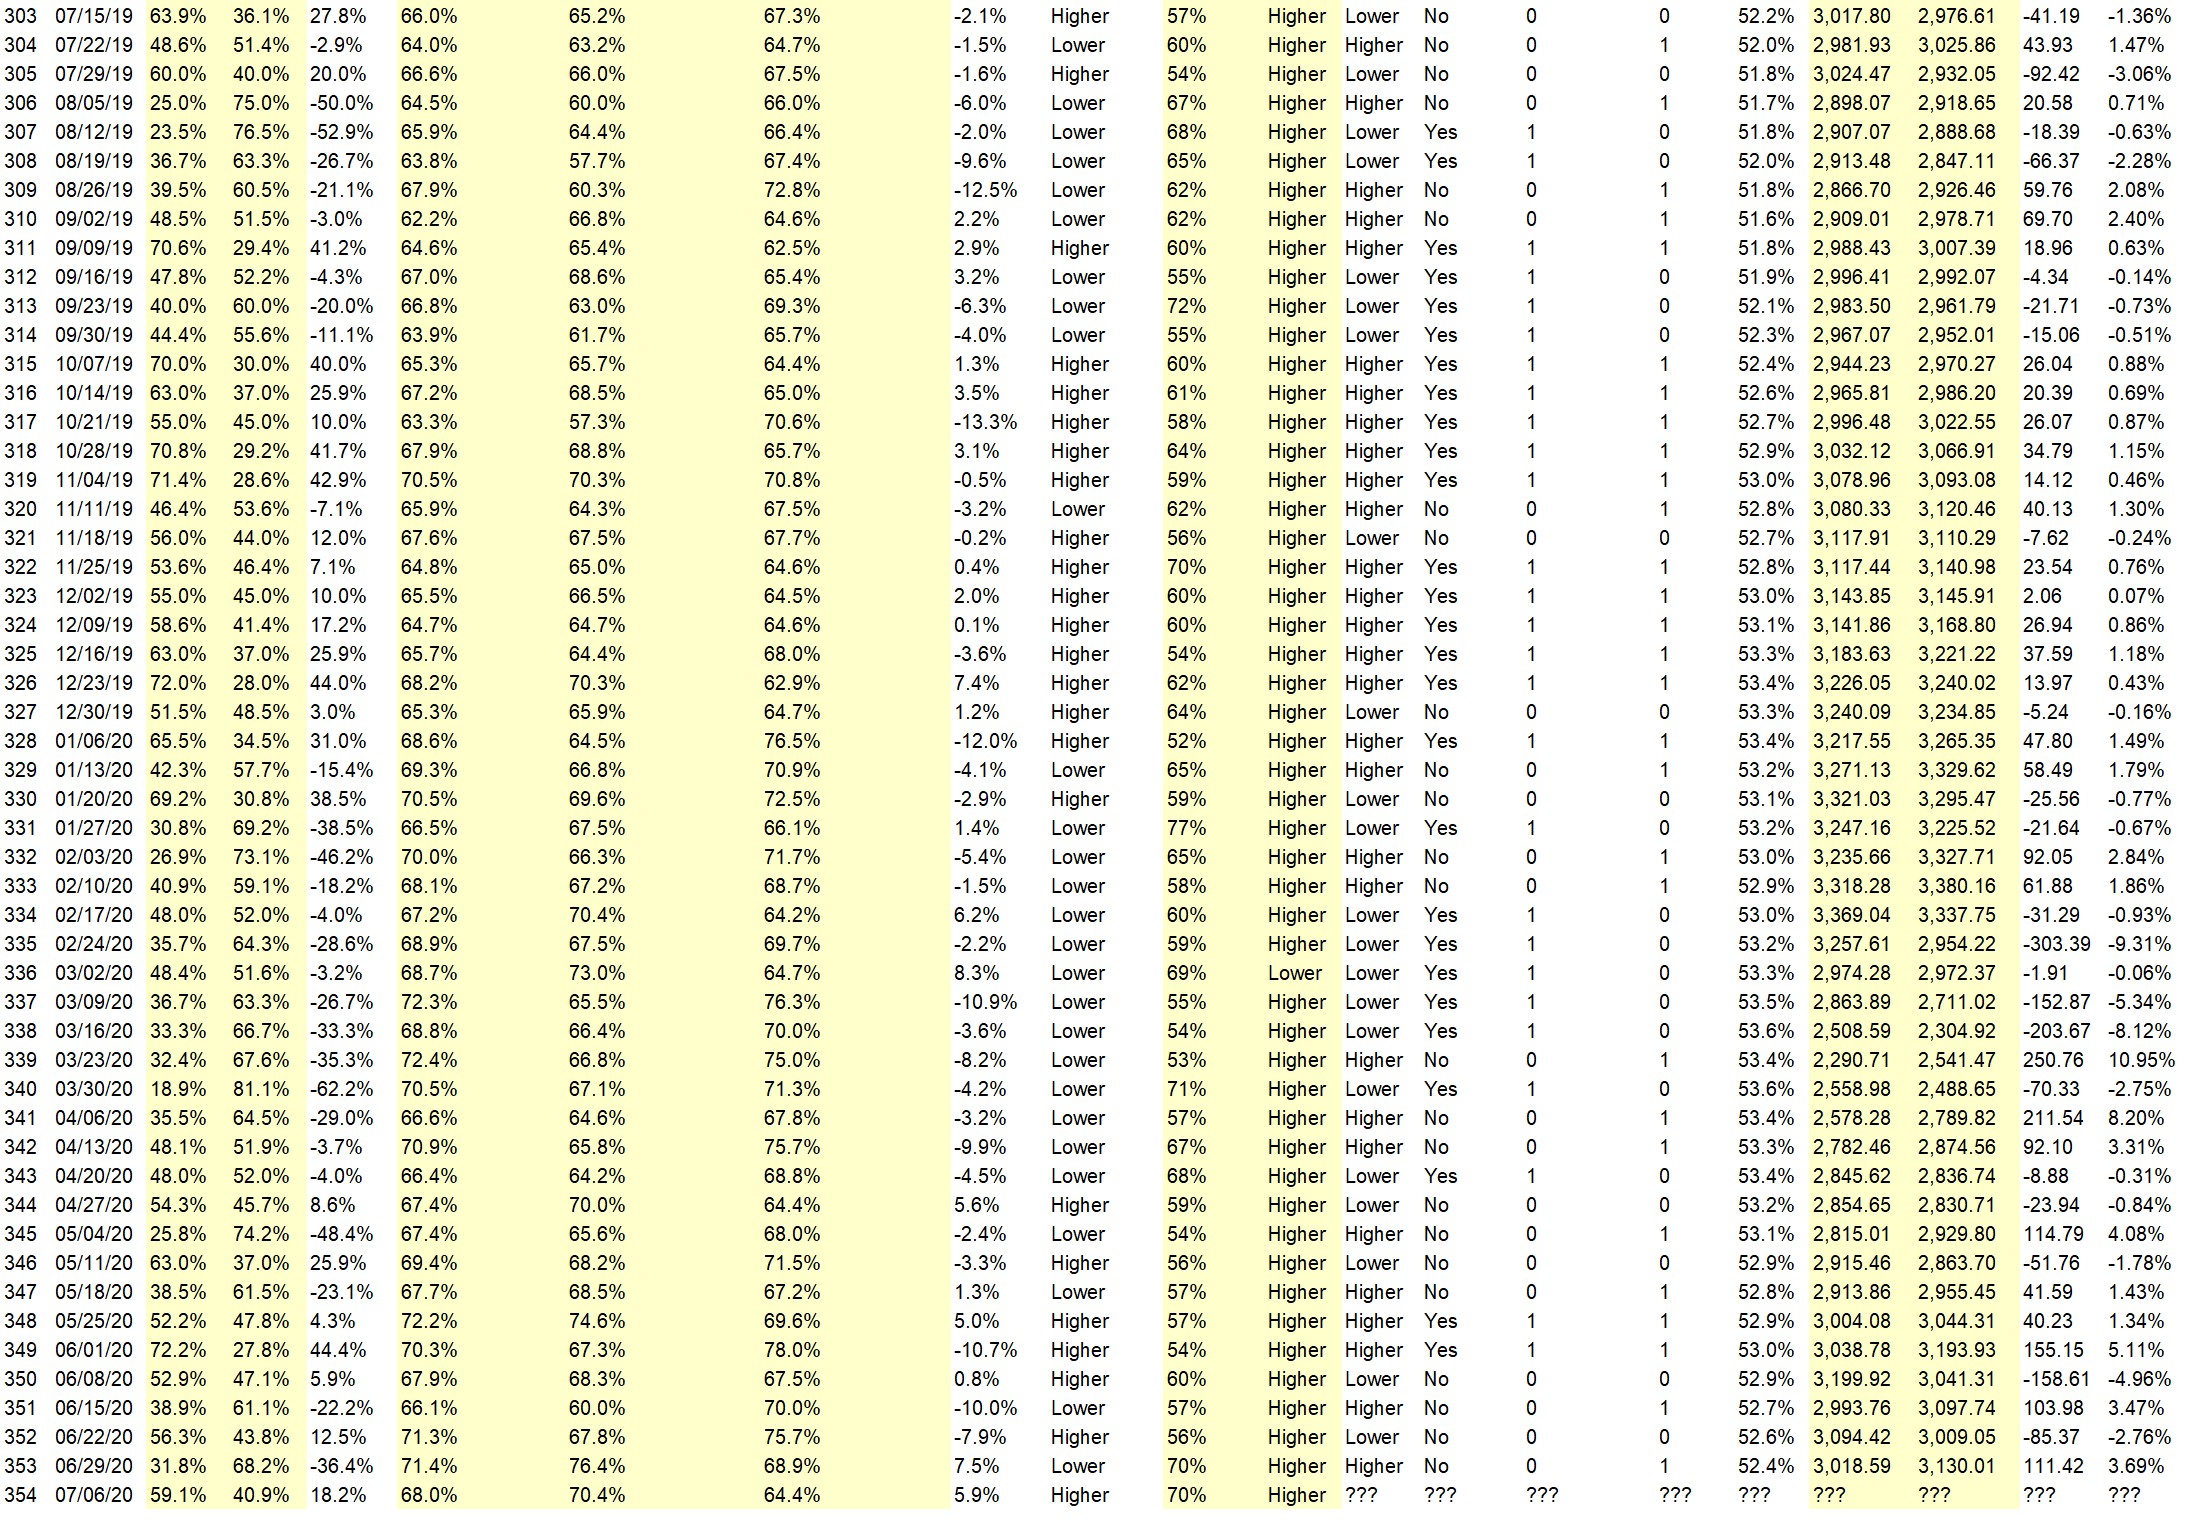
Click here to download report in PDF format: TRReport070620.pdf
Question #1. Which direction do you think the S&P500 index will move from this coming Monday’s open to Friday’s close (July 6th-10th)?
Higher: 59.1%
Lower: 40.9%
Higher/Lower Difference: 18.2%
Question #2. Rate your confidence in your answer to Question #2 by estimating the probability you have correctly predicted next week’s market move.
Average of All Responses: 68.0%
Average For “Higher” Responses: 70.4%
Average For “Lower” Responses: 64.4%
Higher/Lower Difference: 5.9%
Responses Submitted This Week: 22
52-Week Average Number of Responses: 28.9
TimingResearch Crowd Forecast Prediction: 62% Chance Higher
This prediction is an attempt by the editor of this newsletter to use the full 6+ year history of data collected from this project to forecast a probability estimate for whether this week’s sentiment is going to be correct and ultimately what the markets will do this coming week.
Details: Last week’s majority sentiment from the survey was 68.2% predicting Lower, and the Crowd Forecast Indicator prediction was 70% chance Higher; the S&P500 closed 3.69% Higher for the week. This week’s majority sentiment from the survey is 59.1% predicting Higher but with a greater average confidence from those who are predicting Higher. Similar conditions have occurred 87 times in the previous 353 weeks, with the majority sentiment (Higher) being correct 62% of the time and with an average S&P500 move of 0.20% Higher for the week. Based on that history, the TimingResearch Crowd Forecast Indicator is forecasting a 62% Chance that the S&P500 is going to move Higher this coming week.
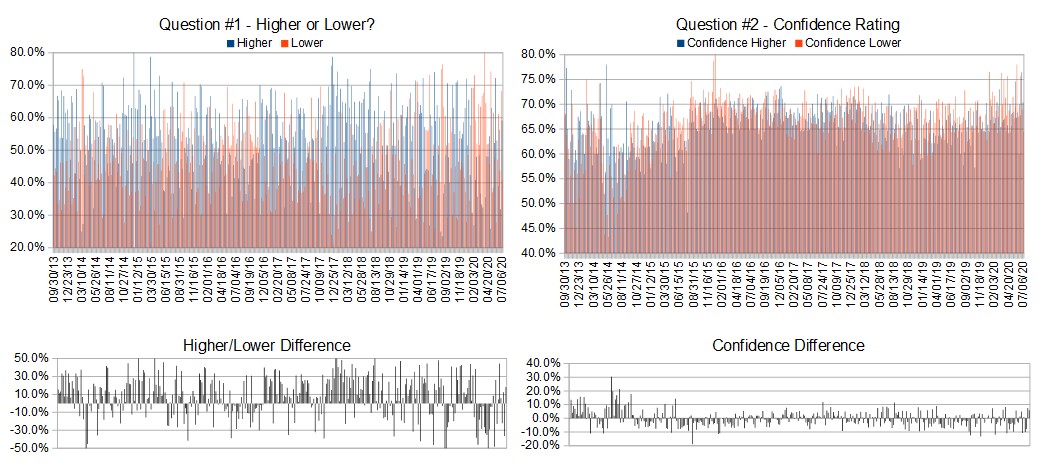
Raw Data Page (raw data files include full history spreadsheet and the above charts):
TimingResearch.com/data.
[AD] eBook: TSLA Options Trader (Complete Strategy Guide)
Full Weekly Results (full version of this chart available in the raw data spreadsheet for this week, “Date” field below lists the Monday of the week being predicted).
Overall Sentiment All-Time “Correct” Percentage: 52.4%
Overall Sentiment 52-Week “Correct” Percentage: 52.9%
Overall Sentiment 12-Week “Correct” Percentage: 27.3%
Only the previous 52 weeks of data are shown below, please download the raw data to see the full range of past data.
Weekly Reports Page: TimingResearch.com/reports
Raw Data Page: TimingResearch.com/rawdata
Current Survey Page: TimingResearch.com/currentsurvey
Any feedback: TimingResearch.com/contact
Email Alerts
Make sure you don’t miss all the future reports, show reminders, and bonus offers from TimingResearch, enter your best email here:
By signing up you agree to receive newsletter and marketing emails. You can unsubscribe at any time.
Privacy Policies
NOTE: The following open-ended answers are solely the opinions of the anonymous respondents to this survey. Responses are mostly unedited, but some have been reformatted slightly for to make them easier to read. Some irrelevant responses (e.g. “none”), or anything obviously fake, or copy and pasted responses have been omitted. All-caps responses have been changed to all lowercase. All responses for each week, unedited, are available in the raw data spreadsheets at TimingResearch.com/data.
Question #3. For your answer to Question #1, please share what specific reason(s) you think the S&P500 will be heading the direction you chose.
“Higher” Respondent Answers:
• Because of the new IPO’s going public.
• Good unemployment report. Low mortality rate though recent Covid-19 cases surge.
• Historical Early Summer Rally,
• The markets are doing well reaching highs again even through the fear of the public
• The probability seems to favor continuity, with Fed-induced liquidity still an important factor. The market has mostly been hitting upper Bollinger Bands; which sits at about 3220; so that could be the next resistance.
• reverse head and shoulders on DJIA may lead the S&P500.
• All tech stocks are all time high, It may pull back 1-2% and moves to new high.
• good stats All around.
• Elliott waves
“Lower” Respondent Answers:
• Corona virus
• Profit taking as we go into a lower cycle.
• technical
[AD] eBook: TSLA Options Trader (Complete Strategy Guide)
Question #4. What styles of trading or methodologies have you had the most success with?
• Binaries and Forex.
• Trend trading
• Reading the charts and technical analysis.
• Seasonal Technical analysis Jake Bernstein Analysys
• Swing trading
• Morning rallies via NASDAQ futures. Short term only
• Moving averages with pivot points
• swing trading
• trading genuine Breakouts of long term price range (R&D: 7 yrs)
Question #5. Additional Comments/Questions/Suggestions?
• none at this time.
• Since 1928 only two bear market rallies have retested lows. 2000 & 1957. Unless the economy is totally shut down again this will not happen. Plenty of funny money poured in by the FED. Don’t fight the FED.
• This is a very difficult time in the market, but the NQs almost always rally up until 10 am est.
Join us for this week’s shows:
Crowd Forecast News Episode #269
This week’s show will feature a discussion with the trading experts listed below about the most recent TimingResearch Crowd Forecast Newsletter report, where they think the S&P500 is headed, what they are watching for in the markets currently, and their best trading idea.
Date and Time:
– Monday, July 6th, 1PM ET (10AM PT)
Moderator and Guests:
– Erik Gebhard of Altavest.com
– Amelia Bourdeau of MarketCompassLLC.com
– The Option Professor of OptionProfessor.com (moderator)
Analyze Your Trade Episode #131
When you register, you will be prompted to list the top 5 stocks that you are interested in trading. We will list the top 5 from all registrants and our experts will be prepared to offer their opinions on these trades.
Date and Time:
– Tuesday, July 7th, 4PM ET (1PM PT)
Moderator and Guests:
– Jake Bernstein of Trade-Futures.com
– The Option Professor of OptionProfessor.com (moderator)
[AD] eBook: TSLA Options Trader (Complete Strategy Guide)
Email Alerts
Make sure you don’t miss all the future reports, show reminders, and bonus offers from TimingResearch, enter your best email here:
By signing up you agree to receive newsletter and marketing emails. You can unsubscribe at any time.
Privacy Policies
Crowd Forecast News Report #353
[AD] eBook: TSLA Options Trader (Complete Strategy Guide)The new TimingResearch report for the week has been posted, you can download the full PDF report with the link below or you can read the full report in this post below.
Click here to download report in PDF format: TRReport062920.pdf
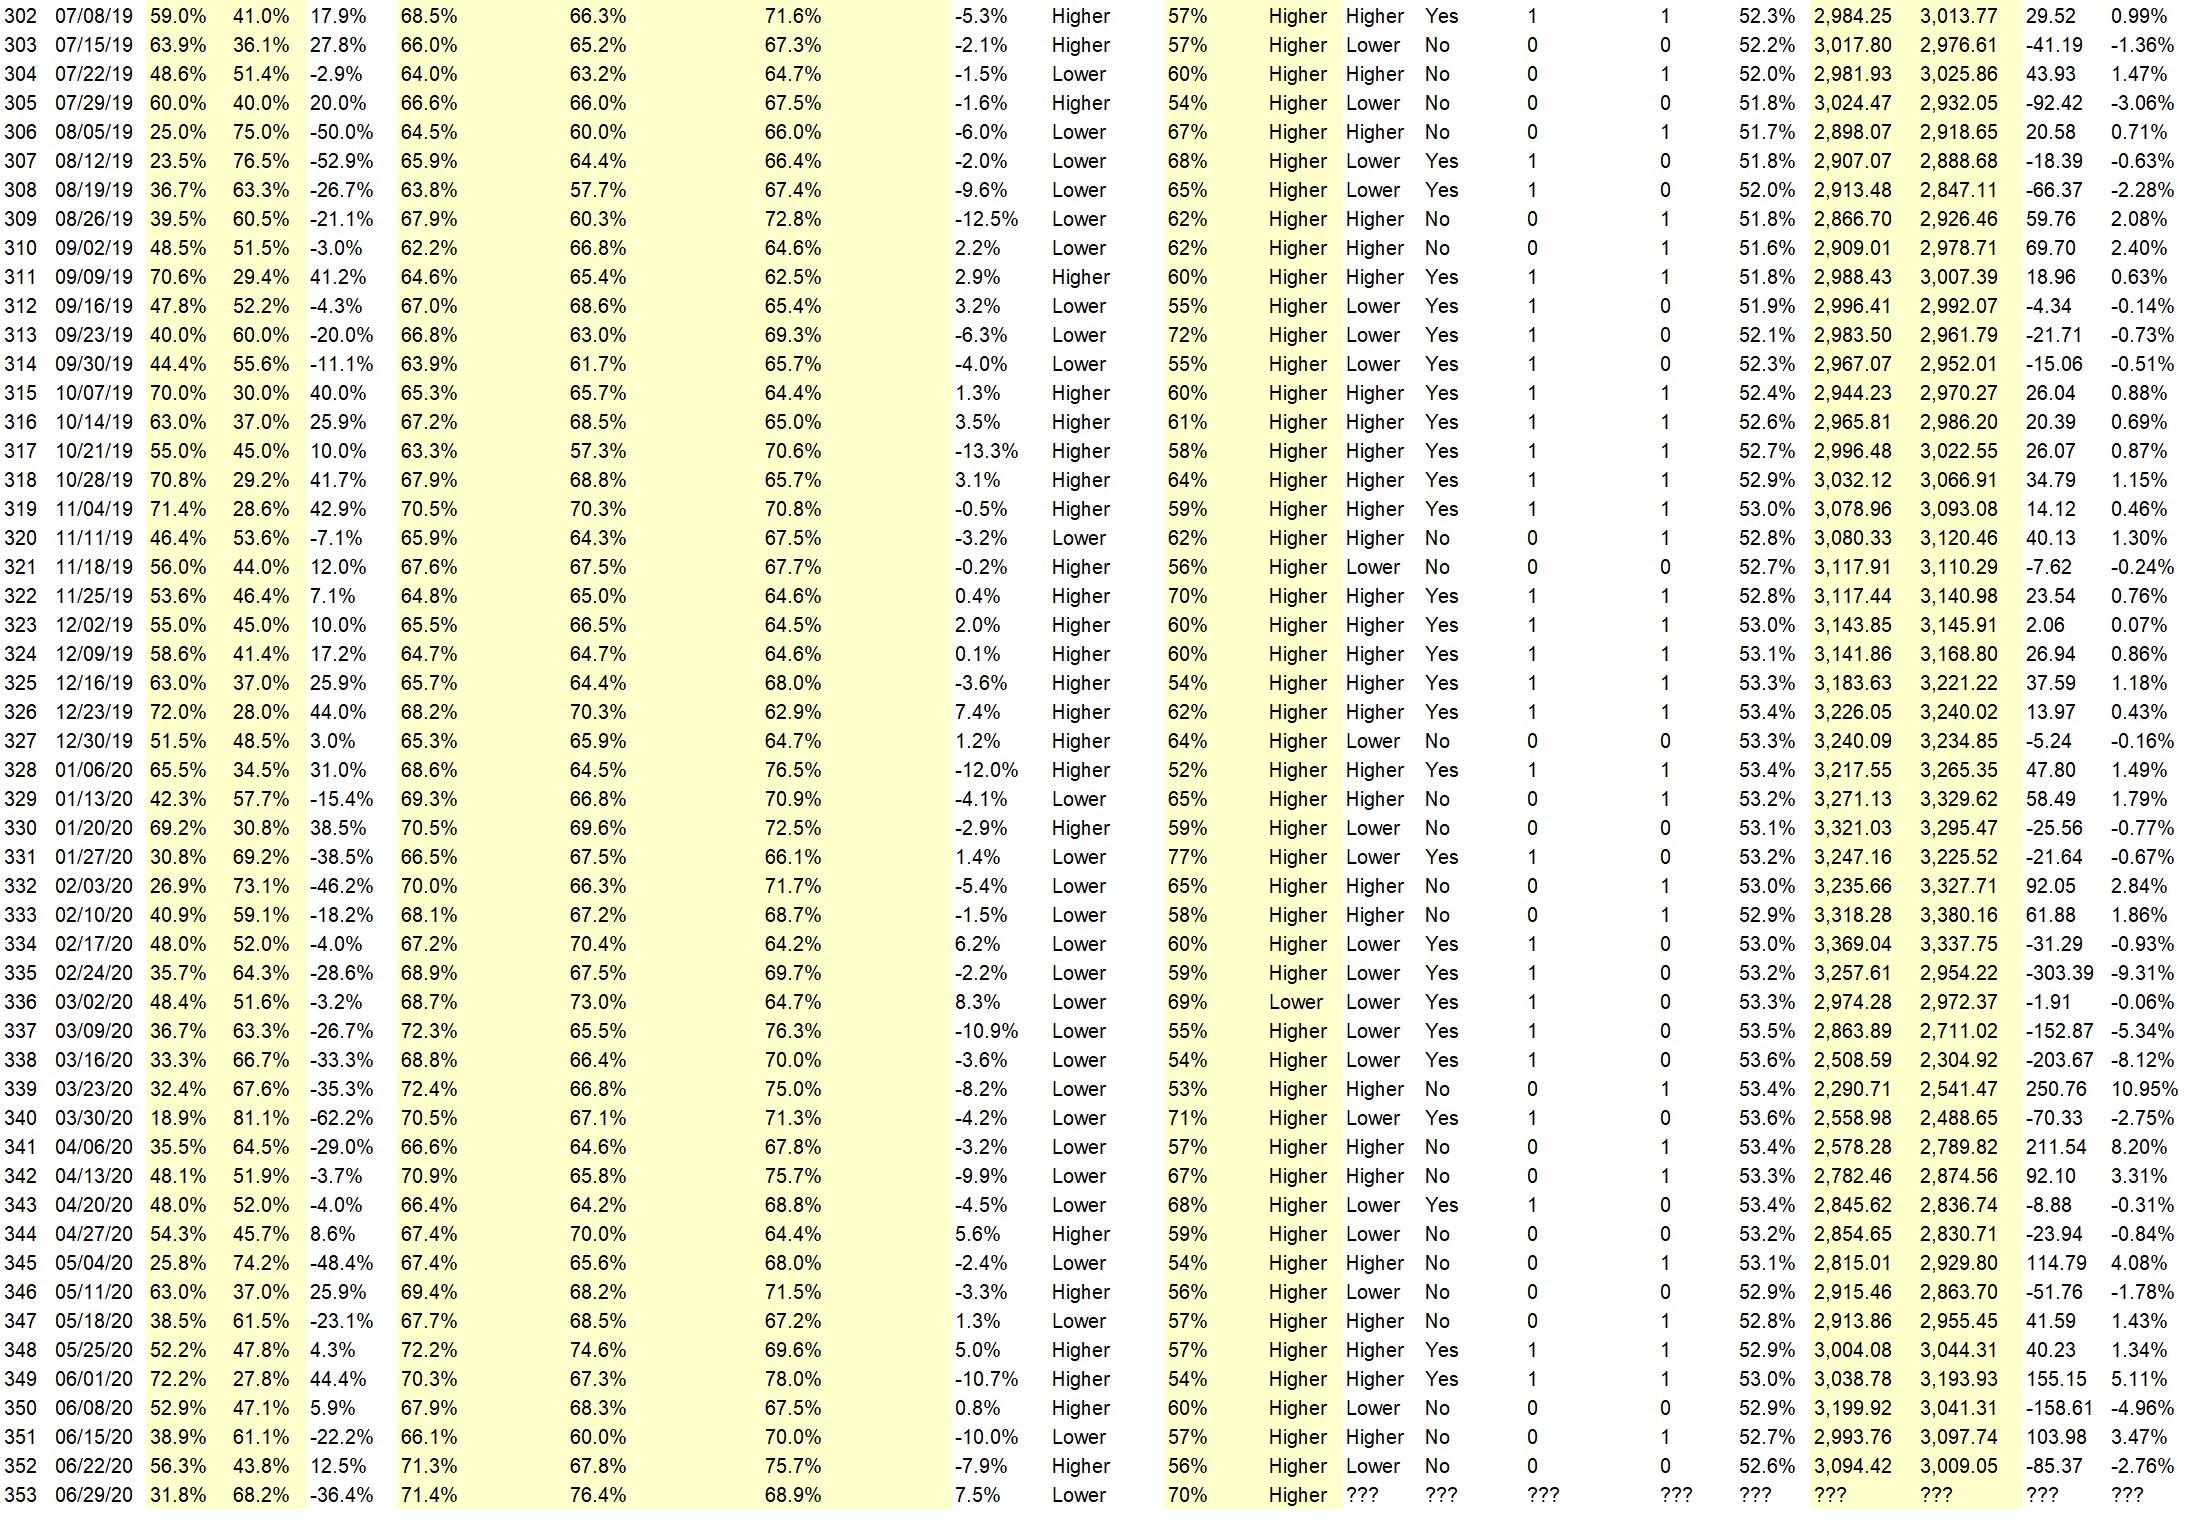
Question #1. Which direction do you think the S&P500 index will move from this coming Monday’s open to Thursday’s close (June 29th – July 2nd)?
Higher: 31.8%
Lower: 68.2%
Higher/Lower Difference: -36.4%
Question #2. Rate your confidence in your answer to Question #2 by estimating the probability you have correctly predicted next week’s market move.
Average of All Responses: 71.4%
Average For “Higher” Responses: 76.4%
Average For “Lower” Responses: 68.9%
Higher/Lower Difference: 7.5%
Responses Submitted This Week: 22
52-Week Average Number of Responses: 29.3
TimingResearch Crowd Forecast Prediction: 70% Chance Higher
This prediction is an attempt by the editor of this newsletter to use the full 6+ year history of data collected from this project to forecast a probability estimate for whether this week’s sentiment is going to be correct and ultimately what the markets will do this coming week.
Details: Last week’s majority sentiment from the survey was 56.3% predicting Higher, and the Crowd Forecast Indicator prediction was 56% chance Higher; the S&P500 closed 2.76% Lower for the week. This week’s majority sentiment from the survey is 68.2% predicting Lower but with a greater average confidence from those who are predicting Higher. Similar conditions have occurred 20 times in the previous 352 weeks, with the majority sentiment (Higher) being correct 70% of the time and with an average S&P500 move of 0.23% Higher for the week. Based on that history, the TimingResearch Crowd Forecast Indicator is forecasting a 70% Chance that the S&P500 is going to move Higher this coming week.
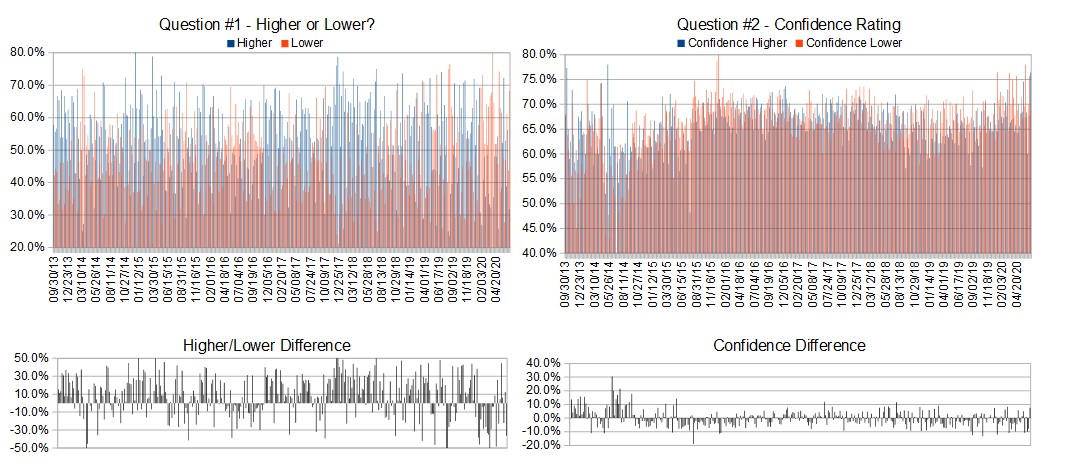
Raw Data Page (raw data files include full history spreadsheet and the above charts):
TimingResearch.com/data.
[AD] eBook: TSLA Options Trader (Complete Strategy Guide)
Full Weekly Results (full version of this chart available in the raw data spreadsheet for this week, “Date” field below lists the Monday of the week being predicted).
Overall Sentiment All-Time “Correct” Percentage: 52.6%
Overall Sentiment 52-Week “Correct” Percentage: 54.9%
Overall Sentiment 12-Week “Correct” Percentage: 27.3%
Only the previous 52 weeks of data are shown below, please download the raw data to see the full range of past data.
Weekly Reports Page: TimingResearch.com/reports
Raw Data Page: TimingResearch.com/rawdata
Current Survey Page: TimingResearch.com/currentsurvey
Any feedback: TimingResearch.com/contact
Email Alerts
Make sure you don’t miss all the future reports, show reminders, and bonus offers from TimingResearch, enter your best email here:
By signing up you agree to receive newsletter and marketing emails. You can unsubscribe at any time.
Privacy Policies
NOTE: The following open-ended answers are solely the opinions of the anonymous respondents to this survey. Responses are mostly unedited, but some have been reformatted slightly for to make them easier to read. Some irrelevant responses (e.g. “none”), or anything obviously fake, or copy and pasted responses have been omitted. All-caps responses have been changed to all lowercase. All responses for each week, unedited, are available in the raw data spreadsheets at TimingResearch.com/data.
Question #3. For your answer to Question #1, please share what specific reason(s) you think the S&P500 will be heading the direction you chose.
“Higher” Respondent Answers:
• Fear runs the market now.
• The week before July 4th is almost always bullish. That history should outweigh concerns about COVID spikes.
• pre 4th of July week seasonal bullish strength
• vaccin sooner redy
• lower & higher, this is not a breakdown, upward move by mid of next week is closely observed
“Lower” Respondent Answers:
• Price will be back to 2640 (FB retrace 62%), what is it like spinning on a megaphone in a weekly chart.
• Virus numbers are increase, bankruptcy of Chesapeake Energy. President Trump’s ratings are down
• more unemployment
• Rising COVID cases in big states. Report on GDP will show lower numbers. Likelihood that Biden will become President spooks the market.
• The S&P had a high in Feb and a lower high in June. Since then, it hasn’t challenged the more recent high, and closed near to the lower Bollinger band. This leans bearish. Also, Covid19 is more in charge than the Fed is.
• S&P running out of momentum
• technicals
• higher VIX
[AD] eBook: TSLA Options Trader (Complete Strategy Guide)
Question #4. What advice would you give and/or what resources would you recommend to someone who is new to trading?
• Focus more on what is at risk if you are wrong than on what you might make if all goes your way.
• How long did it take you to get to a six figure salary in yr present career? Well its going to take you that long to get to six figure annual profits.
• Trading is tricky, with lots of traps. Practice with paper trading.
• end losing trades quickly and uncompromisingly
• papertrading
• Look for clean software and clean broker and try to avoid fxcm ,don’t take too much risk, and try to consider the contract size AND DONT GET GREEDY, one trade a time. don’t ever place 2 trades or more than one trade a time try to choose the right broker, this is because the broker will place his hand in your pocket and he wouldn’t get out till you close the trade)
• patience, discipline, then strategy
• Learn how to read charts. Do not listen to the MSM.
• stay out until October
Question #5. Additional Comments/Questions/Suggestions?
• none
[AD] eBook: TSLA Options Trader (Complete Strategy Guide)
Email Alerts
Make sure you don’t miss all the future reports, show reminders, and bonus offers from TimingResearch, enter your best email here:
By signing up you agree to receive newsletter and marketing emails. You can unsubscribe at any time.
Privacy Policies


