- Home
- Crowd Forecast News Reports
Crowd Forecast News Report #314
The new TimingResearch report for the week has been posted, you can download the full PDF report with the link below or you can read the full report in this post below.
Click here to download report in PDF format: TRReport092919.pdf
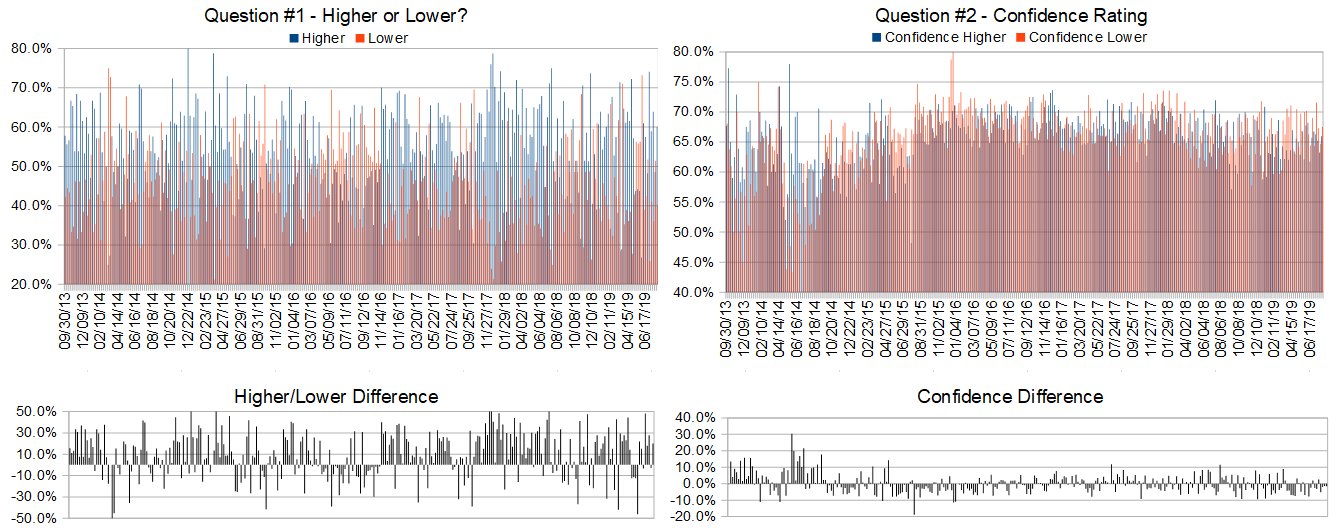
Question #1. Which direction do you think the S&P500 index will move from this coming Monday’s open to Friday’s close (September 30th to October 4th)?
The order of possible responses to this question on the survey were randomized for each viewer.)
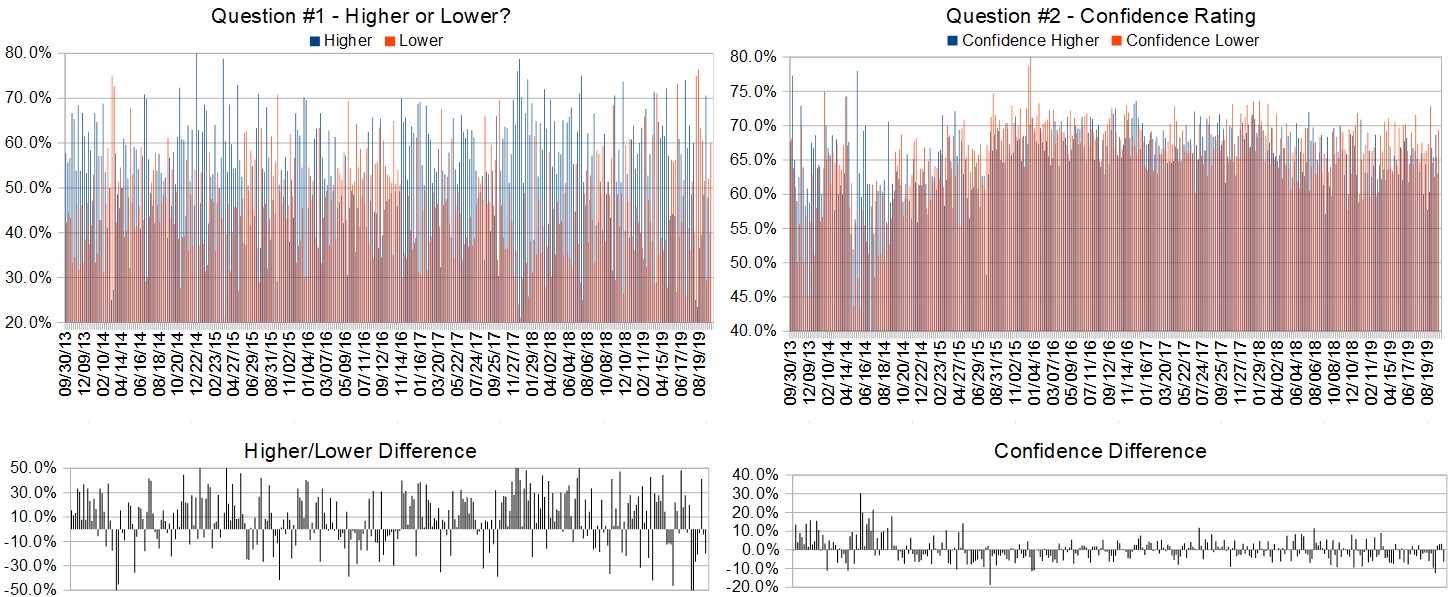
Higher: 44.4%
Lower: 55.6%
Higher/Lower Difference: -11.1%
Question #2. Rate your confidence in your answer to Question #2 by estimating the probability you have correctly predicted next week’s market move.
Average of All Responses: 63.9%
Average For “Higher” Responses: 61.7%
Average For “Lower” Responses: 65.7%
Higher/Lower Difference: -4.0%
Responses Submitted This Week: 27
52-Week Average Number of Responses: 36.3
TimingResearch Crowd Forecast Prediction: 55% Chance Higher
This prediction is an attempt by the editor of this newsletter to use the full 5 year history of data collected from this project to forecast a probability estimate for whether this week’s sentiment is going to be correct and ultimately what the markets will do this coming week.
Details: Last week’s majority sentiment from the survey was 60.0% Lower, and the Crowd Forecast Indicator prediction was 72% Chance Higher; the S&P500 closed 0.73% Lower for the week. This week’s majority sentiment from the survey is 55.6% Lower with a greater average confidence from those who responded Lower. Similar conditions have occurred 42 times in the previous 313 weeks, with the majority sentiment (Lower) being correct 45% of the time and with an average S&P500 move of 0.35% Higher for the week. Based on that history, the TimingResearch Crowd Forecast Indicator is forecasting a 55% Chance that the S&P500 is going to move Higher this coming week.
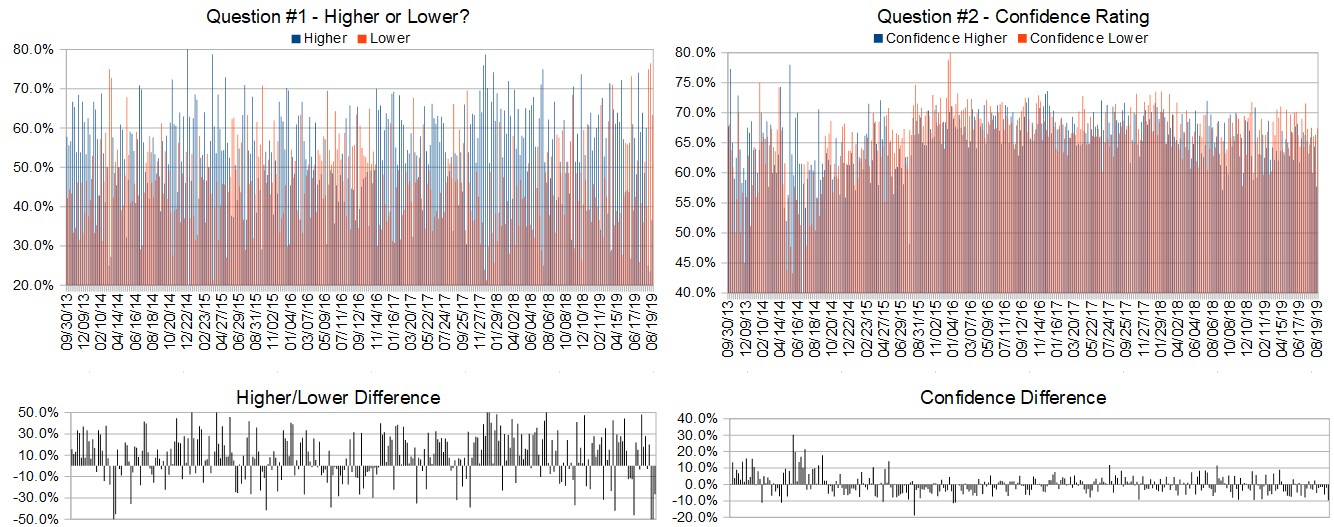
Raw Data Page (raw data files include full history spreadsheet and the above charts):
TimingResearch.com/data.
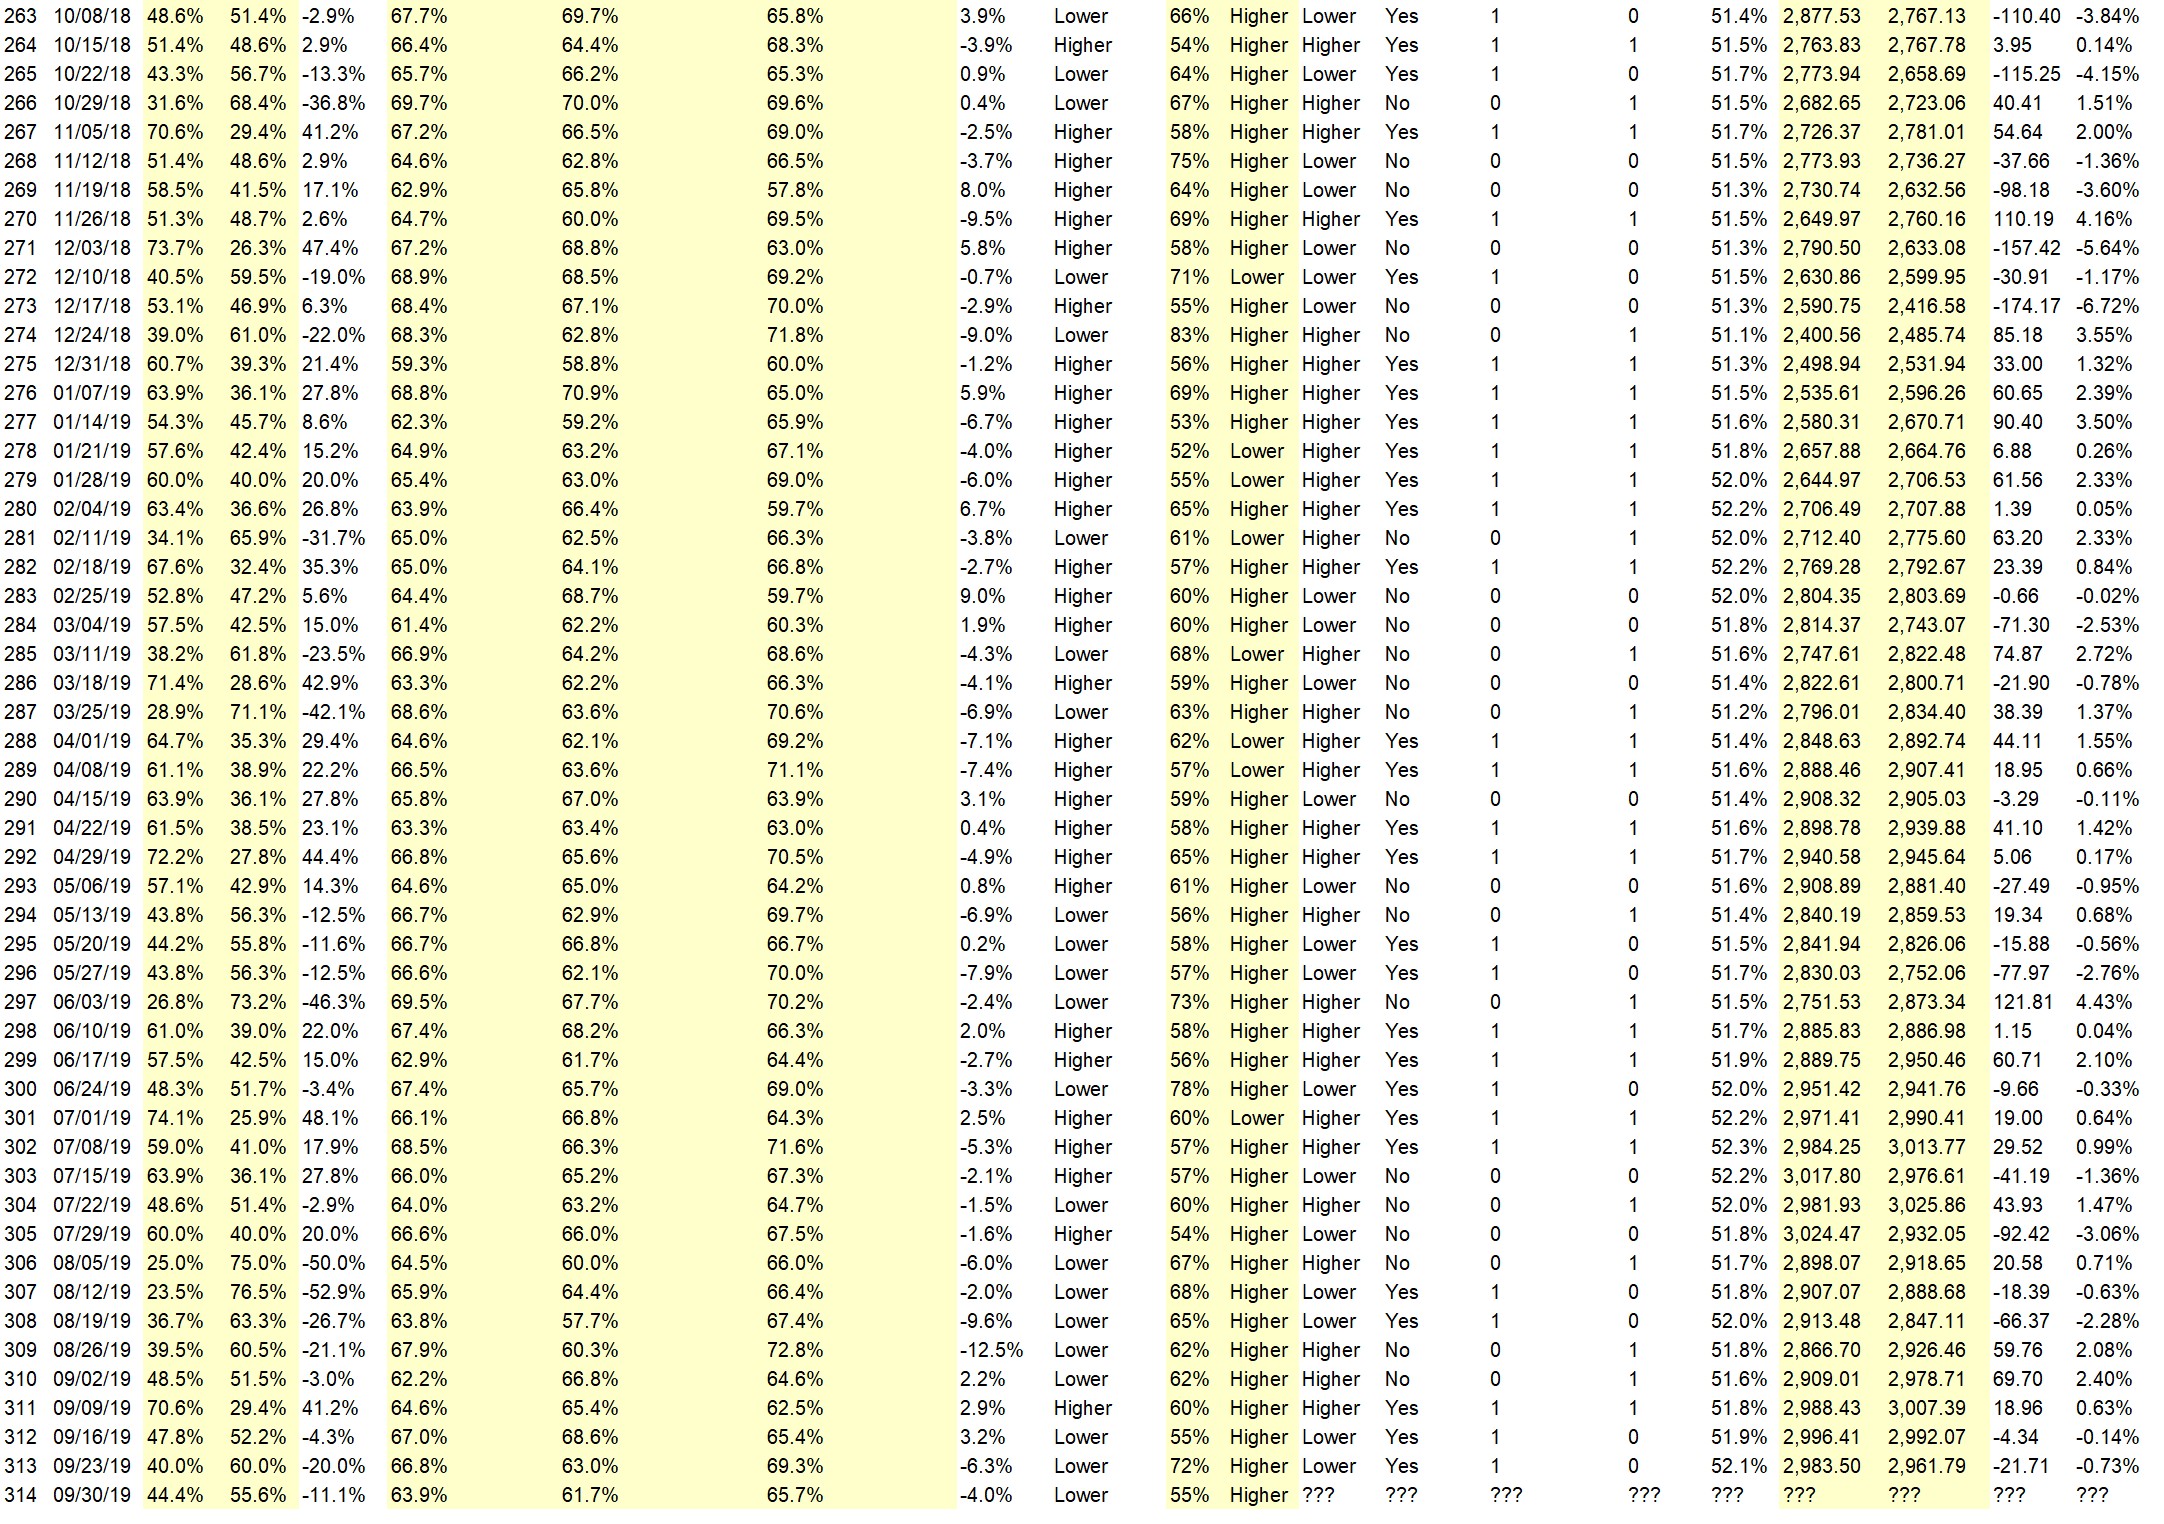
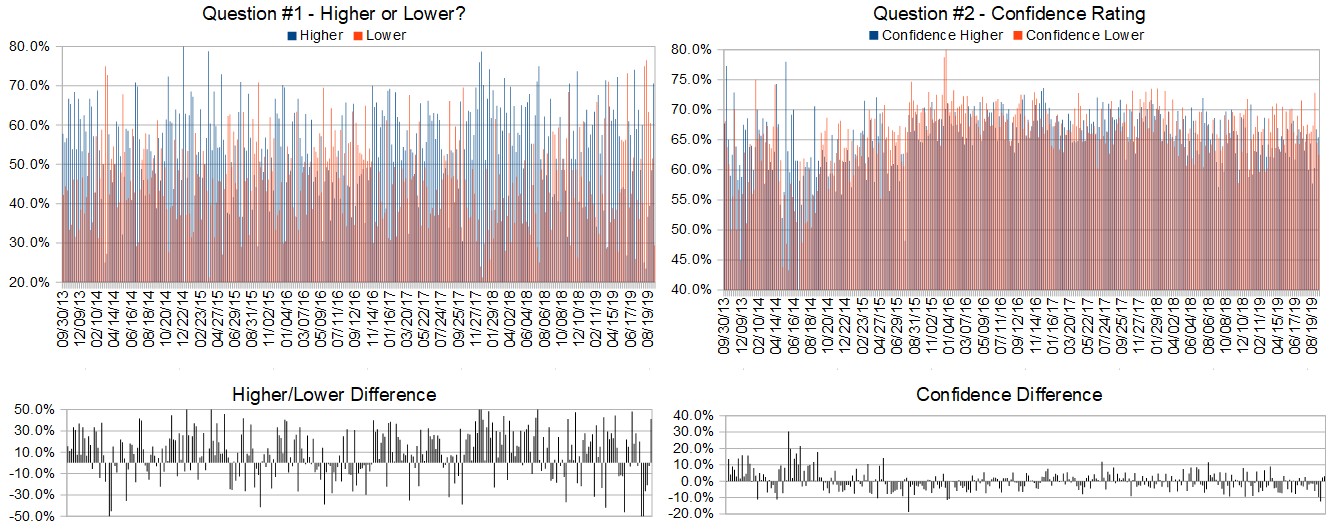
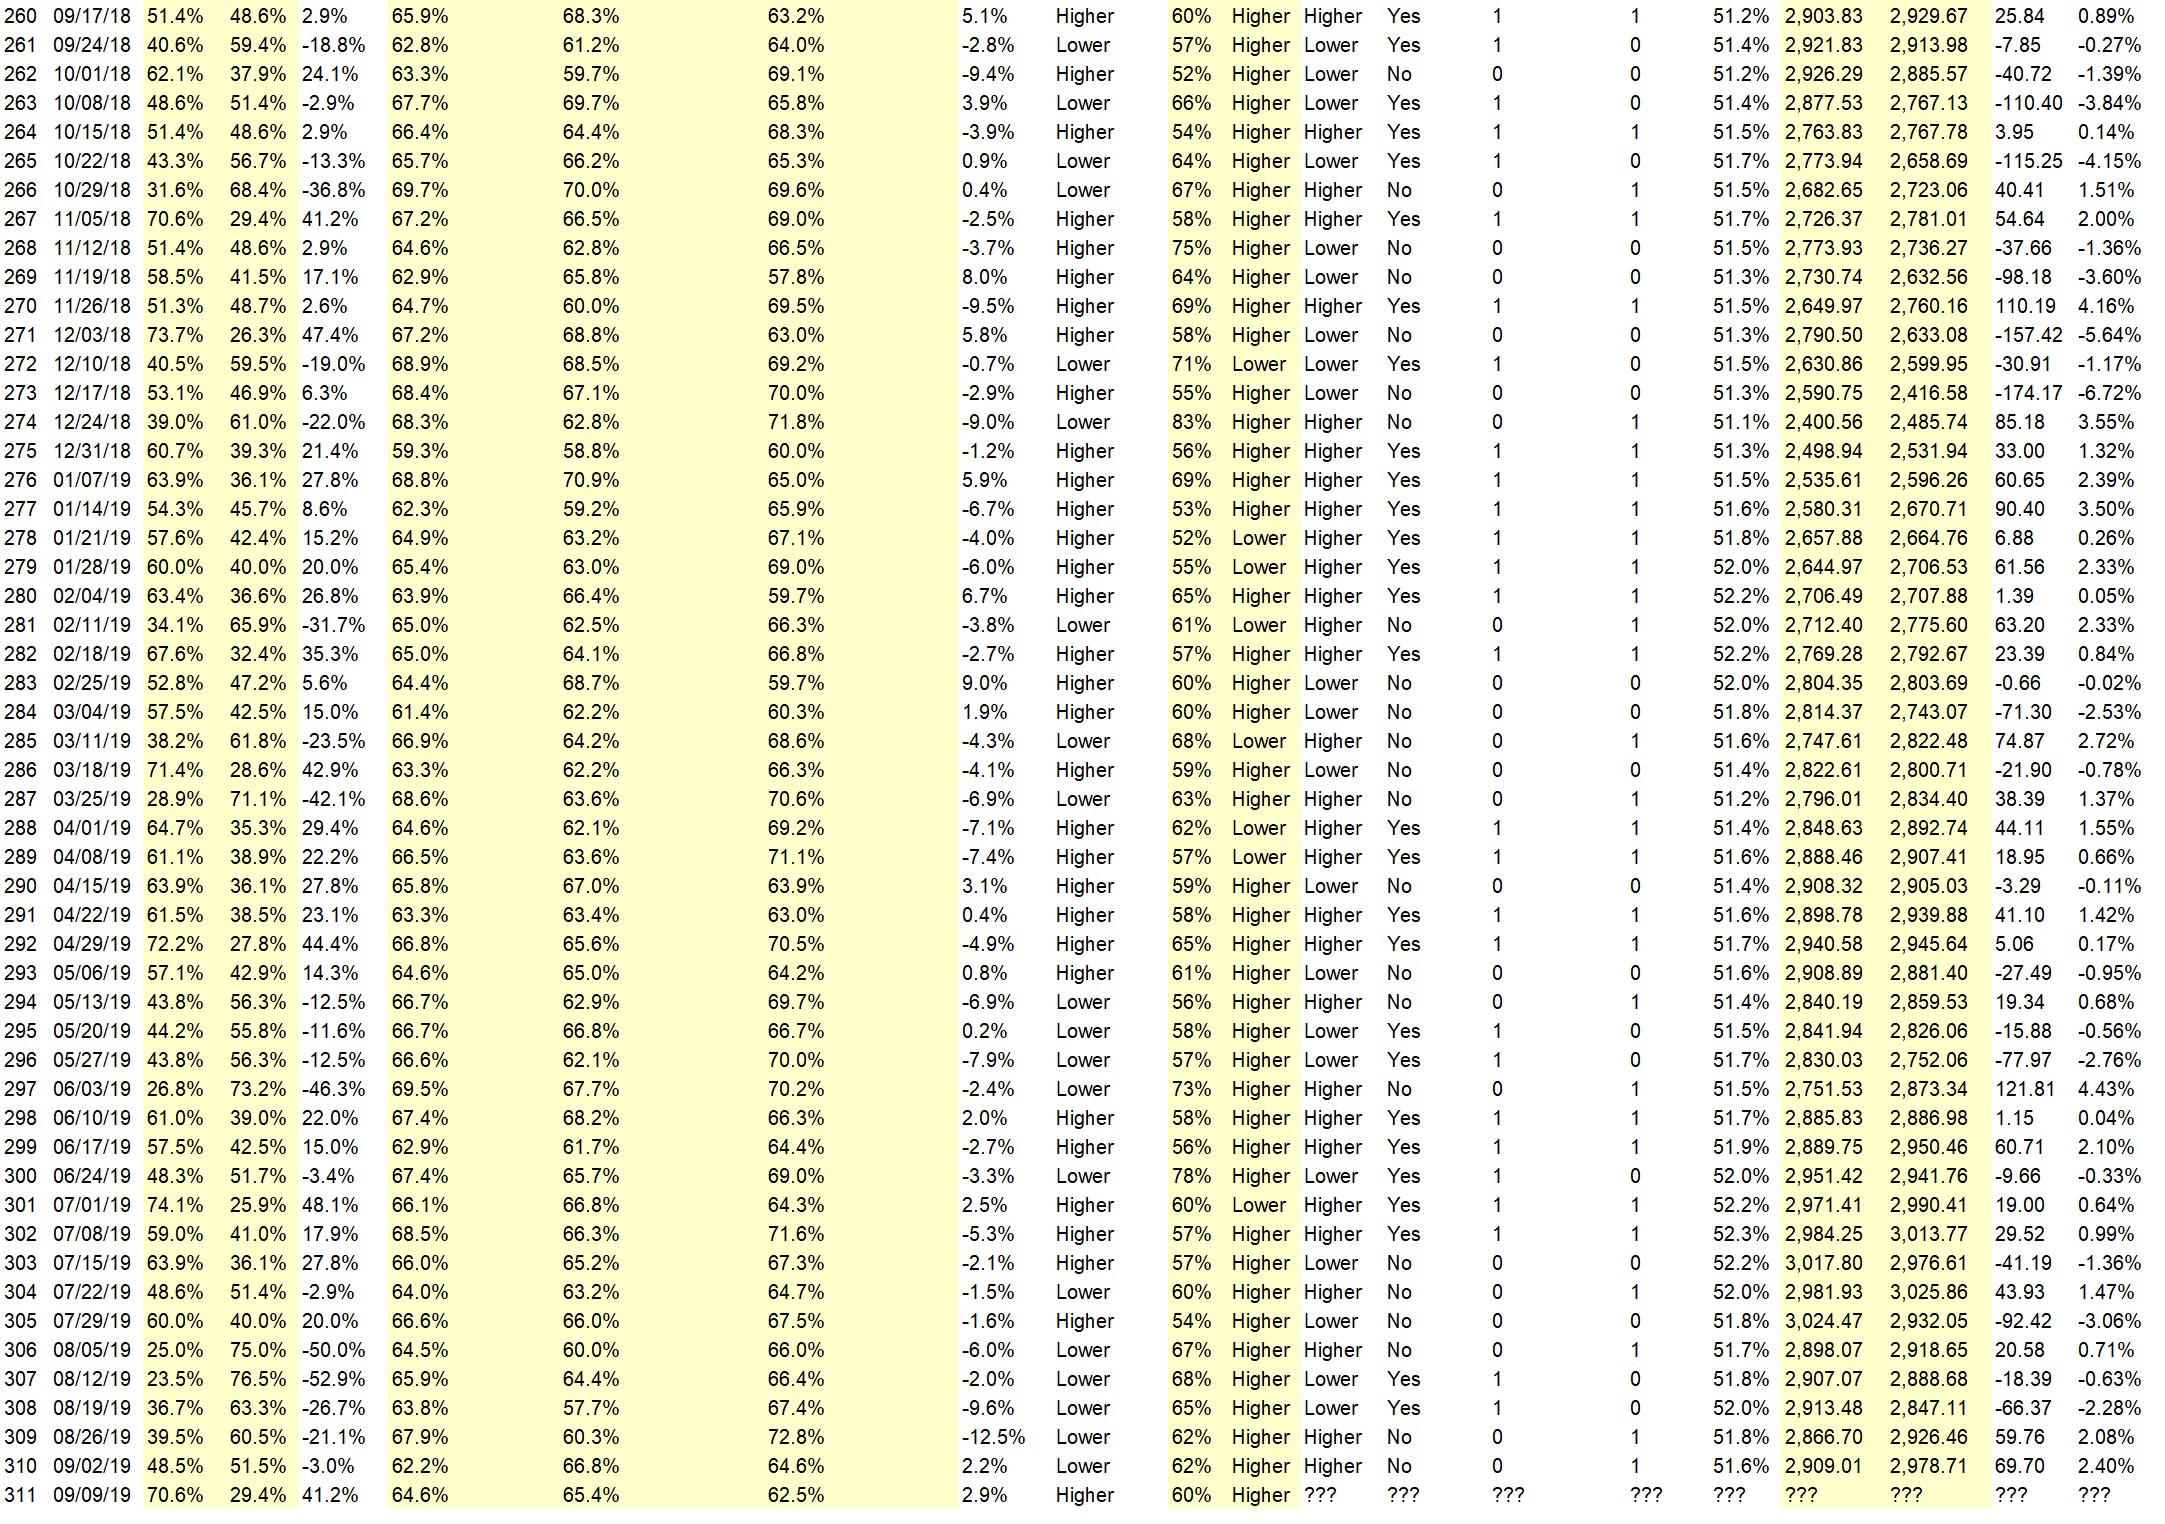
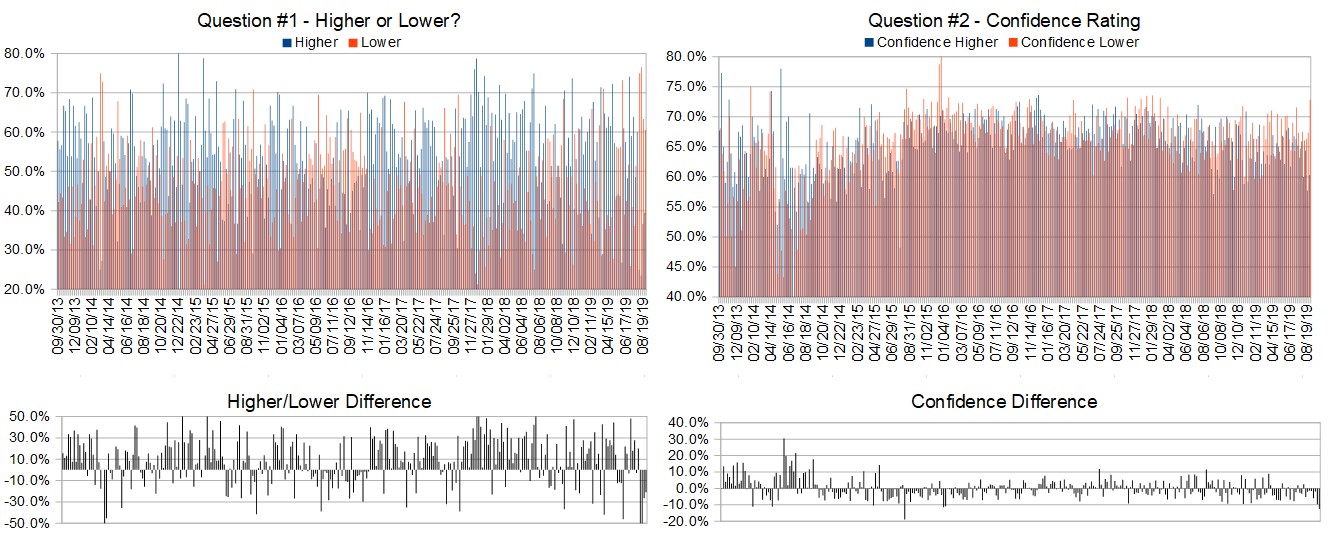
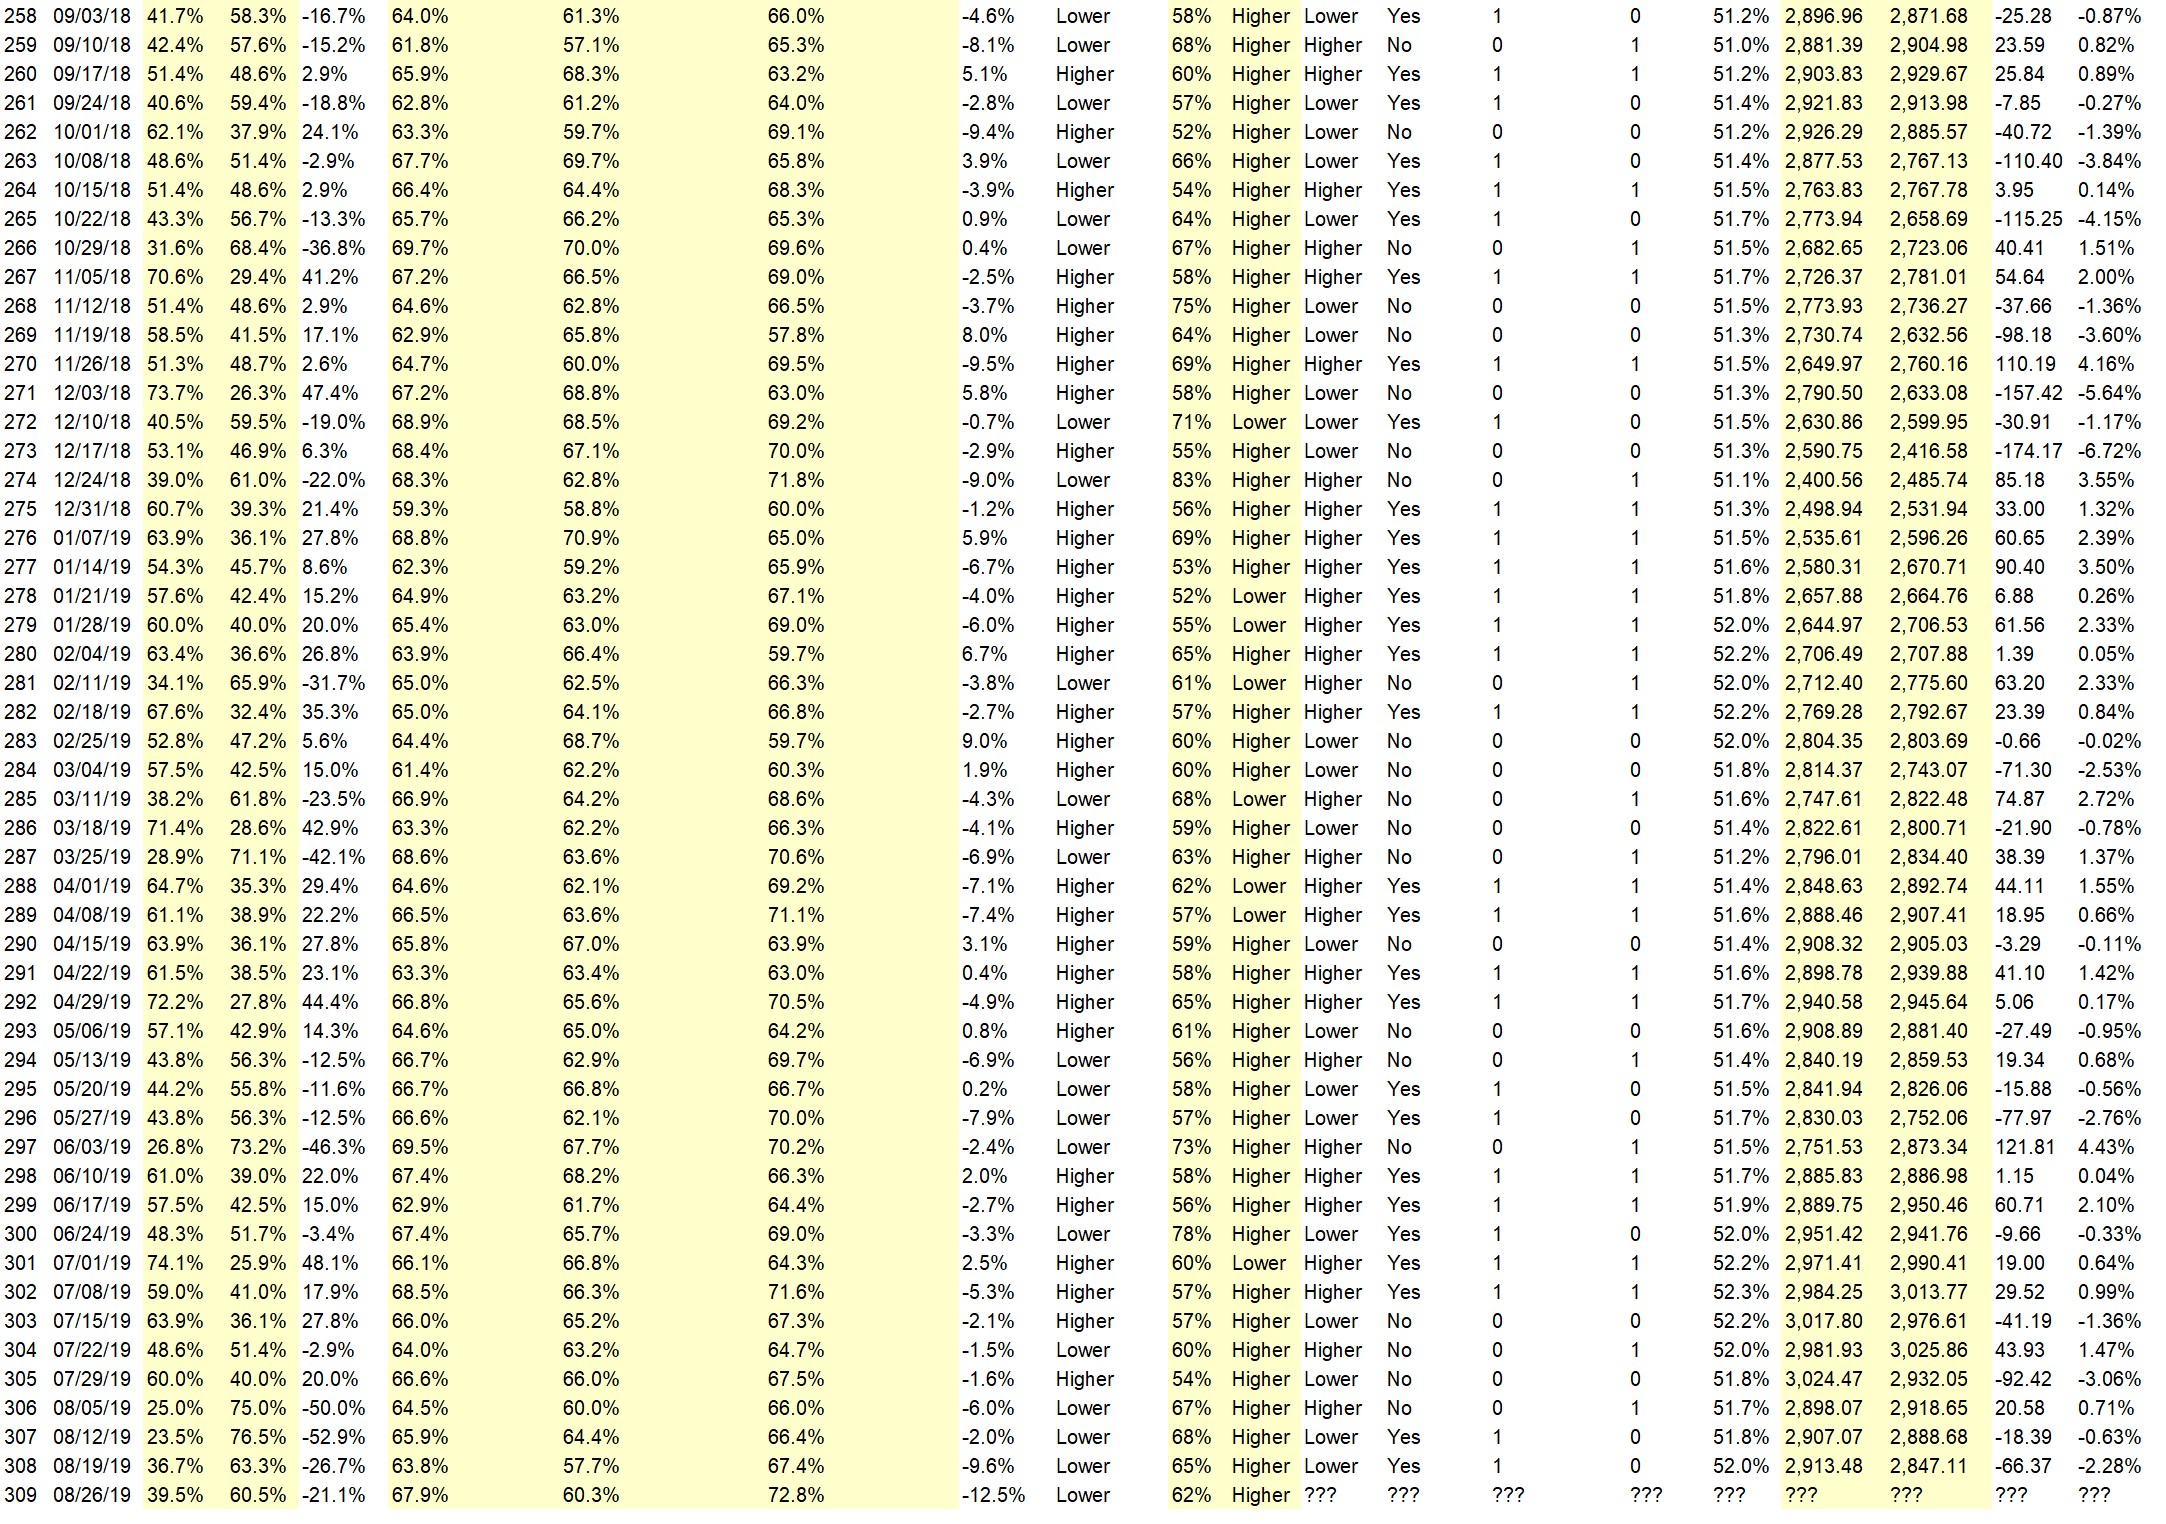
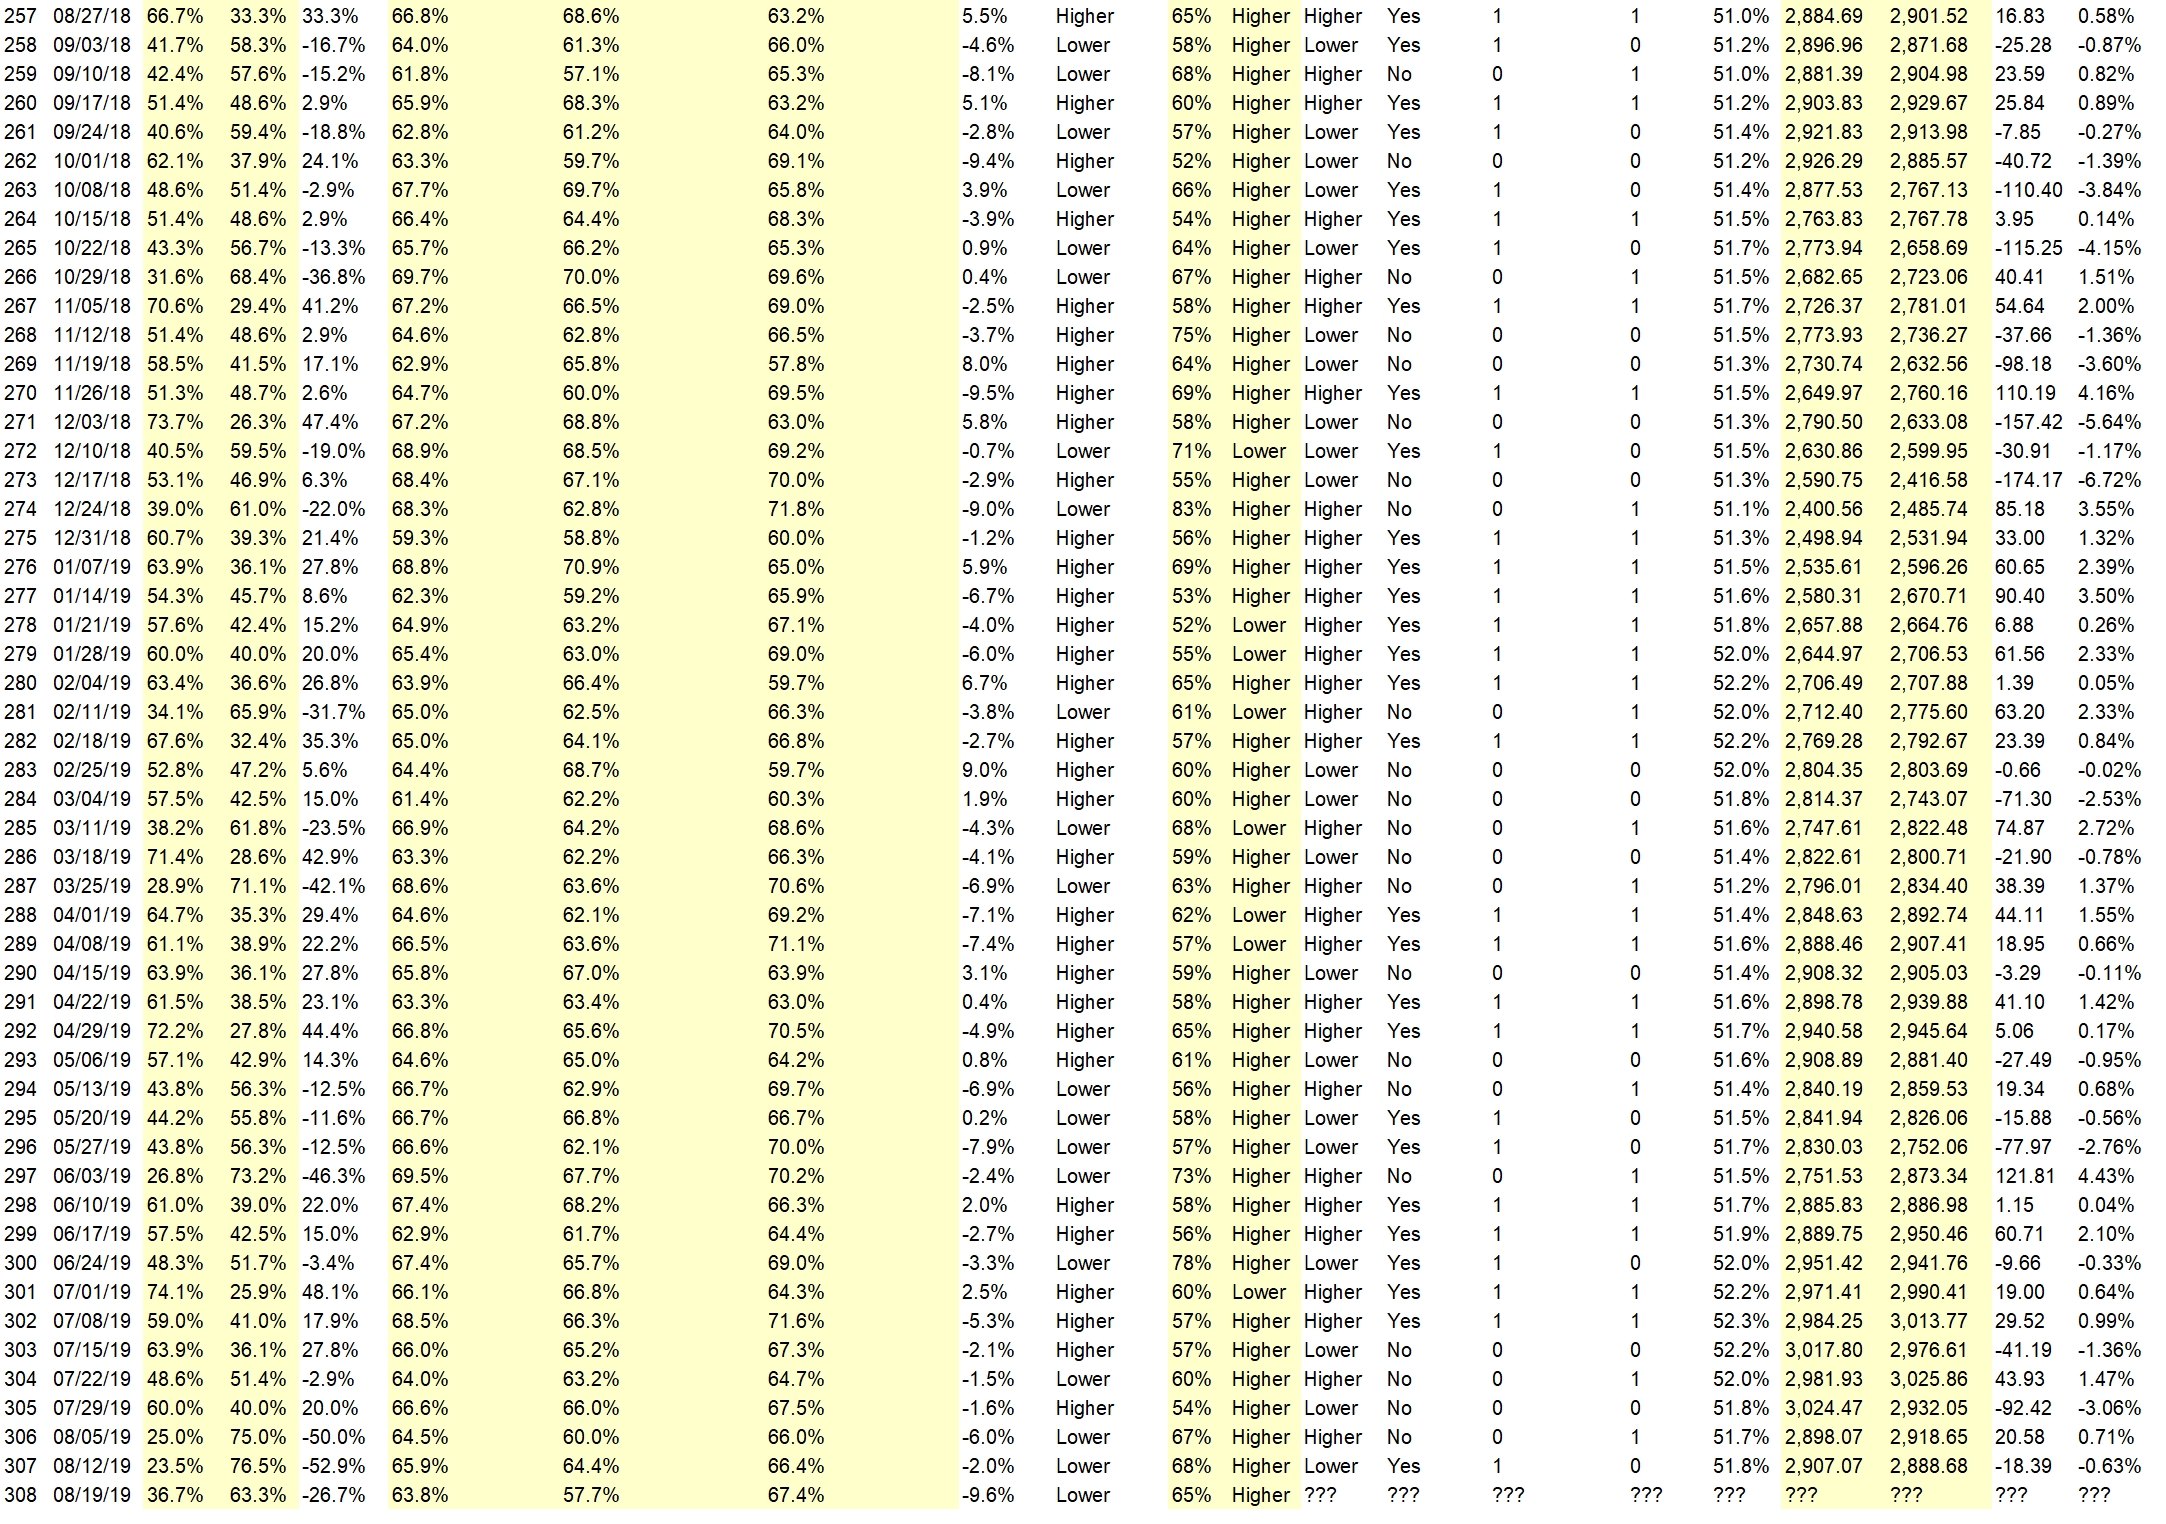
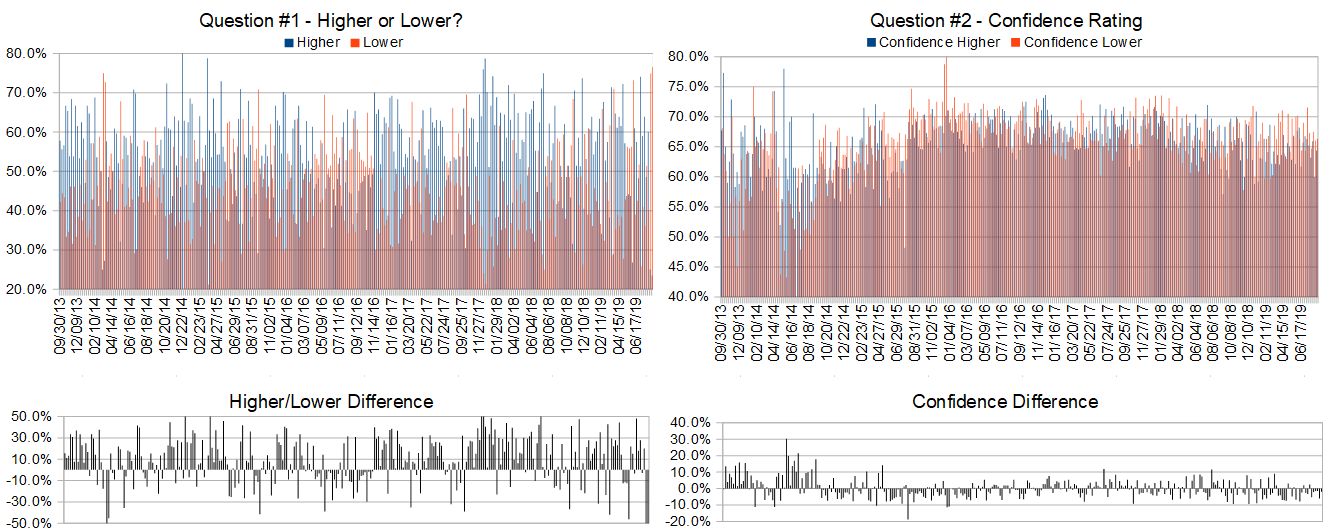
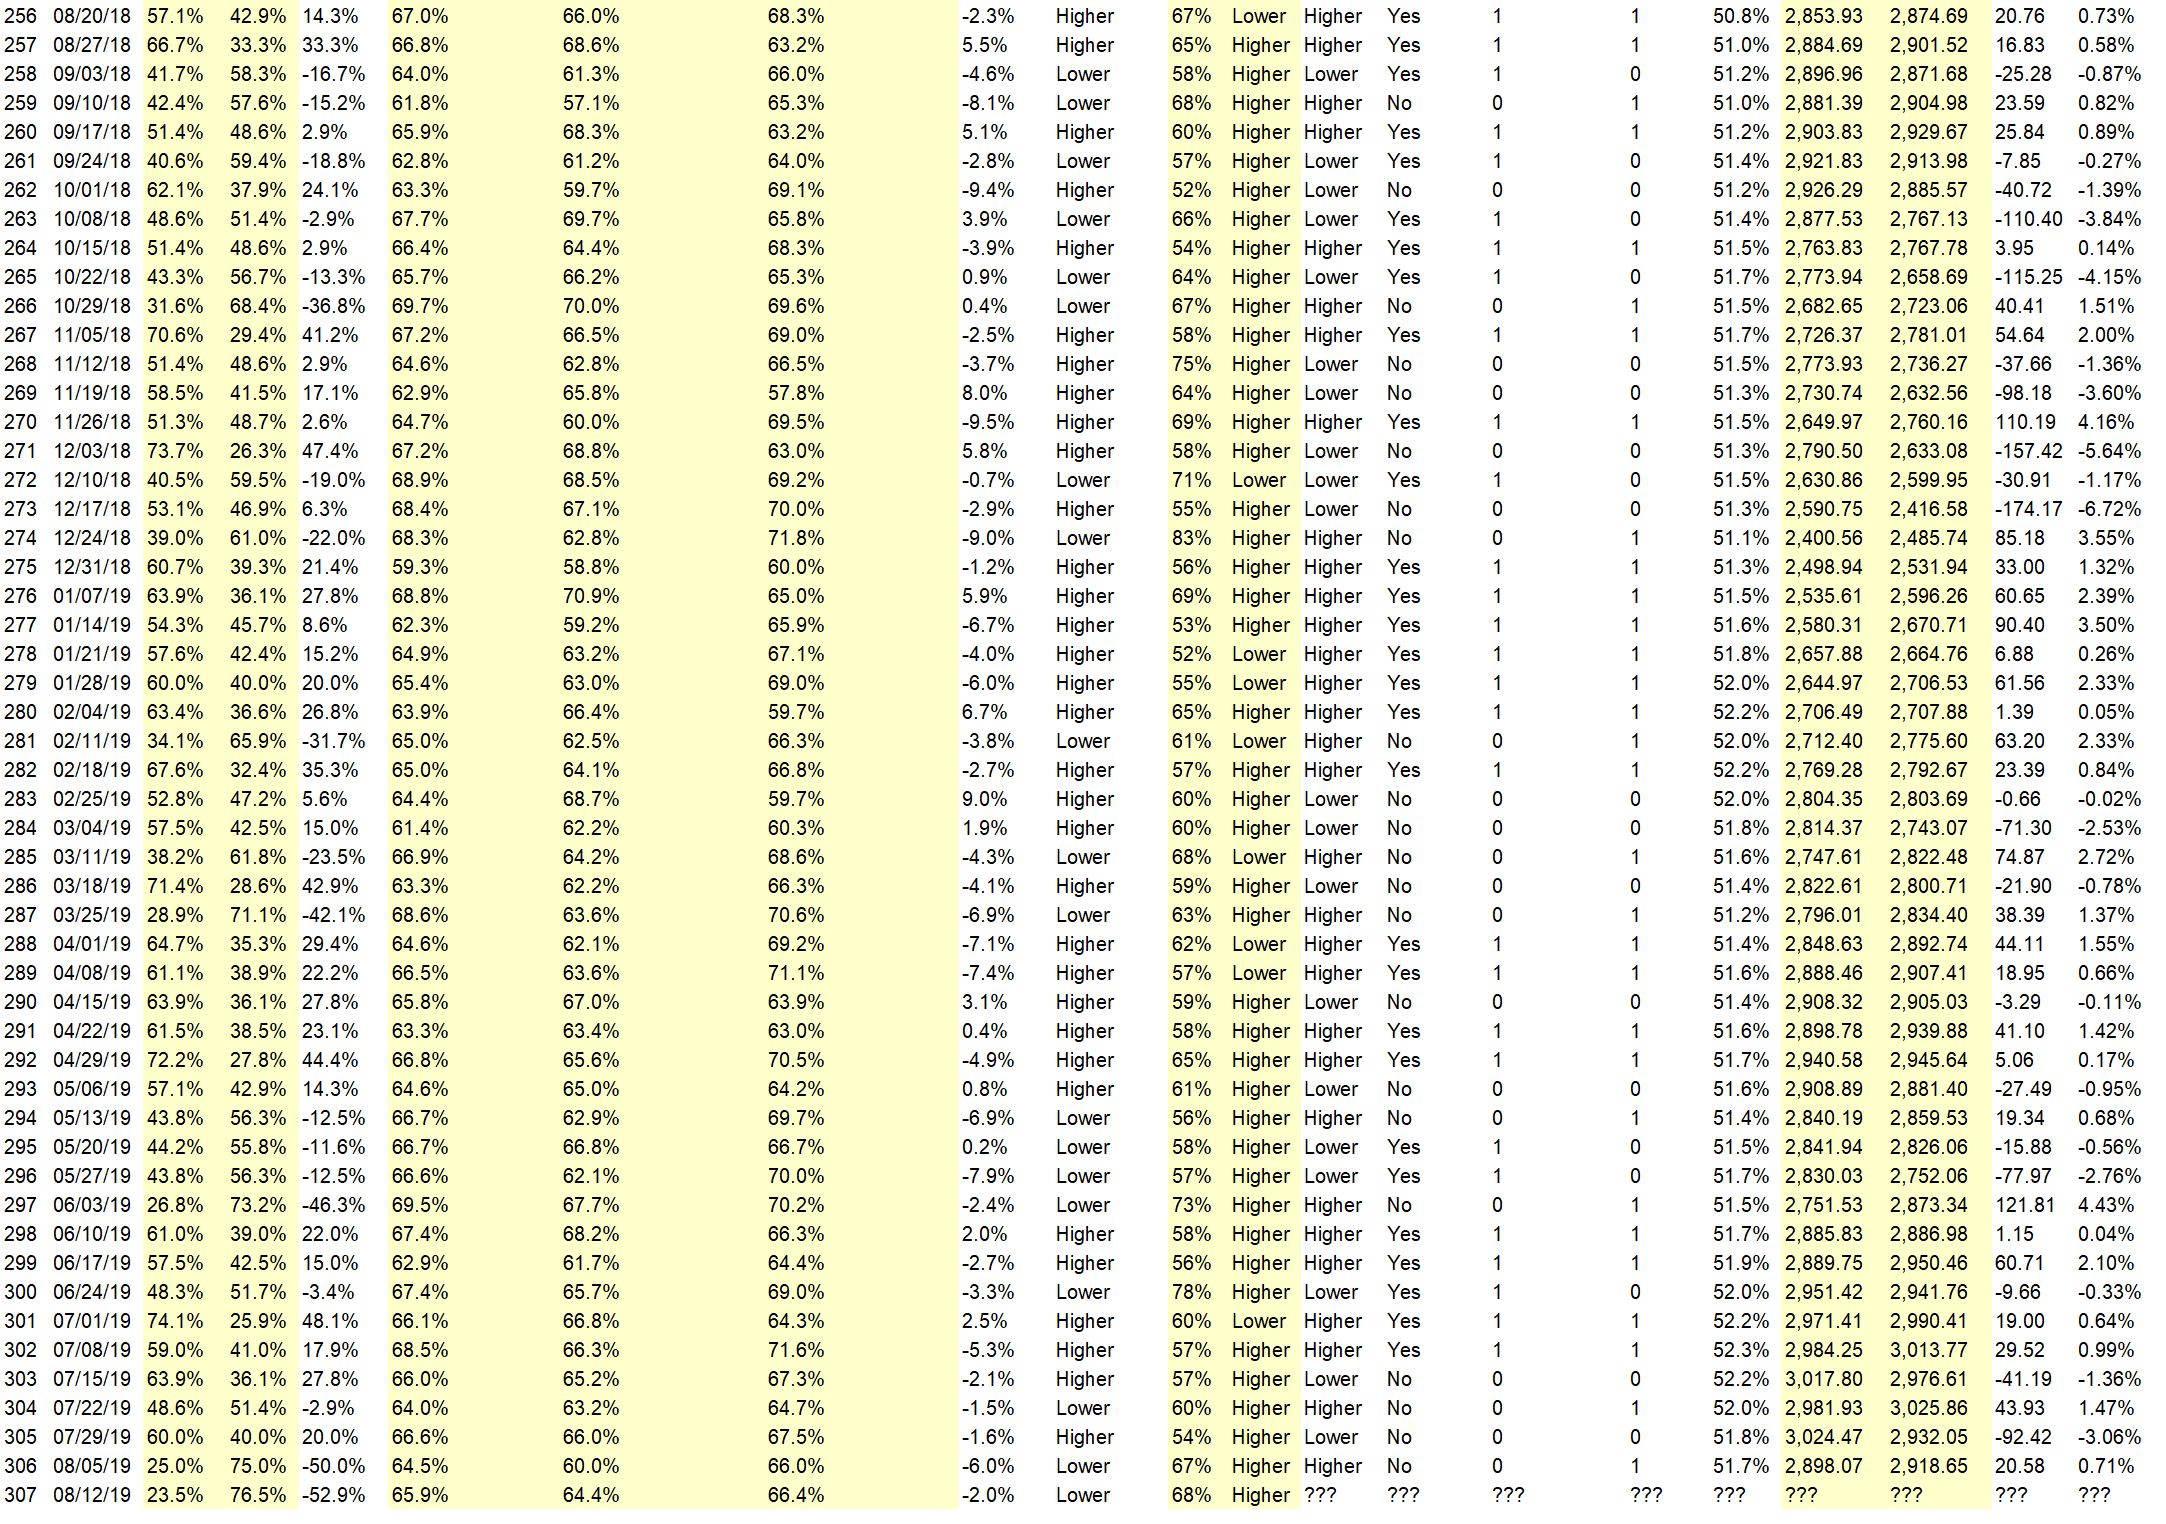
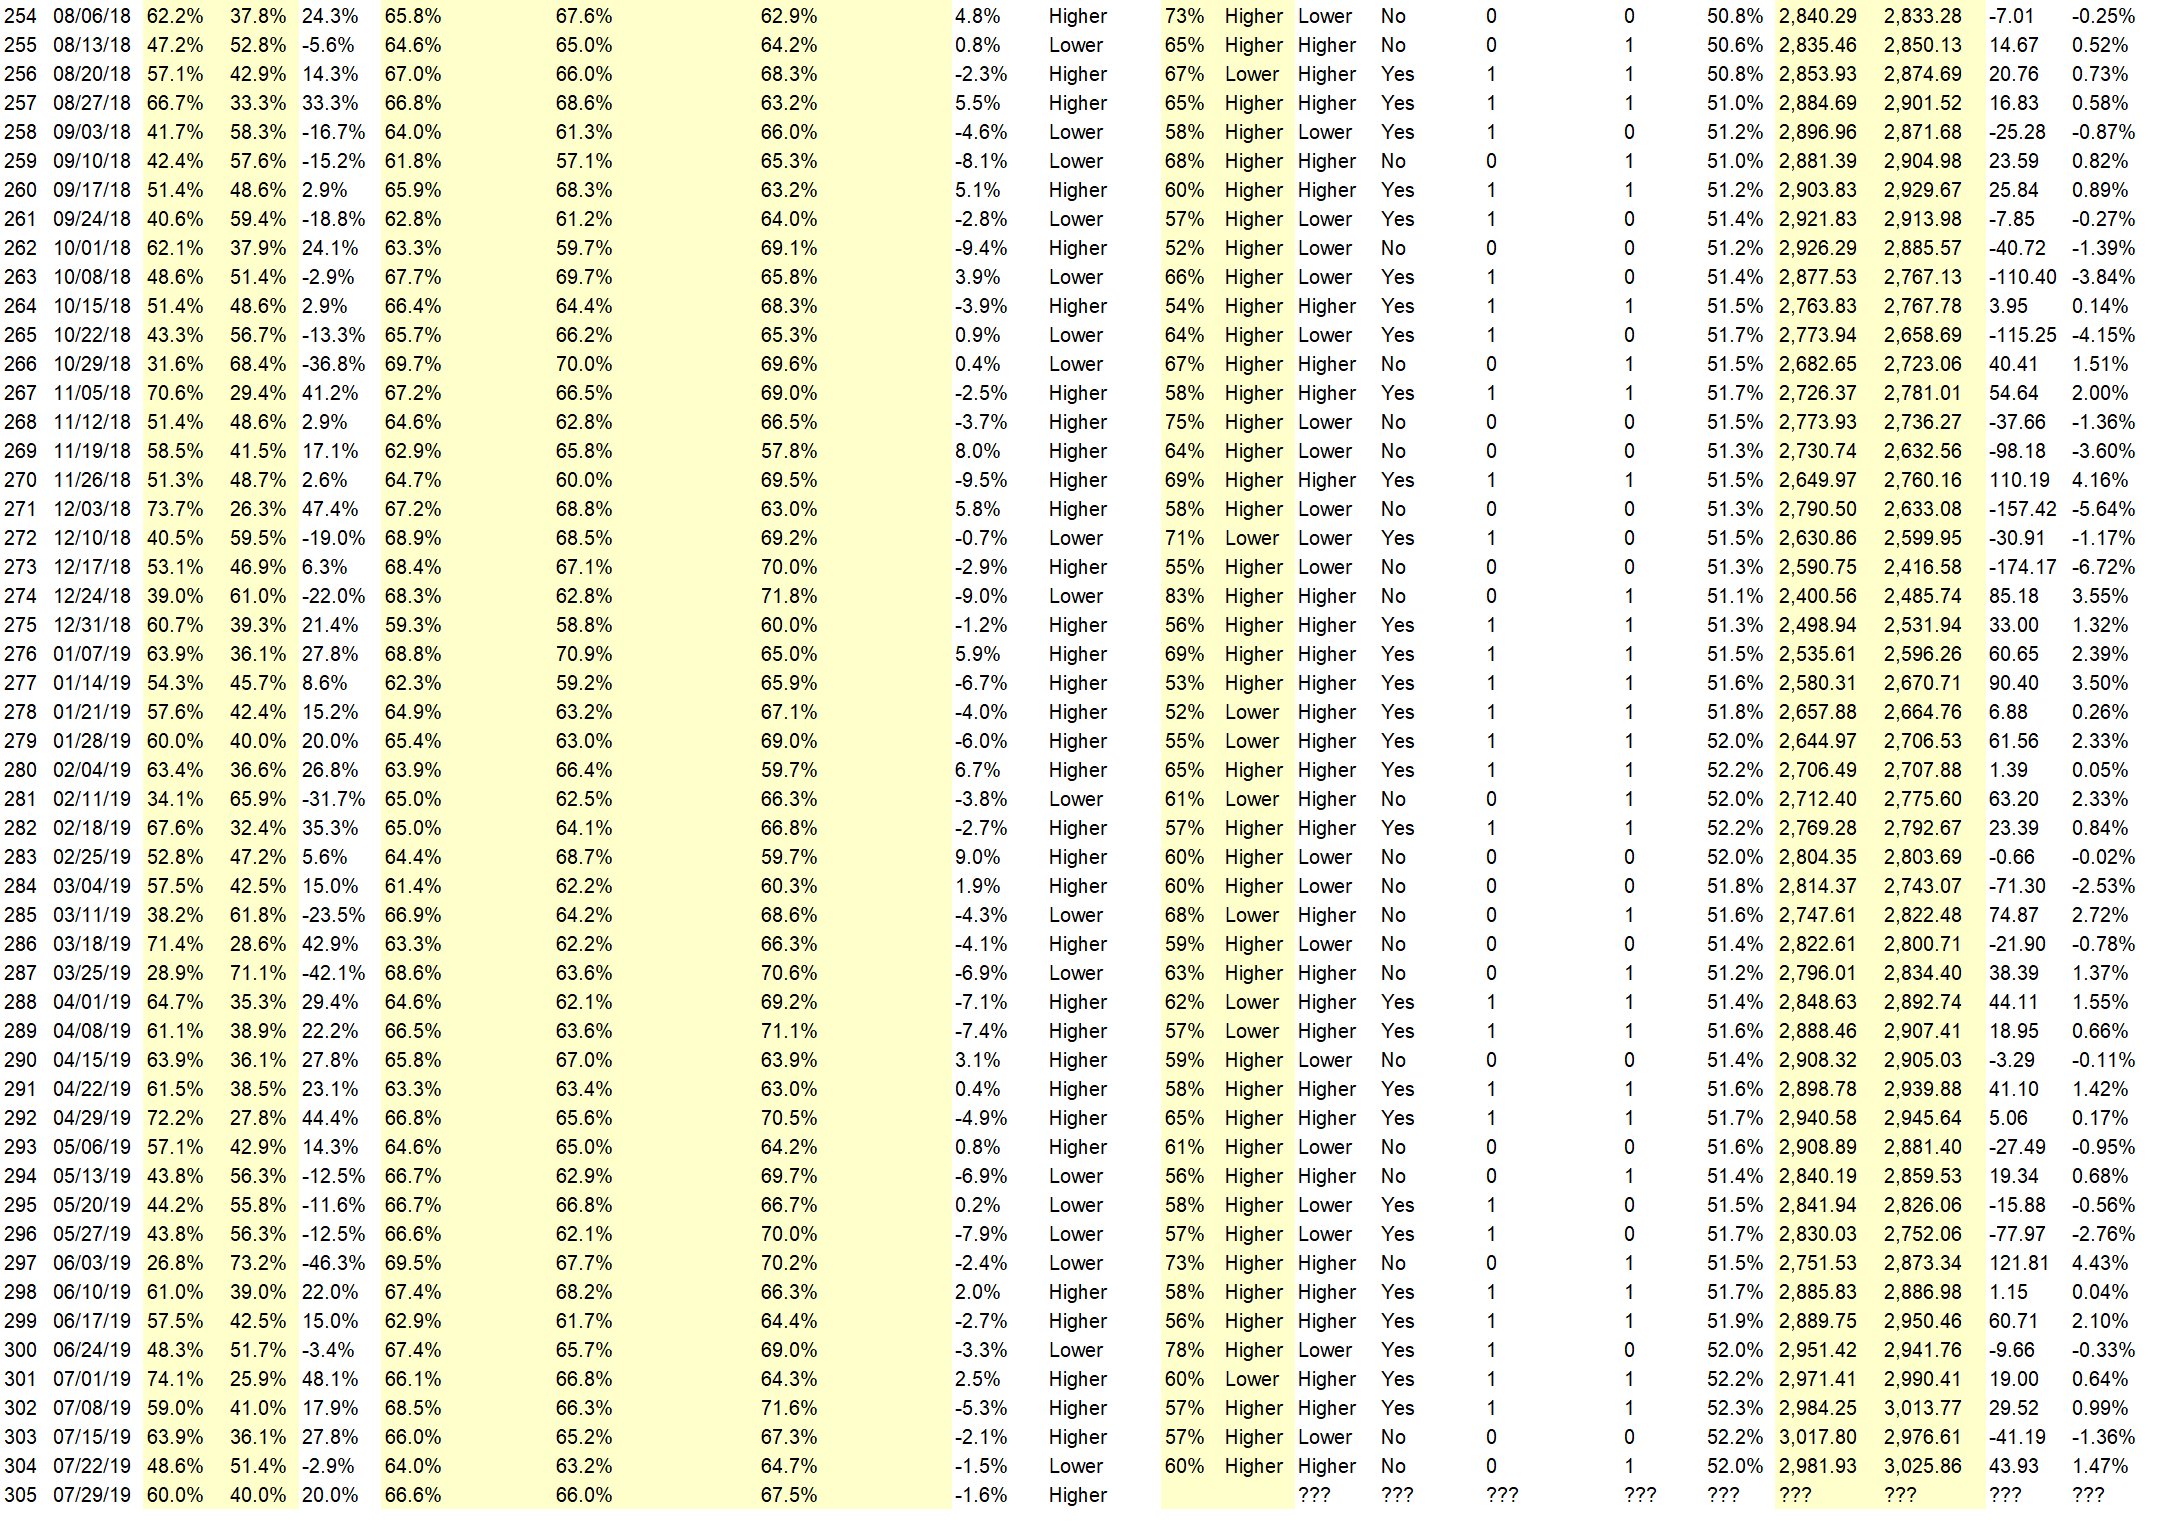
Full Weekly Results (full version of this chart available in the raw data spreadsheet for this week, “Date” field below lists the Monday of the week being predicted).
Overall Sentiment All-Time “Correct” Percentage: 63.9%
Overall Sentiment 52-Week “Correct” Percentage: 61.7%
Overall Sentiment 12-Week “Correct” Percentage: 65.7%
Only the previous 52 weeks of data are shown below, please download the raw data to see the full range of past data.
Weekly Reports Page: TimingResearch.com/reports
Raw Data Page: TimingResearch.com/rawdata
Current Survey Page: TimingResearch.com/currentsurvey
Any feedback: TimingResearch.com/contact
Email Alerts
Make sure you don’t miss all the future reports, show reminders, and bonus offers from TimingResearch, enter your email here:
By signing up you agree to receive newsletter and alert emails. You can unsubscribe at any time. Privacy Policies
NOTE: The following open-ended answers are solely the opinions of the anonymous respondents to this survey. Responses are mostly unedited, but some have been reformatted slightly for to make them easier to read. Some irrelevant responses (e.g. “none”), or anything obviously fake, or copy and pasted responses have been omitted. All-caps responses have been changed to all lowercase. All responses for each week, unedited, are available in the raw data spreadsheets at TimingResearch.com/data.
Question #3. For your answer to Question #1, please share what specific reason(s) you think the S&P500 will be heading the direction you chose.
“Higher” Respondent Answers:
• I think next weeks market will move sideways. A lot of uncertainties in trade and the political picture.
• Low interest rates
• Bounce from this week
• resolution of impeachment
• Just a guess
• Trade deal
• The chart pattern suggests a lower start the week followed by a rebound rally.
“Lower” Respondent Answers:
• More White House Craziness
• lower before weekly wave 5 continues
• Range bound with weakness to the downside
• Unexpected move from whitehouse but hope this will be a rumor.
• Harry Dent
• China tarrifs
• S&P struggling at this point. Business investments lower; China trade issues going nowhere.
• Trump tweeting some market shaking things in an effort to move the news cycle away from the impeachment inquiry
• Its September. High probability the market corrects.
• Trends
Question #4. What sort of hedging or portfolio protection strategies do you implement in your trading or investing?
• Sell puts when unsure of market direction
• I don’t hedge
• One Triggers Two (OTT) = One Cancels Other (OCO) – at open of the options trade , place orders for both win (at +100% or such) and loss (-50% or such) on the options; ensure losses restricted and winners get closed before retracing
• stop losses
• Selling calls
• sell puts
• with Gold options
• Options: Buy/Sell Puts in-out
• None
• out of money calls and out of money puts
• TC2000
• Options
• Buy puts. Buy inverse etf’s
Question #5. Additional Comments/Questions/Suggestions?
• N/A
• Gold Rising
Join us for this week’s shows:
Crowd Forecast News Episode #240
This week’s show will feature a discussion with the trading experts listed below about the most recent TimingResearch Crowd Forecast Newsletter report, where they think the S&P500 is headed, what they are watching for in the markets currently, and their best trading idea.
Date and Time:
– Monday, September 30th, 2019
– 1PM ET (10AM PT)
Moderator and Guests:
– Jake Bernstein of Trade-Futures.com
– Mark Sachs of RightLineTrading.com
– Jim Kenney of OptionProfessor.com (moderator)
Analyze Your Trade Episode #96
When you register, you will be prompted to list the top 5 stocks that you are interested in trading. We will list the top 5 from all registrants and our experts will be prepared to offer their opinions on these trades.
Date and Time:
– Tuesday, October 1st, 2019
– 4PM ET (1PM PT)
Moderator and Guests:
– Lance Ippolito of AlphaShark.com
– Jim Kenney of OptionProfessor.com (moderator)
Crowd Forecast News Report #313
AD: [eBook] “Monthly Income Blueprint”
The new TimingResearch report for the week has been posted, you can download the full PDF report with the link below or you can read the full report in this post below.
Click here to download report in PDF format: TRReport092219.pdf
Question #1. Which direction do you think the S&P500 index will move from this coming Monday’s open to Friday’s close (September 23rd to 27th)?
The order of possible responses to this question on the survey were randomized for each viewer.)
Higher: 40.0%
Lower: 60.0%
Higher/Lower Difference: -20.0%
Question #2. Rate your confidence in your answer to Question #2 by estimating the probability you have correctly predicted next week’s market move.
Average of All Responses: 66.8%
Average For “Higher” Responses: 63.0%
Average For “Lower” Responses: 69.3%
Higher/Lower Difference: -6.3%
Responses Submitted This Week: 28
52-Week Average Number of Responses: 36.4
TimingResearch Crowd Forecast Prediction: 72% Chance Higher
This prediction is an attempt by the editor of this newsletter to use the full 5 year history of data collected from this project to forecast a probability estimate for whether this week’s sentiment is going to be correct and ultimately what the markets will do this coming week.
Details: Last week’s majority sentiment from the survey was 52.2% Lower, and the Crowd Forecast Indicator prediction was 55% Chance Higher; the S&P500 closed 0.14% Lower for the week. This week’s majority sentiment from the survey is 60.0% Lower with a greater average confidence from those who responded Lower. Similar conditions have occurred 25 times in the previous 312 weeks, with the majority sentiment (Lower) being correct 28% of the time and with an average S&P500 move of 0.63% Higher for the week. Based on that history, the TimingResearch Crowd Forecast Indicator is forecasting a 72% Chance that the S&P500 is going to move Higher this coming week.
Raw Data Page (raw data files include full history spreadsheet and the above charts):
TimingResearch.com/data.
AD: [eBook] “Monthly Income Blueprint”
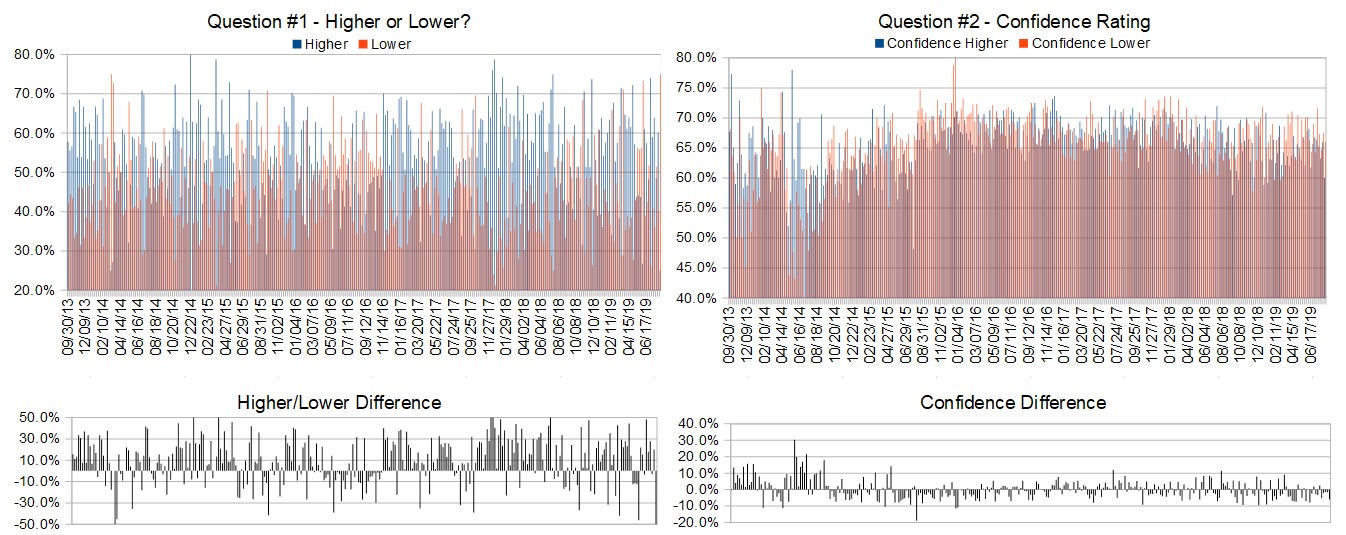
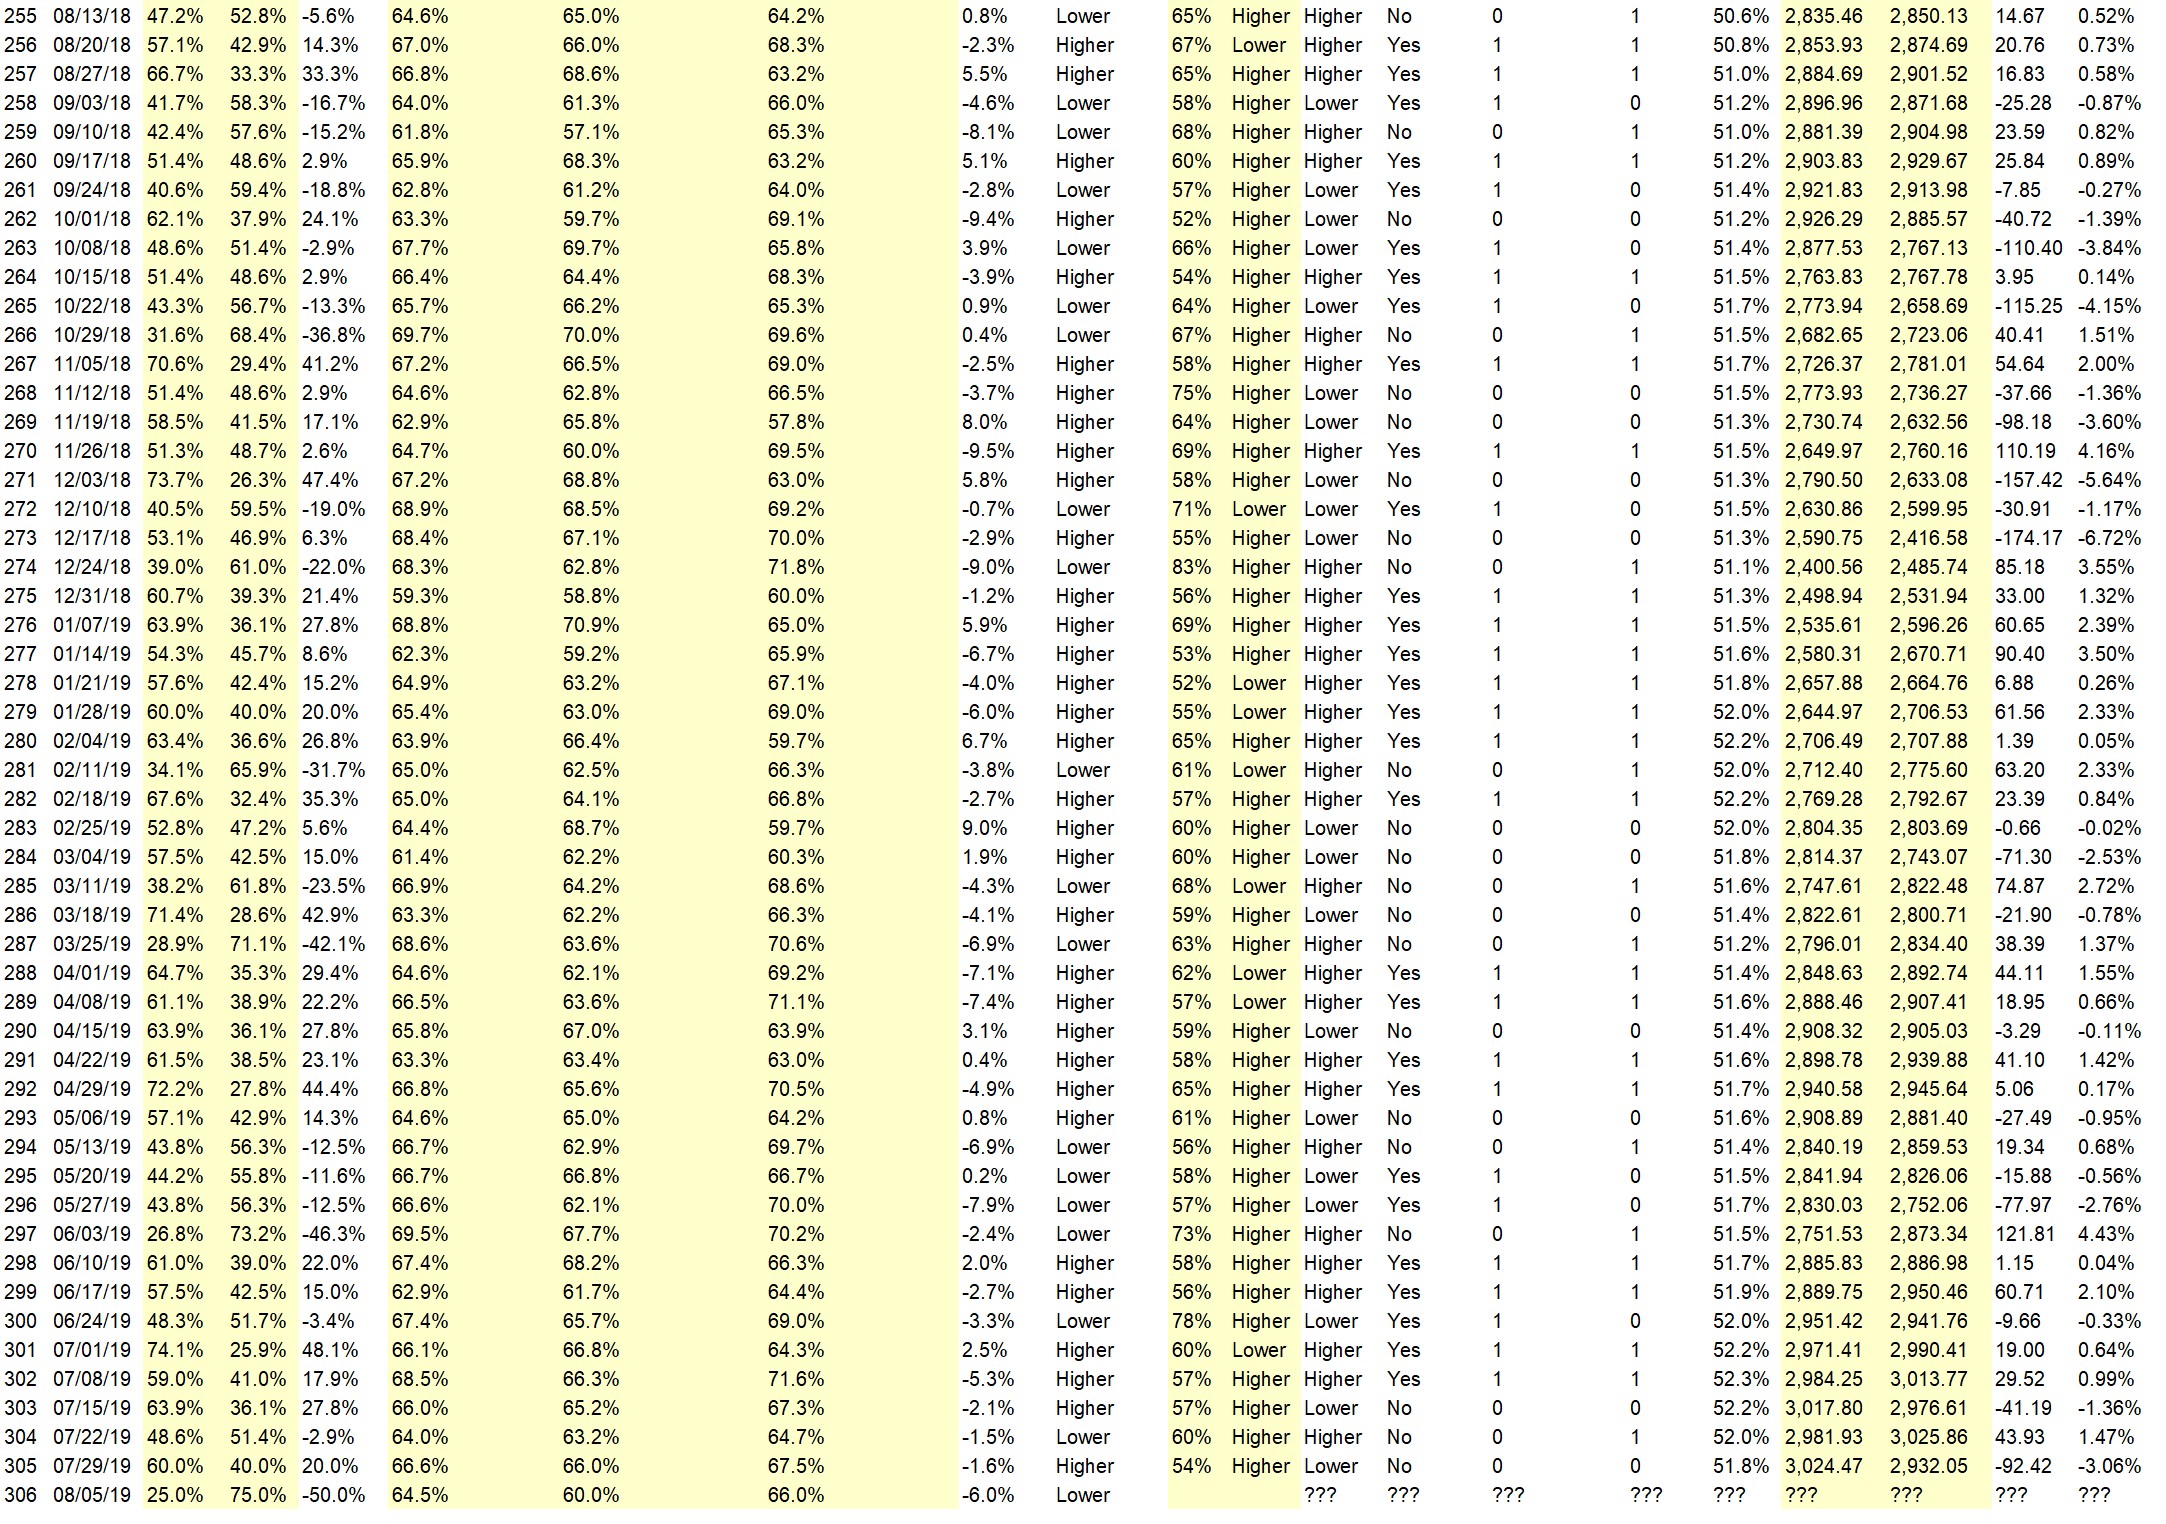
Full Weekly Results (full version of this chart available in the raw data spreadsheet for this week, “Date” field below lists the Monday of the week being predicted).
Overall Sentiment All-Time “Correct” Percentage: 51.9%
Overall Sentiment 52-Week “Correct” Percentage: 54.9%
Overall Sentiment 12-Week “Correct” Percentage: 45.5%
Only the previous 52 weeks of data are shown below, please download the raw data to see the full range of past data.
Weekly Reports Page: TimingResearch.com/reports
Raw Data Page: TimingResearch.com/rawdata
Current Survey Page: TimingResearch.com/currentsurvey
Any feedback: TimingResearch.com/contact
Email Alerts
Make sure you don’t miss all the future reports, show reminders, and bonus offers from TimingResearch, enter your email here:
By signing up you agree to receive newsletter and alert emails. You can unsubscribe at any time. Privacy Policies
NOTE: The following open-ended answers are solely the opinions of the anonymous respondents to this survey. Responses are mostly unedited, but some have been reformatted slightly for to make them easier to read. Some irrelevant responses (e.g. “none”), or anything obviously fake, or copy and pasted responses have been omitted. All-caps responses have been changed to all lowercase. All responses for each week, unedited, are available in the raw data spreadsheets at TimingResearch.com/data.
Question #3. For your answer to Question #1, please share what specific reason(s) you think the S&P500 will be heading the direction you chose.
“Higher” Respondent Answers:
• Tate Reeves campaign maybe
• trend
• Earnings
• China trade news. No negative surprises this week as had one this past Friday
• Interest rates trending down
“Lower” Respondent Answers:
• Stagnant Market, geopolitical tensions. Iran, China, US earnings. Approaching elections not a concern as long as Trump wins.
• US/China tariff trade problems
• Chart pattern, increased geopolitical pressures, possible armed conflict between Saudi Arabia and Iran with US backing Saudi Arabia – increased pressure on political situation in Washington DC.
• Post triple witching Friday.
• Friday’s sell off
• us-china trade war iran tensions
• S&P looks like it reversed to downward this past Thurs & Fri. Volatility measure moving up. US-China trade talks more pessimistic.
• Highs proving a barrier
• Fear&Greed index still showing more greed than fear. But look out below when it starts showing fear.
AD: [eBook] “Monthly Income Blueprint”
Question #4. Which trading platform or broker do you like the best for executing your trades?
• think or swim
• TC2000
• Tastyworks
• schwab
• I don’t have 1
• Tradestation
• Interactivebrokers
• Fidessa by ADM
• E-Trade.
• td ameri trade
• TradeStation
• Fidelity
• Fidelity
• TOS platform from Thinkorswim
• Interactive Brokers
Question #5. Additional Comments/Questions/Suggestions?
• Gold & Silver will rise higher out of the sideways conjestion. Shorts covering with new buyers coming in.
Join us for this week’s shows:
Crowd Forecast News Episode #239
This week’s show will feature a discussion with the trading experts listed below about the most recent TimingResearch Crowd Forecast Newsletter report, where they think the S&P500 is headed, what they are watching for in the markets currently, and their best trading idea.
Date and Time:
– Monday, September 23rd, 2019
– 1PM ET (10AM PT)
Moderator and Guests:
– Norman Hallett of TheDisciplinedTrader.com
– Mark Sachs of RightLineTrading.com
– Michael Guess of DayTradeSafe.com
– Jim Kenney of OptionProfessor.com (moderator)
Analyze Your Trade Episode #95
When you register, you will be prompted to list the top 5 stocks that you are interested in trading. We will list the top 5 from all registrants and our experts will be prepared to offer their opinions on these trades.
Date and Time:
– Tuesday, September 24th, 2019
– 4PM ET (1PM PT)
Moderator and Guests:
– Mike Pisani of AlphaShark.com & SmartOptionTrading.com
– Jim Kenney of OptionProfessor.com (moderator)
AD: [eBook] “Monthly Income Blueprint“
Crowd Forecast News Report #312
The new TimingResearch report for the week has been posted, you can download the full PDF report with the link below or you can read the full report in this post below.
Click here to download report in PDF format: TRReport091519.pdf
Question #1. Which direction do you think the S&P500 index will move from this coming Monday’s open to Friday’s close (September 16th to 20th)?
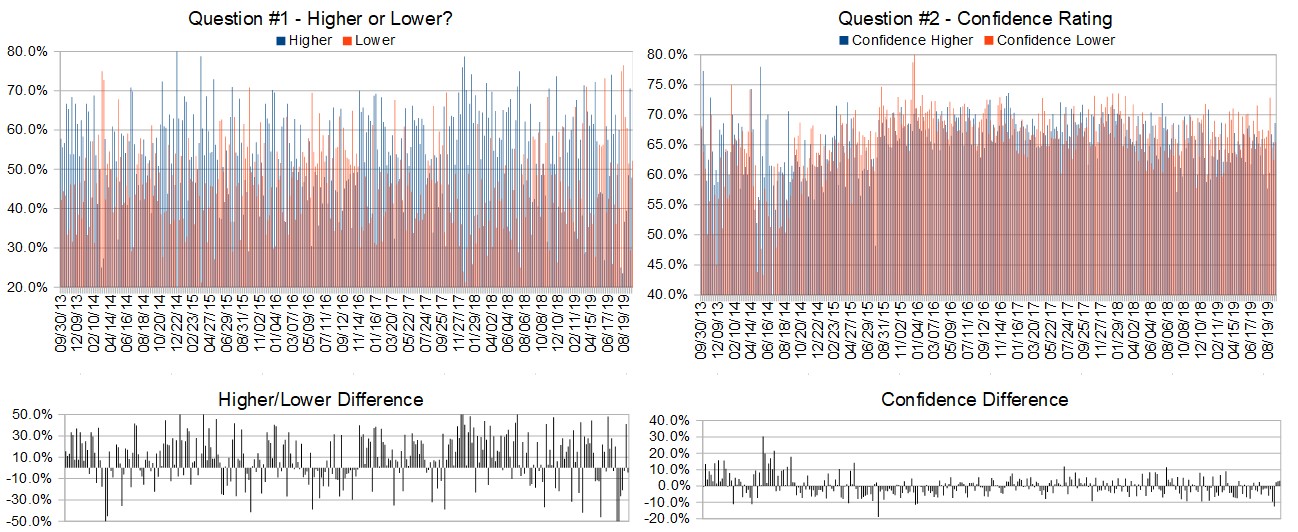
Higher: 47.8%
Lower: 52.2%
Higher/Lower Difference: -4.3%
Question #2. Rate your confidence in your answer to Question #2 by estimating the probability you have correctly predicted next week’s market move.
Responses Submitted This Week: 25
52-Week Average Number of Responses: 36.5
TimingResearch Crowd Forecast Prediction: 55% Chance Higher
This prediction is an attempt by the editor of this newsletter to use the full 5 year history of data collected from this project to forecast a probability estimate for whether this week’s sentiment is going to be correct and ultimately what the markets will do this coming week.
Details: Last week’s majority sentiment from the survey was 70.6% Higher, and the Crowd Forecast Indicator prediction was 60% Chance Higher; the S&P500 closed 0.63% Higher for the week. This week’s majority sentiment from the survey is 52.2% Lower with a greater average confidence from those who responded Higher. Similar conditions have occurred 22 times in the previous 311 weeks, with the majority sentiment (Lower) being correct 45% of the time and with an average S&P500 move of 0.10% Lower for the week. Based on that history, the TimingResearch Crowd Forecast Indicator is forecasting a 55% Chance that the S&P500 is going to move Higher this coming week.
Raw Data Page (raw data files include full history spreadsheet and the above charts):
TimingResearch.com/data.
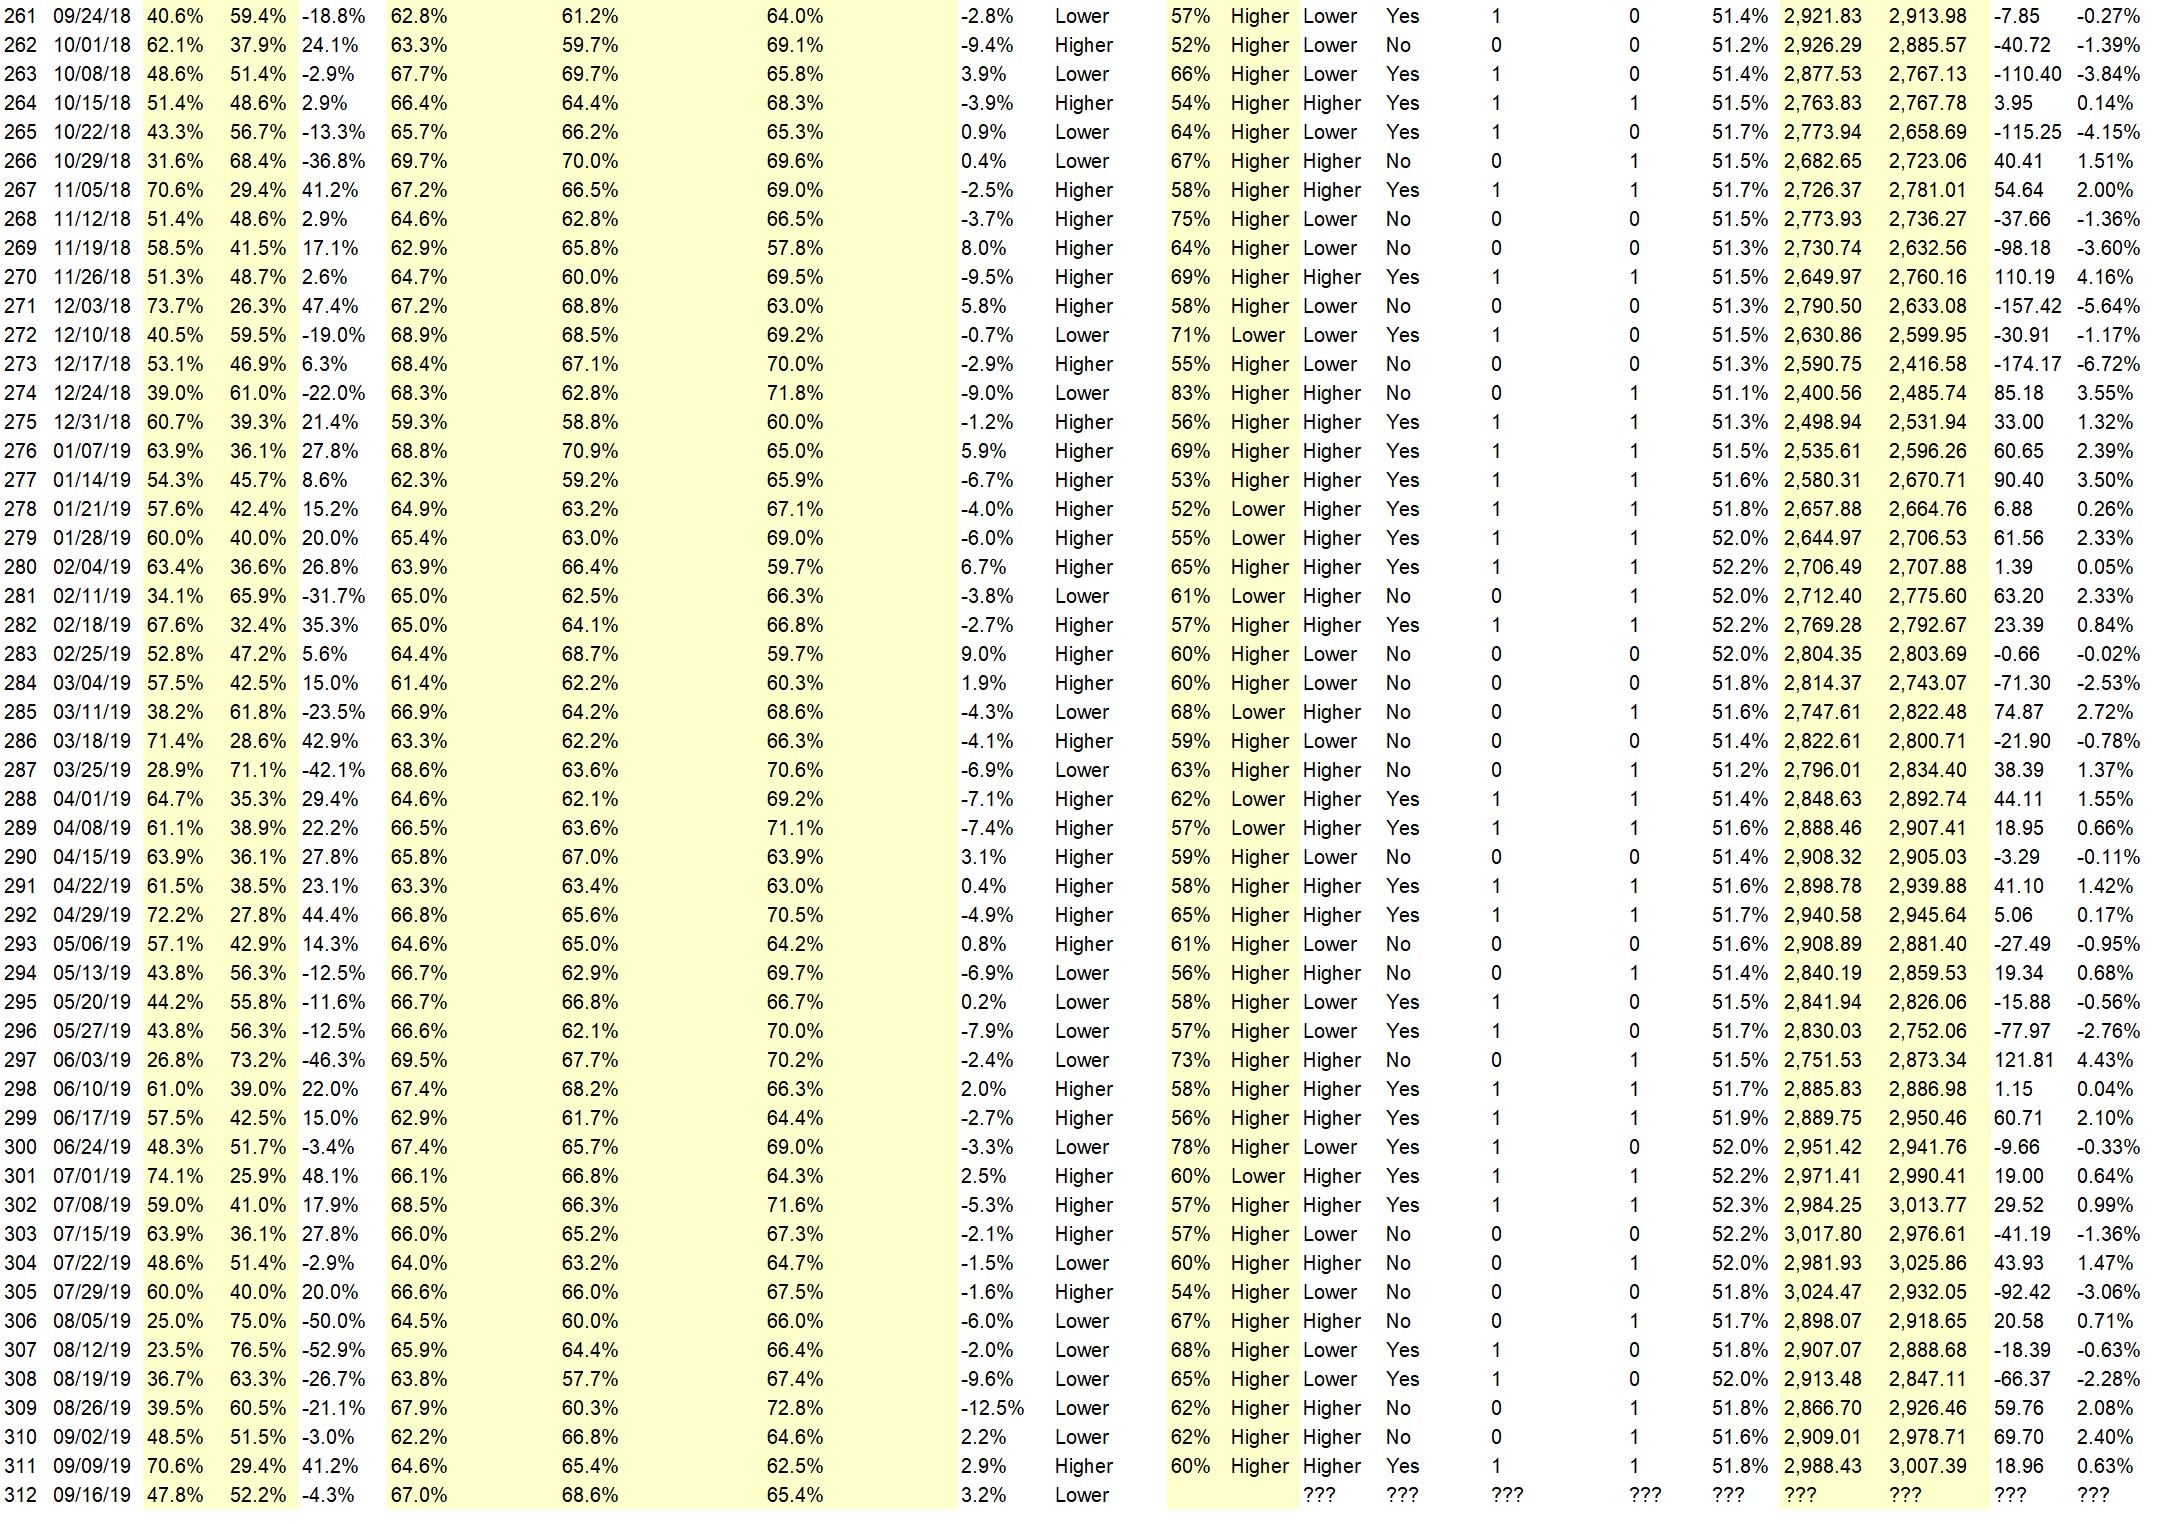
Full Weekly Results (full version of this chart available in the raw data spreadsheet for this week, “Date” field below lists the Monday of the week being predicted).
Overall Sentiment All-Time “Correct” Percentage: 51.8%
Overall Sentiment 52-Week “Correct” Percentage: 54.9%
Overall Sentiment 12-Week “Correct” Percentage: 45.5%
Only the previous 52 weeks of data are shown below, please download the raw data to see the full range of past data.
Weekly Reports Page: TimingResearch.com/reports
Raw Data Page: TimingResearch.com/rawdata
Current Survey Page: TimingResearch.com/currentsurvey
Any feedback: TimingResearch.com/contact
Email Alerts
Make sure you don’t miss all the future reports, show reminders, and bonus offers from TimingResearch, enter your email here:
By signing up you agree to receive newsletter and alert emails. You can unsubscribe at any time. Privacy Policies
NOTE: The following open-ended answers are solely the opinions of the anonymous respondents to this survey. Responses are mostly unedited, but some have been reformatted slightly for to make them easier to read. Some irrelevant responses (e.g. “none”), or anything obviously fake, or copy and pasted responses have been omitted. All-caps responses have been changed to all lowercase. All responses for each week, unedited, are available in the raw data spreadsheets at TimingResearch.com/data.
Question #3. For your answer to Question #1, please share what specific reason(s) you think the S&P500 will be heading the direction you chose.
“Higher” Respondent Answers:
• trend
• Bounce
• FED lowering interest rate
• wave 5 still finishing
• recently the S & P broke out of compression
• Momentum
• Market ready for a blow off when rates rise, Setup continues until rates rise blow off coming soon
• sideways move at highs before breaking to new highs
• momentum Fed anticipation internals
“Lower” Respondent Answers:
• Resistance area maybe more selling than buying
• travel too far too fast
• Chart top
• Oil issues middle east and other macroeconomic factors in Europe.
• The S&P 50-day MA is flattening, and the S&P is skirting near the top Bollinger band, which makes a short-time pop less likely. Also, dissent on the Fed may keep the FOMC statement from being dovish.
• Thursday high
• Profit booking may come in the next week
Partner Offer:
Question #4. What methods or techniques do you use to overcome the emotional aspects of trading?
• Have a fixed plan for long term investing
• daily chart
• 20 day. 50 day ma
• I STAY in my Comfort Zone
• sit and watch all my right analisys go to waste
• Oversold/overbought conditions
• back tested strategies and rules
• I am not all that successful at it but try to follow a plan
• Scotch on the Rocks!
Question #5. Additional Comments/Questions/Suggestions?
• i think i will like this page it is like having a trading buddy
• Gold stalls and begins to move higher
Join us for this week’s shows:
Crowd Forecast News Episode #238
This week’s show will feature a discussion with the trading experts listed below about the most recent TimingResearch Crowd Forecast Newsletter report, where they think the S&P500 is headed, what they are watching for in the markets currently, and their best trading idea.
Date and Time:
– Monday, September 16, 2019
– 1PM ET (10AM PT)
Moderator and Guests:
– Jake Bernstein of Trade-Futures.com
– Norman Hallett of TheDisciplinedTrader.com
– Mark Sachs of RightLineTrading.com
– Jim Kenney of OptionProfessor.com (moderator)
Analyze Your Trade Episode #94
When you register, you will be prompted to list the top 5 stocks that you are interested in trading. We will list the top 5 from all registrants and our experts will be prepared to offer their opinions on these trades.
Date and Time:
– Tuesday, September 17th, 2019
– 4PM ET (1PM PT)
Moderator and Guests:
– Felix Frey of OptionsGeek.com
– Jim Kenney of OptionProfessor.com (moderator)
Synergy Traders #3
For this event 5 amazing trading educators available to teach you about their top trading strategies. We are inviting you to spend the day learning top trading strategies from leading industry experts that will bring you closer to achieving your trading goals.
Date and Time:
– Saturday, September 21st, 2019
– 10AM ET (7AM PT)
Moderator and Guests:
– 10AM ET: Rob Smith of T3Live.com (first time guest!)
– 11AM ET: Jerremy Newsome of RealLifeTrading.com
– 12PM ET: Anka Metcalf of TradeOutLoud.com
– 1PM ET: Ryan Mallory of SharePlanner.com (first time guest!)
– 2PM ET: TBA
Crowd Forecast News Report #311
AD: How to Trade the Bobble Pattern (eBook)
The new TimingResearch report for the week has been posted, you can download the full PDF report with the link below or you can read the full report in this post below.
Click here to download report in PDF format: TRReport090819.pdf
Question #1. Which direction do you think the S&P500 index will move from this coming Monday’s open to Friday’s close (September 9th to 13th)?
The order of possible responses to this question on the survey were randomized for each viewer.)
Higher: 70.6%
Lower: 29.4%
Higher/Lower Difference: 41.2%
Question #2. Rate your confidence in your answer to Question #2 by estimating the probability you have correctly predicted next week’s market move.
Average of All Responses: 64.6%
Average For “Higher” Responses: 65.4%
Average For “Lower” Responses: 62.5%
Higher/Lower Difference: 2.9%
Responses Submitted This Week: 36
52-Week Average Number of Responses: 36.7
TimingResearch Crowd Forecast Prediction: 60% Chance Higher
This prediction is an attempt by the editor of this newsletter to use the full 5 year history of data collected from this project to forecast a probability estimate for whether this week’s sentiment is going to be correct and ultimately what the markets will do this coming week.
Details: Last week’s majority sentiment from the survey was 51.5% Lower, and the Crowd Forecast Indicator prediction was 62% Chance Higher; the S&P500 closed 2.40% Higher for the week. This week’s majority sentiment from the survey is 41.2% Higher with a greater average confidence from those who responded Higher. Similar conditions have occurred 62 times in the previous 310 weeks, with the majority sentiment (Higher) being correct 60% of the time and with an average S&P500 move of 0.10% Higher for the week. Based on that history, the TimingResearch Crowd Forecast Indicator is forecasting a 60% Chance that the S&P500 is going to move Higher this coming week.
Raw Data Page (raw data files include full history spreadsheet and the above charts):
TimingResearch.com/data.
AD: How to Trade the Bobble Pattern (eBook)
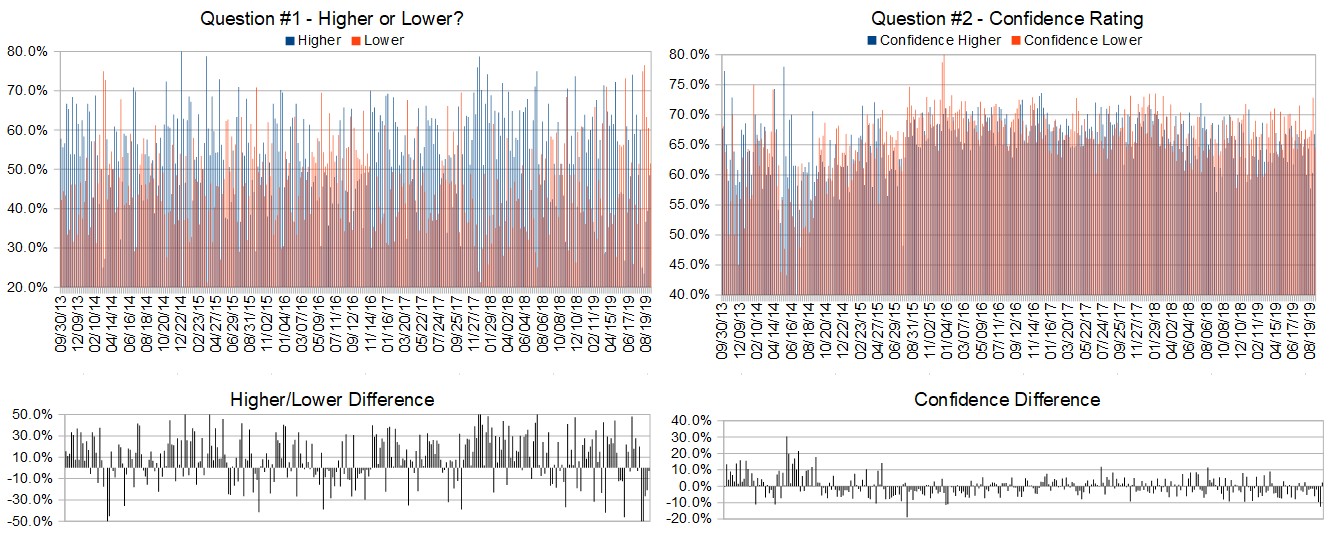
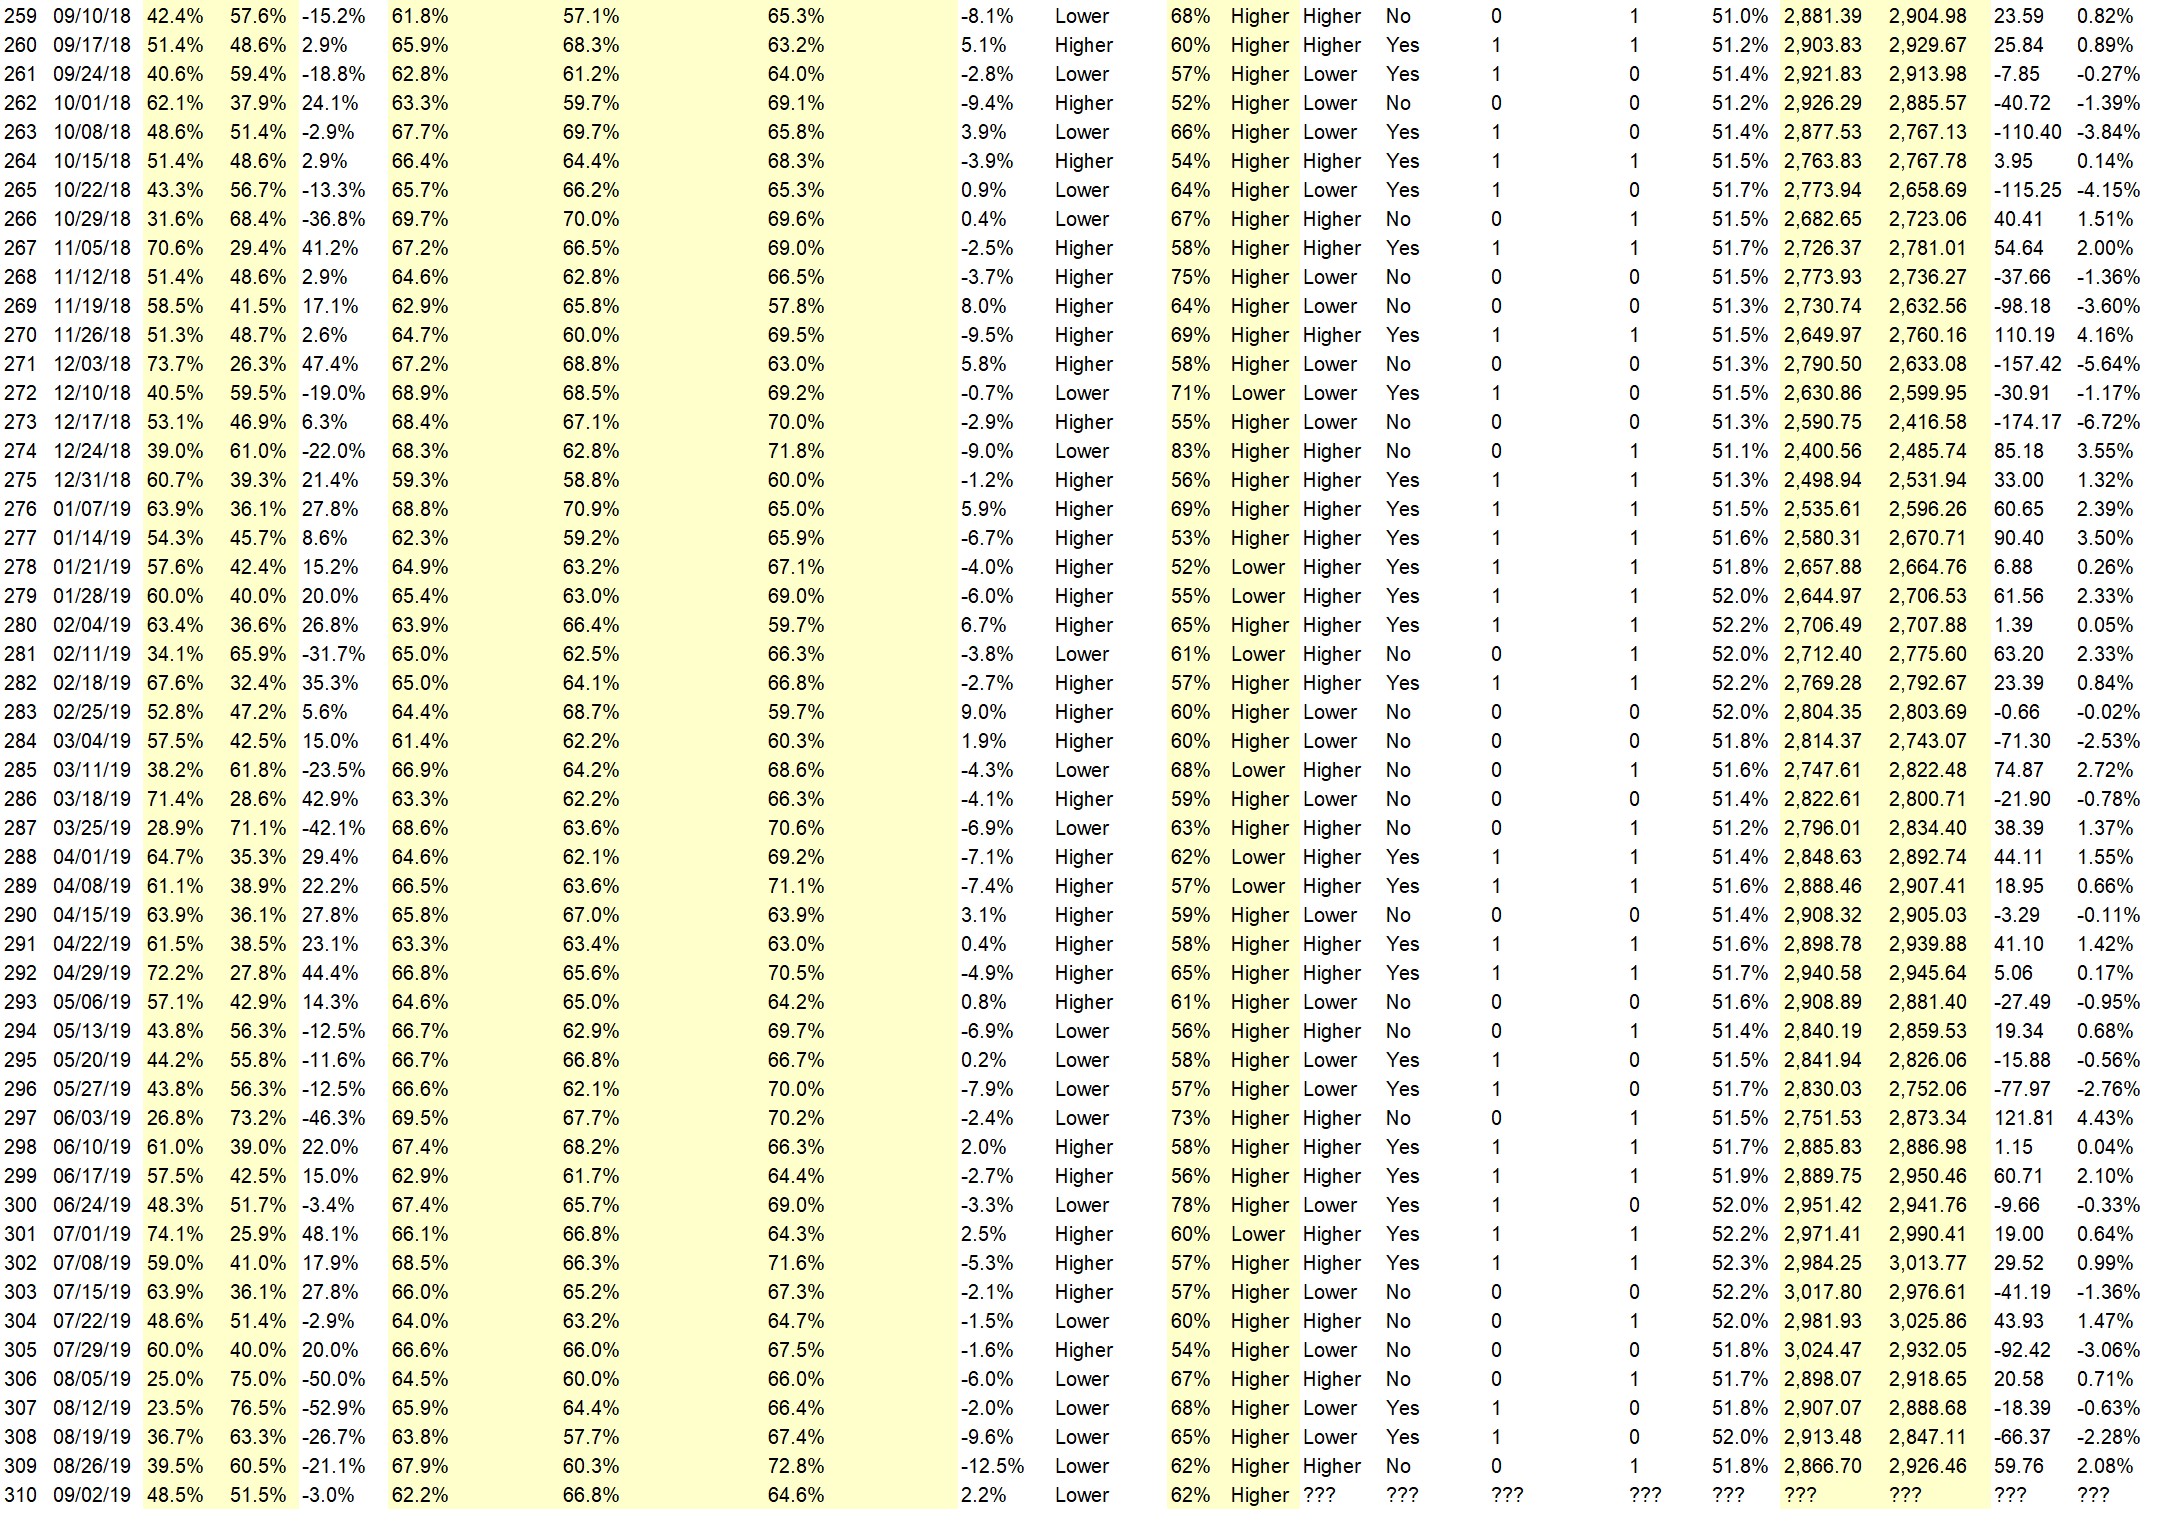
Full Weekly Results (full version of this chart available in the raw data spreadsheet for this week, “Date” field below lists the Monday of the week being predicted).
Overall Sentiment All-Time “Correct” Percentage: 51.6%
Overall Sentiment 52-Week “Correct” Percentage: 54.9%
Overall Sentiment 12-Week “Correct” Percentage: 45.5%
Only the previous 52 weeks of data are shown below, please download the raw data to see the full range of past data.
Weekly Reports Page: TimingResearch.com/reports
Raw Data Page: TimingResearch.com/rawdata
Current Survey Page: TimingResearch.com/currentsurvey
Any feedback: TimingResearch.com/contact
Email Alerts
Make sure you don’t miss all the future reports, show reminders, and bonus offers from TimingResearch, enter your email here:
By signing up you agree to receive newsletter and alert emails. You can unsubscribe at any time. Privacy Policies
NOTE: The following open-ended answers are solely the opinions of the anonymous respondents to this survey. Responses are mostly unedited, but some have been reformatted slightly for to make them easier to read. Some irrelevant responses (e.g. “none”), or anything obviously fake, or copy and pasted responses have been omitted. All-caps responses have been changed to all lowercase. All responses for each week, unedited, are available in the raw data spreadsheets at TimingResearch.com/data.
Question #3. For your answer to Question #1, please share what specific reason(s) you think the S&P500 will be heading the direction you chose.
“Higher” Respondent Answers:
• Institutional Money Managers
• China trade talks should fuel rally
• Bull close today
• Good 4 all
• Theo Trade, VectorVest, Top Gun Options, DTI, Chaikin Analytics , Market Guage, Market Beat, Market Chameleon,
• On D,W,M TF is price above 50 SMA. This week price reaches record high.
• no clue
• Fed to cut rate / Trade talks with China
• weekly wave5 continues
• day and H4 RSI long
• The momentum favors more upside, although it may be a sideways week with upward bias.
• FED WILL cut
• test the highs
• Momentum is with the Bulls
• It broke out to the up
• Hard question. I would risk no more than 1%.
• FED/FOMC drooling
“Lower” Respondent Answers:
• at a reversal point
• Technical analysis
• china will be complaining about the tariff and the hongkong rioting will get worse
• Mkt was up last week
• closing gaps
• Smart money leaving market
• Divergences all over the place
AD: How to Trade the Bobble Pattern (eBook)
Question #4. What indicator influences your trading the most?
• dow industrial
• Interest rates
• todays bull moving a erage ob the SP 500
• Gut
• EMA , Chaikin Money Flow, On Balance, RSI, MACD, S/R , Keltner Channel
• News
• MA, CCI
• rsi and macd overbought
• News, Economic reports, and unfortunately, our crazy gov’t actions.
• Proprietary
• Vantagepoint
• Comparing fast and slow stochastics comparing fast and slow MACD
• 50, 100, 200 MA
• price action
• Approaching election year.
• RSI and price action
• Channels, MACD
• MACD
• Custom
• Rsi
Question #5. Additional Comments/Questions/Suggestions?
• Sell gold (NUGT)
• Gold & Silver pulled back last week., will stabilize this week and start a move back up.
AD: How to Trade the Bobble Pattern (eBook)
Join us for this week’s shows:
Crowd Forecast News Episode #237
This week’s show will feature a discussion with the trading experts listed below about the most recent TimingResearch Crowd Forecast Newsletter report, where they think the S&P500 is headed, what they are watching for in the markets currently, and their best trading idea.
Date and Time:
– Monday, September 9th, 2019
– 1PM ET (10AM PT)
Moderator and Guests:
– Jake Wujastyk of TrendSpider.com
– Erik Gebhard of Altavest.com
– Anka Metcalf of TradeOutLoud.com
– Jim Kenney of OptionProfessor.com (moderator)
Analyze Your Trade Episode #93
When you register, you will be prompted to list the top 5 stocks that you are interested in trading. We will list the top 5 from all registrants and our experts will be prepared to offer their opinions on these trades.
Date and Time:
– Tuesday, September 10th, 2019
– 4PM ET (1PM PT)
Moderator and Guests:
– Larry Gaines of PowerCycleTrading.com
– Jim Kenney of OptionProfessor.com (moderator)
AD: How to Trade the Bobble Pattern (eBook)
Crowd Forecast News Report #310
Tuesday: Join first-time guest Harry Boxer on AYT #92!
The new TimingResearch report for the week has been posted, you can download the full PDF report with the link below or you can read the full report in this post below.
Click here to download report in PDF format: TRReport090219.pdf
Question #1. Which direction do you think the S&P500 index will move from this coming Tuesday’s open to Friday’s close (September 3rd to 6th)?
The order of possible responses to this question on the survey were randomized for each viewer.)
Higher: 48.5%
Lower: 51.5%
Higher/Lower Difference: -3.0%
Question #2. Rate your confidence in your answer to Question #2 by estimating the probability you have correctly predicted next week’s market move.
Average of All Responses: 62.2%
Average For “Higher” Responses: 66.8%
Average For “Lower” Responses: 64.6%
Higher/Lower Difference: 2.2%
Responses Submitted This Week: 36
52-Week Average Number of Responses: 36.7
TimingResearch Crowd Forecast Prediction: 62% Chance Higher
This prediction is an attempt by the editor of this newsletter to use the full 5 year history of data collected from this project to forecast a probability estimate for whether this week’s sentiment is going to be correct and ultimately what the markets will do this coming week.
Details: Last week’s majority sentiment from the survey was 60.5% Lower, and the Crowd Forecast Indicator prediction was 62% Chance Higher; the S&P500 closed 2.08% Lower for the week. This week’s majority sentiment from the survey is 51.5% Lower with a greater average confidence from those who responded Higher. Similar conditions have occurred 39 times in the previous 309 weeks, with the majority sentiment (Lower) being correct only 38% of the time and with an average S&P500 move of 0.02% Lower for the week. Based on that history, the TimingResearch Crowd Forecast Indicator is forecasting a 62% Chance that the S&P500 is going to move Higher this coming week.
Raw Data Page (raw data files include full history spreadsheet and the above charts):
TimingResearch.com/data.
Tuesday: Join first-time guest Harry Boxer on AYT #92!
Full Weekly Results (full version of this chart available in the raw data spreadsheet for this week, “Date” field below lists the Monday of the week being predicted).
Overall Sentiment All-Time “Correct” Percentage: 51.8%
Overall Sentiment 52-Week “Correct” Percentage: 54.9%
Overall Sentiment 12-Week “Correct” Percentage: 54.5%
Only the previous 52 weeks of data are shown below, please download the raw data to see the full range of past data.
Weekly Reports Page: TimingResearch.com/reports
Raw Data Page: TimingResearch.com/rawdata
Current Survey Page: TimingResearch.com/currentsurvey
Any feedback: TimingResearch.com/contact
Email Alerts
Make sure you don’t miss all the future reports, show reminders, and bonus offers from TimingResearch, enter your email here:
By signing up you agree to receive newsletter and alert emails. You can unsubscribe at any time. Privacy Policies
NOTE: The following open-ended answers are solely the opinions of the anonymous respondents to this survey. Responses are mostly unedited, but some have been reformatted slightly for to make them easier to read. Some irrelevant responses (e.g. “none”), or anything obviously fake, or copy and pasted responses have been omitted. All-caps responses have been changed to all lowercase. All responses for each week, unedited, are available in the raw data spreadsheets at TimingResearch.com/data.
Question #3. For your answer to Question #1, please share what specific reason(s) you think the S&P500 will be heading the direction you chose.
“Higher” Respondent Answers:
• I answered higher because we are still in a bull move. The trend will continue til it is over. My confidence is, however, declining for I am thinking this bull is getting old and tired.
• gold, copper, transportation, XLF, FANGS, FXI, and more. 4 months and all hell will break loose
• Chart readings
• respite from trade war dialogue
• bounce
• higher lows
• Market still being pumped up
• A big sell may create a low but ultimately higher than last week
• Mkt is range bound with a move higher a probability. Trump must by now have realised his tariff tweets only damage the mkts.
“Lower” Respondent Answers:
• Seasonality and inversion yield curve.
• We’re not done yet
• trade war
• downward flag pattern
• s/p-below the 50ma above 200ma-sideways -trend
• Trump’s tweets about trade war
• The market is overbought again at the top of the trading range. There needs to be some back and filling.
• The market is near the top of its August box range. There’s nothing I can think of to propel the market above that box at this time.
• The minute charts are very OB…
• Fear & Greed Index still showing extreme fear so investors less likely to take risks.
Tuesday: Join first-time guest Harry Boxer on AYT #92!
Question #4. What trading-related questions or topics would you like the experts to discuss on future episodes of the weekly Crowd Forecast News show and/or which experts would you like to see on the show who haven’t been guests yet? (The show is off this coming week the market holiday, but back on September 9th.)
• What favourite tools do you use to help confirm a change in trend? How many price bars in the opposite direction do you look for til you decide the trend may be changing?
• Next market decline
• What is the best indicator for pickig tops and bottoms
Question #5. Additional Comments/Questions/Suggestions?
• none
Join us for this week’s shows:
Analyze Your Trade Episode #92
When you register, you will be prompted to list the top 5 stocks that you are interested in trading. We will list the top 5 from all registrants and our experts will be prepared to offer their opinions on these trades.
Date and Time:
– Tuesday, September 3rd, 2019
– 4PM ET (1PM PT)
Moderator and Guests:
– Jim Kenney of OptionProfessor.com (moderator)
– Harry Boxer of TheTechTrader.com (first time guest!)
Crowd Forecast News Episode #237
This week’s show will feature a discussion with the trading experts listed below about the most recent TimingResearch Crowd Forecast Newsletter report, where they think the S&P500 is headed, what they are watching for in the markets currently, and their best trading idea.
Date and Time:
– Monday, September 9th, 2019
– 1PM ET (10AM PT)
Moderator and Guests:
– TBA
Tuesday: Join first-time guest Harry Boxer on AYT #92!
Crowd Forecast News Report #309
AD: Need more capital to trade? Click for Futures or Forex.
The new TimingResearch report for the week has been posted, you can download the full PDF report with the link below or you can read the full report in this post below.
Click here to download report in PDF format: TRReport082519.pdf
Question #1. Which direction do you think the S&P500 index will move from this coming Monday’s open to Friday’s close (August 26th to 30th)?
The order of possible responses to this question on the survey were randomized for each viewer.)
Higher: 39.5%
Lower: 60.5%
Higher/Lower Difference: -21.1%
Question #2. Rate your confidence in your answer to Question #2 by estimating the probability you have correctly predicted next week’s market move.
Average of All Responses: 67.9%
Average For “Higher” Responses: 60.3%
Average For “Lower” Responses: 72.8%
Higher/Lower Difference: -12.5%
Responses Submitted This Week: 38
52-Week Average Number of Responses: 36.7
TimingResearch Crowd Forecast Prediction: 62% Chance Higher
This prediction is an attempt by the editor of this newsletter to use the full 5 year history of data collected from this project to forecast a probability estimate for whether this week’s sentiment is going to be correct and ultimately what the markets will do this coming week.
Details: Last week’s majority sentiment from the survey was 63.3% Lower, and the Crowd Forecast Indicator prediction was 65% Chance Higher; the S&P500 closed 2.28% Lower for the week. This week’s majority sentiment from the survey is 60.5% Lower with a greater average confidence from those who responded Lower. Similar conditions have occurred 21 times in the previous 308 weeks, with the majority sentiment (Lower) being correct only 38% of the time and with an average S&P500 move of 0.32% Higher for the week. Based on that history, the TimingResearch Crowd Forecast Indicator is forecasting a 62% Chance that the S&P500 is going to move Higher this coming week.
Raw Data Page (raw data files include full history spreadsheet and the above charts):
TimingResearch.com/data.
Full Weekly Results (full version of this chart available in the raw data spreadsheet for this week, “Date” field below lists the Monday of the week being predicted).
Overall Sentiment All-Time “Correct” Percentage: 52.0%
Overall Sentiment 52-Week “Correct” Percentage: 56.9%
Overall Sentiment 12-Week “Correct” Percentage: 63.6%
Only the previous 52 weeks of data are shown below, please download the raw data to see the full range of past data.
Weekly Reports Page: TimingResearch.com/reports
Raw Data Page: TimingResearch.com/rawdata
Current Survey Page: TimingResearch.com/currentsurvey
Any feedback: TimingResearch.com/contact
Email Alerts
Make sure you don’t miss all the future reports, show reminders, and bonus offers from TimingResearch, enter your email here:
By signing up you agree to receive newsletter and alert emails. You can unsubscribe at any time. Privacy Policies
NOTE: The following open-ended answers are solely the opinions of the anonymous respondents to this survey. Responses are mostly unedited, but some have been reformatted slightly for to make them easier to read. Some irrelevant responses (e.g. “none”), or anything obviously fake, or copy and pasted responses have been omitted. All-caps responses have been changed to all lowercase. All responses for each week, unedited, are available in the raw data spreadsheets at TimingResearch.com/data.
Question #3. For your answer to Question #1, please share what specific reason(s) you think the S&P500 will be heading the direction you chose.
“Higher” Respondent Answers:
• Functional QE and strength of the dollar.
• Republican victory in votes counted i read alot more than Democrates
• Markets are oversold
• I think it would go up providing Trump does not say anything stupid this week, like attack the Head of the Federal Reserve or does something different with China
• flushing out the weak hands in a countertrend rally
• 2 try in the weekly chart
• down today
• up week reprieve from down market
• It came down to solid support area and will bounce, unless their is some news to spark the market up, it will not hold..
• tariffs actually impact very little of the overall economy – which is still doing well
• Many time studies and cycles culminate next week so there is going to be highs and lows.
“Lower” Respondent Answers:
• Friday’s fall tariff tweets
• Alignments & Technical Analysis.
• Many sessions it reached Resistance level but couldn’t able to sustain this may lead to break the long term support level 282 eventually in this week.
• tariffs
• RSI from the daily chart and lower are all negative and the weekly is one move away to going south also
• Trade war with China, Recession fears, chart patterns.
• lower lows ..breached spx 2850 on close seems to be headung to spx 2821 .
• The downside correction is accelerating. As long as Trump keeps playing chicken with the Chinese, the market and the economy will continue to falter.
• Market is too high for the expected growth rate of 2.0% for 2nd half of 2019. Tariff nonsense will hurt. Market’s failure to move above 50-day avg last week, along with Friday’s drop, suggests continued dropping, with next major support around 2600.
• Summit won’t produce results. France is stirring up the pot and Japan trade isn’t final
• Fridays tweets WAR is 0n China winning means escalation imminent
• Trade war finally effects market
• Chevron was happy to get here the first time, less so now.
• US – China comercial war!
• Too much uncertainty to cause much of a rally.
• major support broken
AD: Need more capital to trade? Click for Futures or Forex.
Question #4. What sort of hedging or portfolio protection strategies do you implement in your trading?
• secret ones
• Preset ATM to manage trades.
• inverse etf,s such as TZA–SDS-SDOW–SQQQ. VXX weekly calls ,as now i have the VXX 30.00 calls expiry 8 days ,10 contracts.
• I sell
• selling puts/calls
• Sell stay out track favorite stocks buy in on selling climax
• Covered call writing.
• Option spreads
• only tade pullbacks
• Alignments & Technical Analysis.
• Gold/ Silver/ small cap miners
• take my stops and close out postns
• position sizing
• sell covered calks at market
• Use options to limit exposure
• SDS
• none at this time, I do have one hedging account offshore.
• Very little being max intraday action or rarely overnight due to sudden upheaval
Question #5. Additional Comments/Questions/Suggestions?
• do you know of any good automated algo type trading system ,you can reccommend.
• Buy Gold & Silver and a lot of it, mines, stocks, etc..
• I don’t like holding overnight right now..
• As long as we have a weak mind as potus we can have swings in economy and markets
• why can’t my confidence level be below 50%?
TimingResearch Response: It’s a binary choice, Higher or Lower. If you have less than a 50% confidence that the S&P500 is going to move Higher, then you should select Lower. A 30% chance that the index is going to move Higher is the same as a 70% chance that the index is going to move Lower.
Join us for this week’s shows:
Crowd Forecast News Episode #
This week’s show will feature a discussion with the trading experts listed below about the most recent TimingResearch Crowd Forecast Newsletter report, where they think the S&P500 is headed, what they are watching for in the markets currently, and their best trading idea.
Date and Time:
– Monday, August 26th, 2019
– 1PM ET (10AM PT)
Moderator and Guests:
– Mark Sachs of RightLineTrading.com
– Jake Bernstein of Trade-Futures.com
– Michael Filighera of LogicalSignals.com
– Jim Kenney of OptionProfessor.com (moderator)
Analyze Your Trade Episode #
When you register, you will be prompted to list the top 5 stocks that you are interested in trading. We will list the top 5 from all registrants and our experts will be prepared to offer their opinions on these trades.
Date and Time:
– Tuesday, August 27th, 2019
– 4PM ET (1PM PT)
Moderator and Guests:
– E. Matthew “Whiz” Buckley of TopGunOptions.com
– Jim Kenney of OptionProfessor.com (moderator)
Crowd Forecast News Report #308
AD: A “hidden” trade setup finally revealed.
The new TimingResearch report for the week has been posted, you can download the full PDF report with the link below or you can read the full report in this post below.
Click here to download report in PDF format: TRReport081819.pdf
Question #1. Which direction do you think the S&P500 index will move from this coming Monday’s open to Friday’s close (August 19th to 23rd)?
The order of possible responses to this question on the survey were randomized for each viewer.)
Higher: 36.7%
Lower: 63.3%
Higher/Lower Difference: -26.7%
Question #2. Rate your confidence in your answer to Question #2 by estimating the probability you have correctly predicted next week’s market move.
Average of All Responses: 63.8%
Average For “Higher” Responses: 57.7%
Average For “Lower” Responses: 67.4%
Higher/Lower Difference: -9.6%
Responses Submitted This Week: 32
52-Week Average Number of Responses: 36.7
TimingResearch Crowd Forecast Prediction: 65% Chance Higher
This prediction is an attempt by the editor of this newsletter to use the full 5 year history of data collected from this project to forecast a probability estimate for whether this week’s sentiment is going to be correct and ultimately what the markets will do this coming week.
Details: Last week’s majority sentiment from the survey was 76.5% Lower, and the Crowd Forecast Indicator prediction was 68% Chance Higher; the S&P500 closed 0.63% Higher for the week. This week’s majority sentiment from the survey is 63.3% Lower with a greater average confidence from those who responded Lower. Similar conditions have occurred 20 times in the previous 307 weeks, with the majority sentiment (Lower) being correct only 35% of the time and with an average S&P500 move of 0.45% Higher for the week. Based on that history, the TimingResearch Crowd Forecast Indicator is forecasting a 65% Chance that the S&P500 is going to move Higher this coming week.
Raw Data Page (raw data files include full history spreadsheet and the above charts):
TimingResearch.com/data.
Full Weekly Results (full version of this chart available in the raw data spreadsheet for this week, “Date” field below lists the Monday of the week being predicted).
Overall Sentiment All-Time “Correct” Percentage: 51.8%
Overall Sentiment 52-Week “Correct” Percentage: 56.9%
Overall Sentiment 12-Week “Correct” Percentage: 54.5%
Only the previous 52 weeks of data are shown below, please download the raw data to see the full range of past data.
Weekly Reports Page: TimingResearch.com/reports
Raw Data Page: TimingResearch.com/rawdata
Current Survey Page: TimingResearch.com/currentsurvey
Any feedback: TimingResearch.com/contact
Email Alerts
Make sure you don’t miss all the future reports, show reminders, and bonus offers from TimingResearch, enter your email here:
By signing up you agree to receive newsletter and alert emails. You can unsubscribe at any time. Privacy Policies
NOTE: The following open-ended answers are solely the opinions of the anonymous respondents to this survey. Responses are mostly unedited, but some have been reformatted slightly for to make them easier to read. Some irrelevant responses (e.g. “none”), or anything obviously fake, or copy and pasted responses have been omitted. All-caps responses have been changed to all lowercase. All responses for each week, unedited, are available in the raw data spreadsheets at TimingResearch.com/data.
Question #3. For your answer to Question #1, please share what specific reason(s) you think the S&P500 will be heading the direction you chose.
“Higher” Respondent Answers:
• Tate Reeves
• mt chart bullishnes
• Trump
• Where else can one earn a return?
• Correction over?
“Lower” Respondent Answers:
• Economic uncertainty, trend
• Tariffs
• Long term moving averages and my cycle analysis.
• Unrest in Hong Kong gets hotter and China’s reaction spooks the markets
• Timing cycles Elliot Wave
• Elliott wave correction on the one hour chart
• retrace wave 5
• Looking for the S&P to hit resistance by Wed, then reverse to down. There’s a negative divergence with the MACD.
• Market top last week Will m0ve side to side
• Bonds are inverted, the market will fail for sure, Band-Aids will not hold it up. Gold & Silver will raise and people will rush to pull money out and find safety in Gold. More and more money is leaving the market. Billion dollar funds don’t know what to do as too much tied up in stocks, slowly , very slowly their liquidating positions before the major fall appears.
• Trade war is not stoped
• Technical analysis shows a dip mid week.
• Daily RSI is heading lower and below the 50 level, the weekly RSI is compressing to go lower. On an H4 chart, we just came off a double top. Unless news moves it higher, we are going lower this week.
• downleg looks invomplete
AD: A “hidden” trade setup finally revealed.
Question #4. What styles of trading or methodologies have you had the most success with?
• Technical
• Long term dollar cost averaging
• Coffee can
• Long term DCA
• History
• Trend trading/following
• Fundao
• both listed above.
• Skimming very short term trades
• Shorter term (1-3 day) trades seem to do better for me than other holding periods.
• selling covered calkes
• Pattern trading and Multi time frame following the RSI.
• pull backs
Question #5. Additional Comments/Questions/Suggestions?
• Wish everyone great success and suggest find Gold where you can more sooner…..
• Don’t get married to one direction, be nimble.
AD: A “hidden” trade setup finally revealed.
Join us for this week’s shows:
Crowd Forecast News Episode #235
This week’s show will feature a discussion with the trading experts listed below about the most recent TimingResearch Crowd Forecast Newsletter report, where they think the S&P500 is headed, what they are watching for in the markets currently, and their best trading idea.
Date and Time Released:
– Monday, August 18th, 2019
– 3PM ET (12PM PT)
Moderator and Guests:
– Felix Frey of OptionsGeek.com (first time guest!)
– Jake Bernstein of Trade-Futures.com
– Michael Guess of DayTradeSafe.com
– Mark Sachs of RightLineTrading.com
– Jim Kenney of OptionProfessor.com (moderator)
Analyze Your Trade Episode #90
When you register, you will be prompted to list the top 5 stocks that you are interested in trading. We will list the top 5 from all registrants and our experts will be prepared to offer their opinions on these trades.
Date and Time Released:
– Tuesday, August 19th, 2019
– 6PM ET (3PM PT)
Moderator and Guests:
– Jim Kenney of OptionProfessor.com (moderator)
AD: A “hidden” trade setup finally revealed.
Crowd Forecast News Report #307
AD: A “hidden” trade setup finally revealed.
The new TimingResearch report for the week has been posted, you can download the full PDF report with the link below or you can read the full report in this post below.
Click here to download report in PDF format: TRReport081119.pdf
Question #1. Which direction do you think the S&P500 index will move from this coming Monday’s open to Friday’s close (August 12th to 16th)?
The order of possible responses to this question on the survey were randomized for each viewer.)
Higher: 23.5%
Lower: 76.5%
Higher/Lower Difference: -52.9%
Question #2. Rate your confidence in your answer to Question #2 by estimating the probability you have correctly predicted next week’s market move.
Average of All Responses: 65.9%
Average For “Higher” Responses: 64.4%
Average For “Lower” Responses: 66.4%
Higher/Lower Difference: -2.0%
Responses Submitted This Week: 35
52-Week Average Number of Responses: 36.9
TimingResearch Crowd Forecast Prediction: 68% Chance Higher
This prediction is an attempt by the editor of this newsletter to use the full 5 year history of data collected from this project to forecast a probability estimate for whether this week’s sentiment is going to be correct and ultimately what the markets will do this coming week.
Details: Last week’s majority sentiment from the survey was 75.0% Lower, and the Crowd Forecast Indicator prediction was 67% Chance Higher; the S&P500 closed 0.71% Higher for the week. This week’s majority sentiment from the survey is 76.5% Lower with a greater average confidence from those who responded Lower (for the 2nd week in a row, this is the highest ever percentage of respondents predicting Lower in the history of this survey). Similar conditions have occurred 19 times in the previous 306 weeks, with the majority sentiment (Lower) being correct only 32% of the time and with an average S&P500 move of 0.51% Higher for the week. Based on that history, the TimingResearch Crowd Forecast Indicator is forecasting a 68% Chance that the S&P500 is going to move Higher this coming week.
Raw Data Page (raw data files include full history spreadsheet and the above charts):
TimingResearch.com/data.
AD: A “hidden” trade setup finally revealed.
Full Weekly Results (full version of this chart available in the raw data spreadsheet for this week, “Date” field below lists the Monday of the week being predicted).
Overall Sentiment All-Time “Correct” Percentage: 51.7%
Overall Sentiment 52-Week “Correct” Percentage: 56.9%
Overall Sentiment 12-Week “Correct” Percentage: 54.5%
Only the previous 52 weeks of data are shown below, please download the raw data to see the full range of past data.
Weekly Reports Page: TimingResearch.com/reports
Raw Data Page: TimingResearch.com/rawdata
Current Survey Page: TimingResearch.com/currentsurvey
Any feedback: TimingResearch.com/contact
Email Alerts
Make sure you don’t miss all the future reports, show reminders, and bonus offers from TimingResearch, enter your email here:
By signing up you agree to receive newsletter and alert emails. You can unsubscribe at any time. Privacy Policies
NOTE: The following open-ended answers are solely the opinions of the anonymous respondents to this survey. Responses are mostly unedited, but some have been reformatted slightly for to make them easier to read. Some irrelevant responses (e.g. “none”), or anything obviously fake, or copy and pasted responses have been omitted. All-caps responses have been changed to all lowercase. All responses for each week, unedited, are available in the raw data spreadsheets at TimingResearch.com/data.
Question #3. For your answer to Question #1, please share what specific reason(s) you think the S&P500 will be heading the direction you chose.
“Higher” Respondent Answers:
• A crisis was averted rates are low nowhere else for money to go as bonds are t00 l0w
• Republican primary
• History
“Lower” Respondent Answers:
• Due to the tariffs imposed to China and President Trumps’ extension to China there is no telling which way the market will go. I play the SPY only with calls and puts and personally I don’t care which way the market goes.
• Heading into minor then major pullback
• Need to keep the public scared for a longer period of time than usual! Funnel top formation on monthly chart, weak Andrew’s pitchfork reaction on weekly chart and 50% retrace on daily! Long-term much higher because of hyperinflation by the world central banks! XRP, USLV, DBA and BRZU all will appreciate hundreds of percent long-term, while using leverage well over a thousand percent!
• I am evenly divided at 50%. Currently, uptrend on the hourly time frame Index charts, but neutral to lower on the daily over the next week
• tech analysis
• S&P to much high
• charts show further correction and seasonal rise not till october
• seasonality
• 200 day sma should be tested
• return to end of wave 4
• The downside correction continues. More pain and suffering needed to complete the final flush.
• Down move overdue.
• The move down that ended on Aug 5 was on the highest volume of 2019. This appears to be the primary trend. The current bounce could establish a lower high soon.
• erratic movement
• It finally may be that time where traders and investers may have begun to question the loftiness of the stock market and realize an adjustment downward is the only realistic trend setting up. Now, if only D Trump would stop trying to manipulate the market higher. Past efforts on his part are beginning to backfire because for all his exxagerated claims, you simply can’t trust anything he says and all he ends up doing is setting the market up to correct ever so often. Investor’s are wising up
• Last week action market rotation will continue until next FED cut
• DCB over
• Consolidation then a fall at the end of the week
• general risk-on conditions
• We were left at an inflection point last Friday. Daily RSI is falling, H4 RSI was the retrace last week. As the H4 RSI turns lower the same direction as the Daily we will head lower with more speed in Price action
• bear trap, divergence in market internalj
AD: A “hidden” trade setup finally revealed.
Question #4. Which trading platforms or brokers do you like the best for executing your trades?
• TC 2000
• USAA & Fidelity
• TOS
• Lightspeed
• MT4
• Etrade
• saxo
• my UK CFD provider ADM who provide me with the Fidessa platform
• tradestation
• Ninja trader 8
• ThinkorSwim
• IB
• Trade Dystion
• Lightspeed
• Oanda Capital Gain FXChoice GFF Brokers
• E*trade for the win!!!
• Fidelity, USAA
• TOS, mt4, IcMarkets, E*trade, FxGlory, ExpertOptions, Saigon Securities, Evolve.Markets, CryptoGt.
• E-Trade
Question #5. Additional Comments/Questions/Suggestions?
• Have great weekend.
• nil
• i like protective puts on all buys of stock
• Don’t forget to look at the larger picture, like the weekly charts. It is easy to run in the smaller time frames and get the rug pulled out from you.
• none
AD: A “hidden” trade setup finally revealed.
Join us for this week’s shows:
Crowd Forecast News Episode #234
This week’s show will feature a discussion with the trading experts listed below about the most recent TimingResearch Crowd Forecast Newsletter report, where they think the S&P500 is headed, what they are watching for in the markets currently, and their best trading idea.
Date and Time:
– Monday, August 12th, 2019
– 1PM ET (10AM PT)
Moderator and Guests:
– Jake Wujastyk of TrendSpider.com (first time guest!)
– Jeffrey Hirsch of StockTradersAlmanac.com (first time guest!)
– Erik Gebhard of Altavest.com
– Anka Metcalf of TradeOutLoud.com
– Jim Kenney of OptionProfessor.com (moderator)
Analyze Your Trade Episode #89
When you register, you will be prompted to list the top 5 stocks that you are interested in trading. We will list the top 5 from all registrants and our experts will be prepared to offer their opinions on these trades.
Date and Time:
– Tuesday, August 13th, 2019
– 4PM ET (1PM PT)
Moderator and Guests:
– Jim Kenney of OptionProfessor.com (moderator)
AD: A “hidden” trade setup finally revealed.
Crowd Forecast News Report #306
AD: Need more capital to trade? Click for Futures or Forex.
The new TimingResearch report for the week has been posted, you can download the full PDF report with the link below or you can read the full report in this post below.
Click here to download report in PDF format: TRReport080419.pdf
Question #1. Which direction do you think the S&P500 index will move from this coming Monday’s open to Friday’s close (August 5th to 9th)?
The order of possible responses to this question on the survey were randomized for each viewer.)
Higher: 25.0%
Lower: 75.0%
Higher/Lower Difference: -50.0%
Question #2. Rate your confidence in your answer to Question #2 by estimating the probability you have correctly predicted next week’s market move.
Average of All Responses: 64.5%
Average For “Higher” Responses: 60.0%
Average For “Lower” Responses: 66.0%
Higher/Lower Difference: -6.0%
Responses Submitted This Week: 33
52-Week Average Number of Responses: 37.0
TimingResearch Crowd Forecast Prediction: 67% Chance Higher
This prediction is an attempt by the editor of this newsletter to use the full 5 year history of data collected from this project to forecast a probability estimate for whether this week’s sentiment is going to be correct and ultimately what the markets will do this coming week.
Details: Last week’s majority sentiment from the survey was 60.0% Higher, and the Crowd Forecast Indicator prediction was 54% Chance Higher; the S&P500 closed 3.06% Lower for the week. This week’s majority sentiment from the survey is 75.0% Lower with a greater average confidence from those who responded Lower (this is the highest ever percentage of respondents predicting Lower in the history of this survey). Similar conditions have occurred 18 times in the previous 305 weeks, with the majority sentiment (Lower) being correct only 33% of the time and with an average S&P500 move of 0.49% Higher for the week. Based on that history, the TimingResearch Crowd Forecast Indicator is forecasting a 67% Chance that the S&P500 is going to move Higher this coming week.
Raw Data Page (raw data files include full history spreadsheet and the above charts):
TimingResearch.com/data.
Full Weekly Results (full version of this chart available in the raw data spreadsheet for this week, “Date” field below lists the Monday of the week being predicted).
Overall Sentiment All-Time “Correct” Percentage: 51.8%
Overall Sentiment 52-Week “Correct” Percentage: 56.9%
Overall Sentiment 12-Week “Correct” Percentage: 63.6%
Only the previous 52 weeks of data are shown below, please download the raw data to see the full range of past data.
Weekly Reports Page: TimingResearch.com/reports
Raw Data Page: TimingResearch.com/rawdata
Current Survey Page: TimingResearch.com/currentsurvey
Any feedback: TimingResearch.com/contact
Email Alerts
Make sure you don’t miss all the future reports, show reminders, and bonus offers from TimingResearch, enter your email here:
By signing up you agree to receive newsletter and alert emails. You can unsubscribe at any time. Privacy Policies
NOTE: The following open-ended answers are solely the opinions of the anonymous respondents to this survey. Responses are mostly unedited, but some have been reformatted slightly for to make them easier to read. Some irrelevant responses (e.g. “none”), or anything obviously fake, or copy and pasted responses have been omitted. All-caps responses have been changed to all lowercase. All responses for each week, unedited, are available in the raw data spreadsheets at TimingResearch.com/data.
Question #3. For your answer to Question #1, please share what specific reason(s) you think the S&P500 will be heading the direction you chose.
“Higher” Respondent Answers:
• mkt is still in uptrend
• all chater
• a reversal, many good buys
• Because of over reaction of news
• my own technical analysis statitstics
“Lower” Respondent Answers:
• Trade war increasing intensity and Trump fans the flames until China responds.
• Reverse from the top of the megaphone trend line will continue
• Dip, economic uncertainty, VIX
• normal contraction in the march upward
• Momentum
• Re-trenchment
• wave 5 finished
• The downside correction started this week and will continue for at least one more week.
• August is the start of ‘crash season.’
• The recent move down was on expanded volume. Trade war with China will hurt consumer sector, with no US-China settlement in sight. Projecting S&P down to 2800 or below before a bounce.
• Mood of the nation
• Major top this week Aug is a bad month, Major market top last week + August bad m0nth for market
• reset
• There seems to be a trend in place. Could be the summer slowdown is starting.
• Trump
• Daily RSI has crossed lower
• huge drop in momentum broken support
AD: Need more capital to trade? Click for Futures or Forex.
Question #4. What procedures do you use for trade management? (e.g. position size, stops, scaling in or out, etc.)
• Position sizing
• only in stocks and will scale Out
• scaling in, trailing SL
• Trend , options of trend for stovks with good options
• Lost max. 2% of acc.size, trailing stop by 20 SMA
• initial stops / trailed stops; position size
• Position size
• For trading, usually equal amounts in several stocks.
• technical and fundamental position size, stops, entry and exit’s
• Loss mitigation
• position size, scaling in or out
• Positions size and dynamic exits
• position size and stop
• position sizing
• Stops
Question #5. Additional Comments/Questions/Suggestions?
• Keep records of why and trades.
Join us for this week’s shows:
Crowd Forecast News Episode #233
This week’s show will feature a discussion with the trading experts listed below about the most recent TimingResearch Crowd Forecast Newsletter report, where they think the S&P500 is headed, what they are watching for in the markets currently, and their best trading idea.
Date and Time:
– Monday, August 5th, 2019
– 1PM ET (10AM PT)
Moderator and Guests:
– John Thomas of MadHedgeFundTrader.com
– Jake Bernstein of Trade-Futures.com
Analyze Your Trade Episode #88
When you register, you will be prompted to list the top 5 stocks that you are interested in trading. We will list the top 5 from all registrants and our experts will be prepared to offer their opinions on these trades.
Date and Time:
– Tuesday, August 6th, 2019
– 4PM ET (1PM PT)
Moderator and Guests:
– Larry Gaines of PowerCycleTrading.com
– Mike Pisani of AlphaShark.com & SmartOptionTrading.com
Crowd Forecast News Report #305
AD: Need more capital to trade? Click for Futures or Forex.
The new TimingResearch report for the week has been posted, you can download the full PDF report with the link below or you can read the full report in this post below.
Click here to download report in PDF format: TRReport072819.pdf
Question #1. Which direction do you think the S&P500 index will move from this coming Monday’s open to Friday’s close (July 29th to August 2nd)?
The order of possible responses to this question on the survey were randomized for each viewer.)
Higher: 60.0%
Lower: 40.0%
Higher/Lower Difference: 20.0%
Question #2. Rate your confidence in your answer to Question #2 by estimating the probability you have correctly predicted next week’s market move.
Average of All Responses: 66.6%
Average For “Higher” Responses: 66.0%
Average For “Lower” Responses: 67.5%
Higher/Lower Difference: -1.6%
Responses Submitted This Week: 37
52-Week Average Number of Responses: 37.2
TimingResearch Crowd Forecast Prediction: 54% Chance Higher
This prediction is an attempt by the editor of this newsletter to use the full 5 year history of data collected from this project to forecast a probability estimate for whether this week’s sentiment is going to be correct and ultimately what the markets will do this coming week.
Details: Last week’s majority sentiment from the survey was 51.4% Lower, and the Crowd Forecast Indicator prediction was 60% Chance Higher; the S&P500 closed 1.47% Higher for the week. This week’s majority sentiment from the survey is 60.0% Higher with a greater average confidence from those who responded Lower. Similar conditions have occurred 37 times in the previous 304 weeks, with the majority sentiment (Higher) being correct 54% of the time and with an average S&P500 move of 0.14% Lower for the week (one of those rare conditions where the markets moved Higher more frequently but the overall average move was Lower). Based on that history, the TimingResearch Crowd Forecast Indicator is forecasting a 54% Chance that the S&P500 is going to move Higher this coming week.
Raw Data Page (raw data files include full history spreadsheet and the above charts):
TimingResearch.com/data.
AD: Need more capital to trade? Click for Futures or Forex.
Full Weekly Results (full version of this chart available in the raw data spreadsheet for this week, “Date” field below lists the Monday of the week being predicted).
Overall Sentiment All-Time “Correct” Percentage: 52.0%
Overall Sentiment 52-Week “Correct” Percentage: 56.9%
Overall Sentiment 12-Week “Correct” Percentage: 63.6%
Only the previous 52 weeks of data are shown below, please download the raw data to see the full range of past data.
Weekly Reports Page: TimingResearch.com/reports
Raw Data Page: TimingResearch.com/rawdata
Current Survey Page: TimingResearch.com/currentsurvey
Any feedback: TimingResearch.com/contact
Email Alerts
Make sure you don’t miss all the future reports, show reminders, and bonus offers from TimingResearch, enter your email here:
By signing up you agree to receive newsletter and alert emails. You can unsubscribe at any time. Privacy Policies
NOTE: The following open-ended answers are solely the opinions of the anonymous respondents to this survey. Responses are mostly unedited, but some have been reformatted slightly for to make them easier to read. Some irrelevant responses (e.g. “none”), or anything obviously fake, or copy and pasted responses have been omitted. All-caps responses have been changed to all lowercase. All responses for each week, unedited, are available in the raw data spreadsheets at TimingResearch.com/data.
Question #3. For your answer to Question #1, please share what specific reason(s) you think the S&P500 will be heading the direction you chose.
“Higher” Respondent Answers:
• Trend
• There will be a lower interest rate in the USA
• Earning season in line
• There is 86% (as of today) probability that the Fed will lower interest, S&P500 will be heading higher. The probability numbers are from CBOE Fed interest rate futures.
• Weak Fed will yield to political pressure.
• up in wave 3
• spy chart
• Momentum
• History
• Earnings report
• Trend is up and into fresh air
• Positive news form the Fed. Plus earnings upside surprises.
• fed cut and just general momentum
• Price is currently creeping higher, it will do so until it breaks. < (duh on me). On a daily chart, I see divergence for lower. That divergence could go on for days, MTF RSI is above a 21 and 100 MA, it will take a week to see any change to lower.
• Fed
“Lower” Respondent Answers:
• capitol hiss
• struggling and third attmp high now. forming a round and wedging top
• stocks overpriced will stop going up on positive news and the big money will begin distribution
• What’s the magic for going up?
• go up into the fed meeting and then sell off
• The market remains overbought. The market needs some backing and filling to get healthy. This is a very big week for earnings reports.
• The S&P is at the upper Bollinger band, with negative divergences. So, the odds favor a pullback.
• sell the news.
AD: Need more capital to trade? Click for Futures or Forex.
Question #4. What methods or techniques do you use to overcome the emotional aspects of trading?
• TA
• set a stop loss
• set a strict stop loss
• I look at the various charts.
• N/A
• Charts
• 50 years of obsevations
• I am very strong emotionally. I do not need methods or techniques.
• trade with smaller bet, buffer up
• Charts
• charting
• high probability setups
• data
• price action, VIX
• I use a fixed system based on an algorithm I designed.
• Fixed cross-overs of a set of indicators and use a Stop Loss for keeping your profits. Time in the market gives you experience which turns into confidence in time also.
Question #5. Additional Comments/Questions/Suggestions?
• I hope I am right.
• market has some room to go up
• Life is good, find the large market turns and stay in that direction for weeks while adding to your position.
Join us for this week’s shows:
Crowd Forecast News Episode #232
This week’s show will feature a discussion with the trading experts listed below about the most recent TimingResearch Crowd Forecast Newsletter report, where they think the S&P500 is headed, what they are watching for in the markets currently, and their best trading idea.
Date and Time:
– Monday, July 29th, 2019
– 1PM ET (10AM PT)
Moderator and Guests:
– Jake Bernstein of Trade-Futures.com
– Jim Kenney of OptionProfessor.com
– Erik Gebhard of Altavest.com
– Anka Metcalf of TradeOutLoud.com (moderator)
Analyze Your Trade Episode #87
When you register, you will be prompted to list the top 5 stocks that you are interested in trading. We will list the top 5 from all registrants and our experts will be prepared to offer their opinions on these trades.
Date and Time:
– Tuesday, July 30th, 2019
– 4PM ET (1PM PT)
Moderator and Guests:
– Michael Filighera of LogicalSignals.com
– Jim Kenney of OptionProfessor.com (moderator)

