
- Home
- Crowd Forecast News Reports
1


Crowd Forecast News Report #294
The new TimingResearch report for the week has been posted, you can download the full PDF report with the link below or you can read the full report in this post below.
Click here to download report in PDF format: TRReport051219.pdf
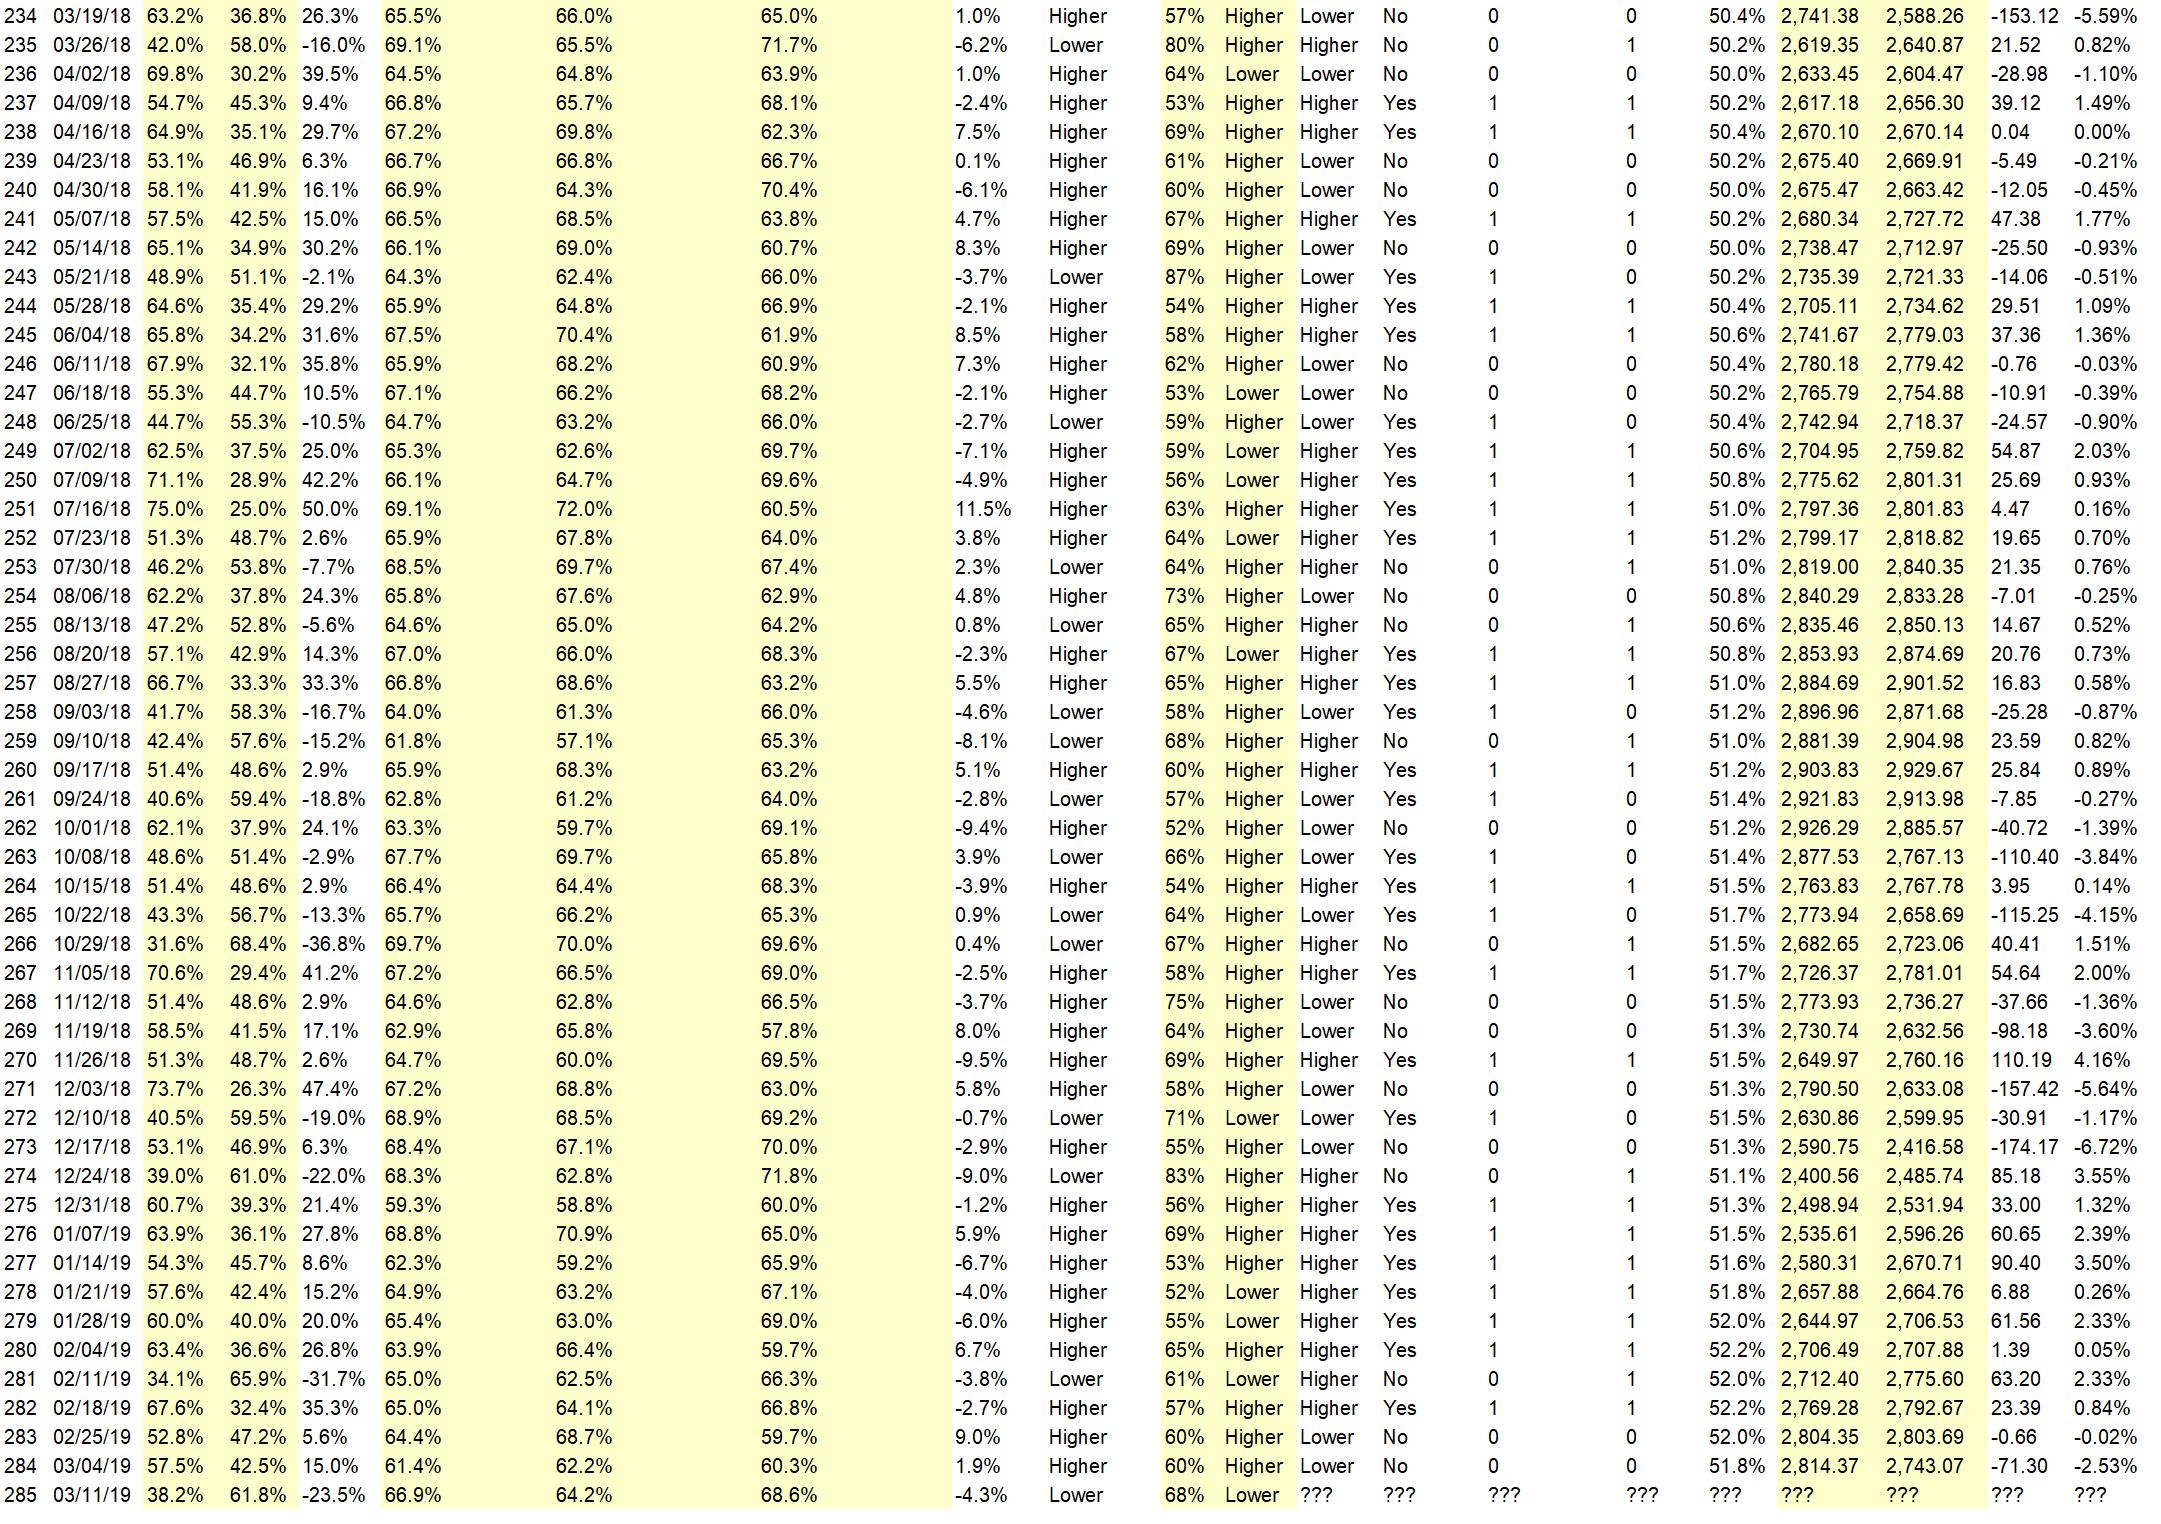
Question #1. Which direction do you think the S&P500 index will move from this coming Monday’s open to Friday’s close (May 13th to 17th)?
The order of possible responses to this question on the survey were randomized for each viewer.)
Higher: 43.8%
Lower: 56.3%
Higher/Lower Difference: -12.5%
Question #2. Rate your confidence in your answer to Question #2 by estimating the probability you have correctly predicted next week’s market move.
Average of All Responses: 66.7%
Average For “Higher” Responses: 62.9%
Average For “Lower” Responses: 69.7%
Higher/Lower Difference: -6.9%
Responses Submitted This Week: 34
52-Week Average Number of Responses: 38.8
TimingResearch Crowd Forecast Prediction: 56% Chance Higher
This prediction is an attempt by the editor of this newsletter to use the full 5 year history of data collected from this project to forecast a probability estimate for whether this week’s sentiment is going to be correct and ultimately what the markets will do this coming week.
Details: Last week’s majority sentiment from the survey was 57.1% Higher, and the Crowd Forecast Indicator prediction was 65% Chance Higher; the S&P500 closed 0.95% Lower for the week. This week’s majority sentiment from the survey is 56.3% Lower with a greater average confidence from those who responded Lower. Similar conditions have occurred 36 times in the previous 293 weeks, with the majority sentiment (Lower) being correct 44% of the time and with an average S&P500 move of 0.29% Higher for the week. Based on that history, the TimingResearch Crowd Forecast Indicator is forecasting a 56% Chance that the S&P500 is going to move Higher this coming week.
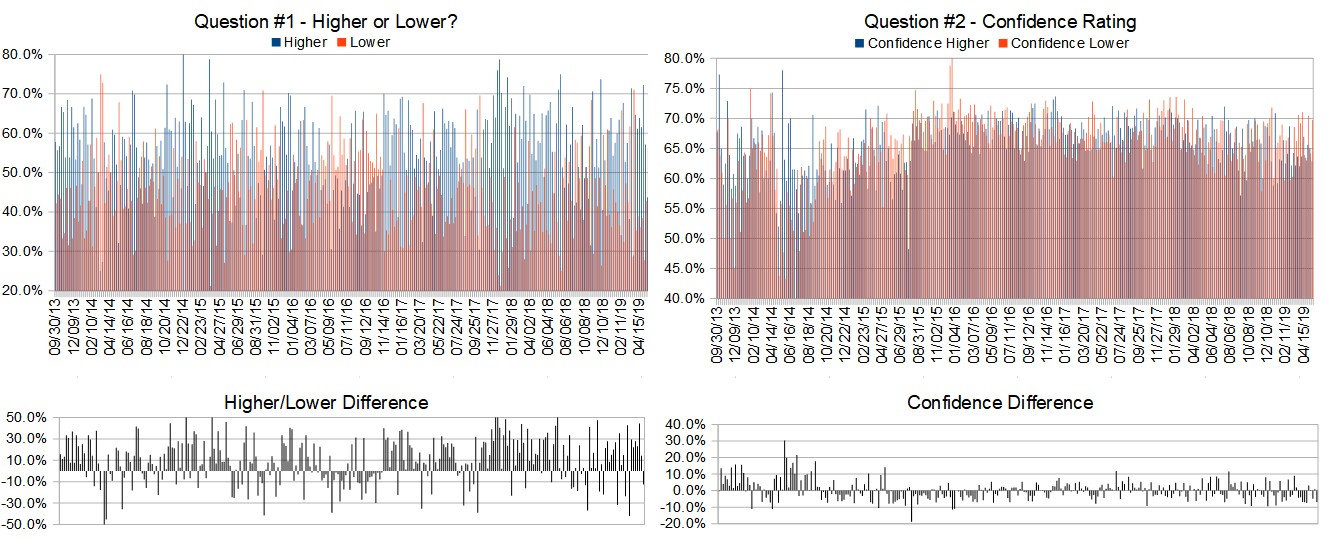
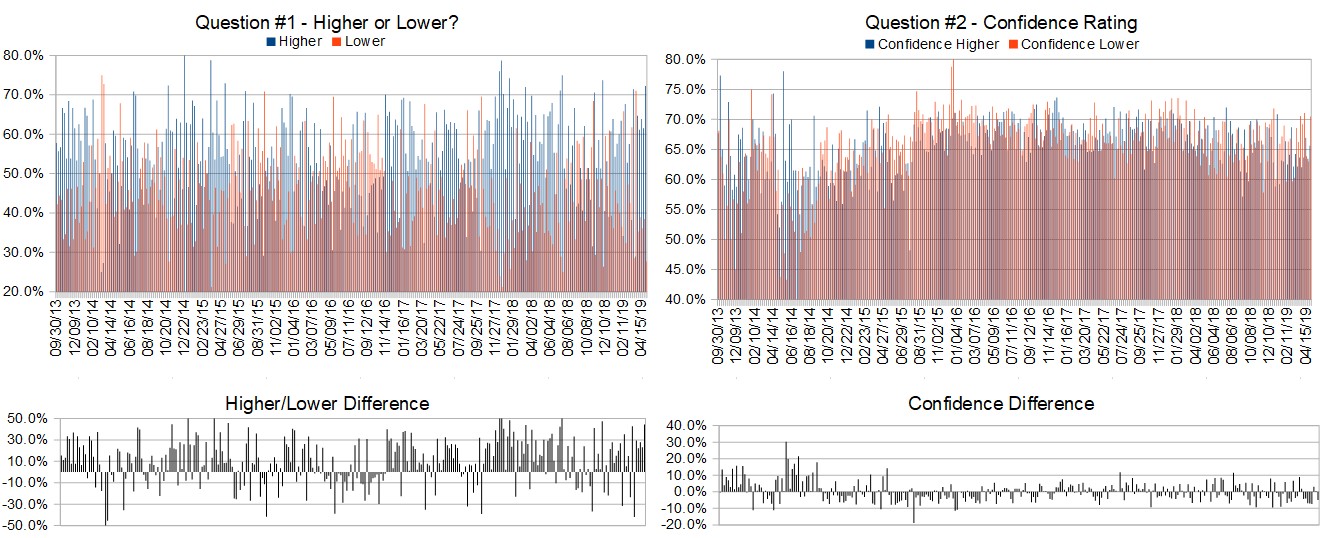
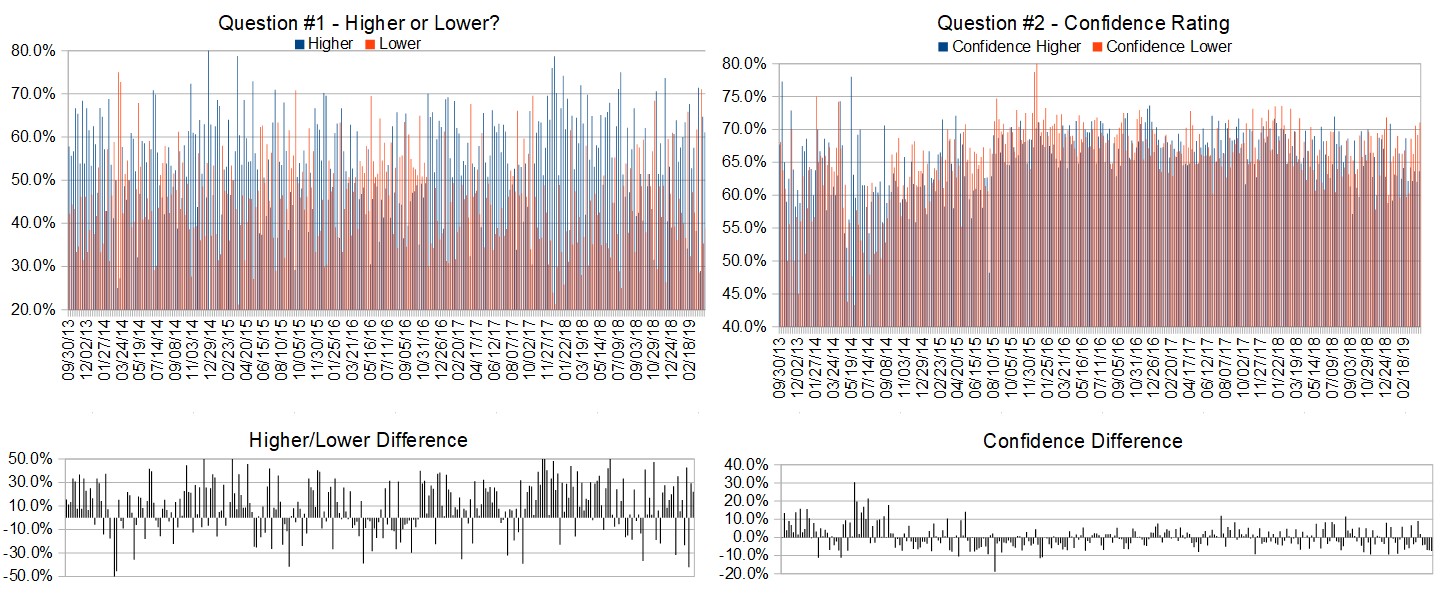
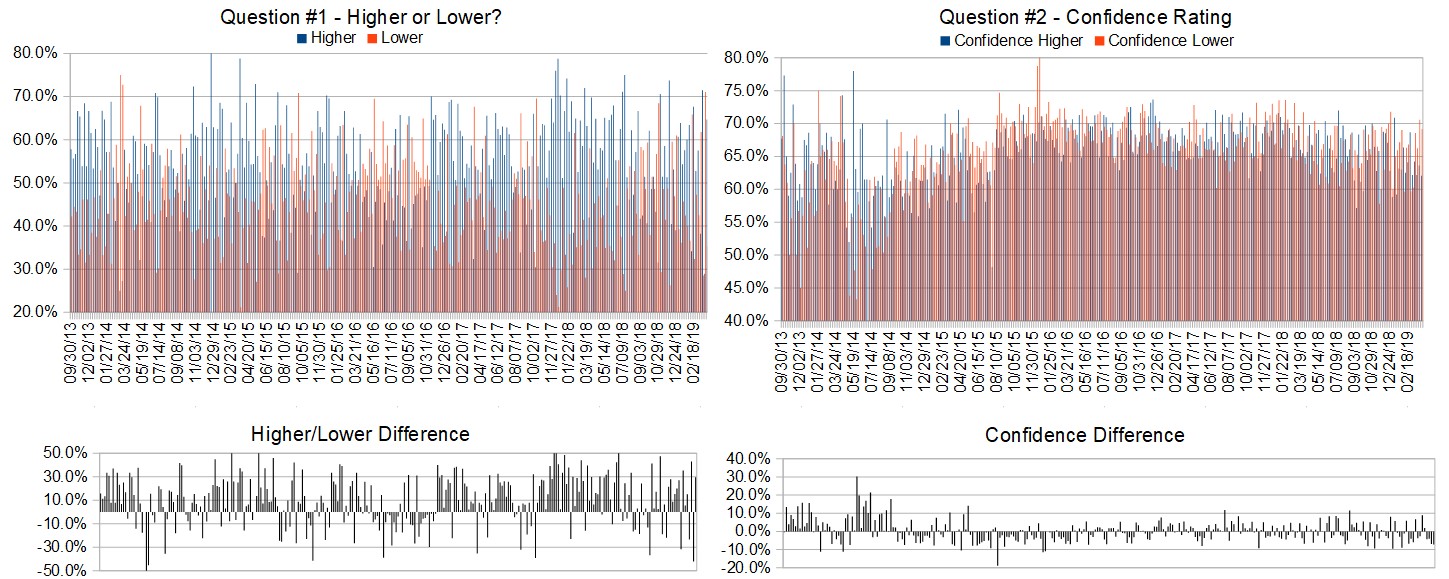
Raw Data Page (raw data files include full history spreadsheet and the above charts):
TimingResearch.com/data.
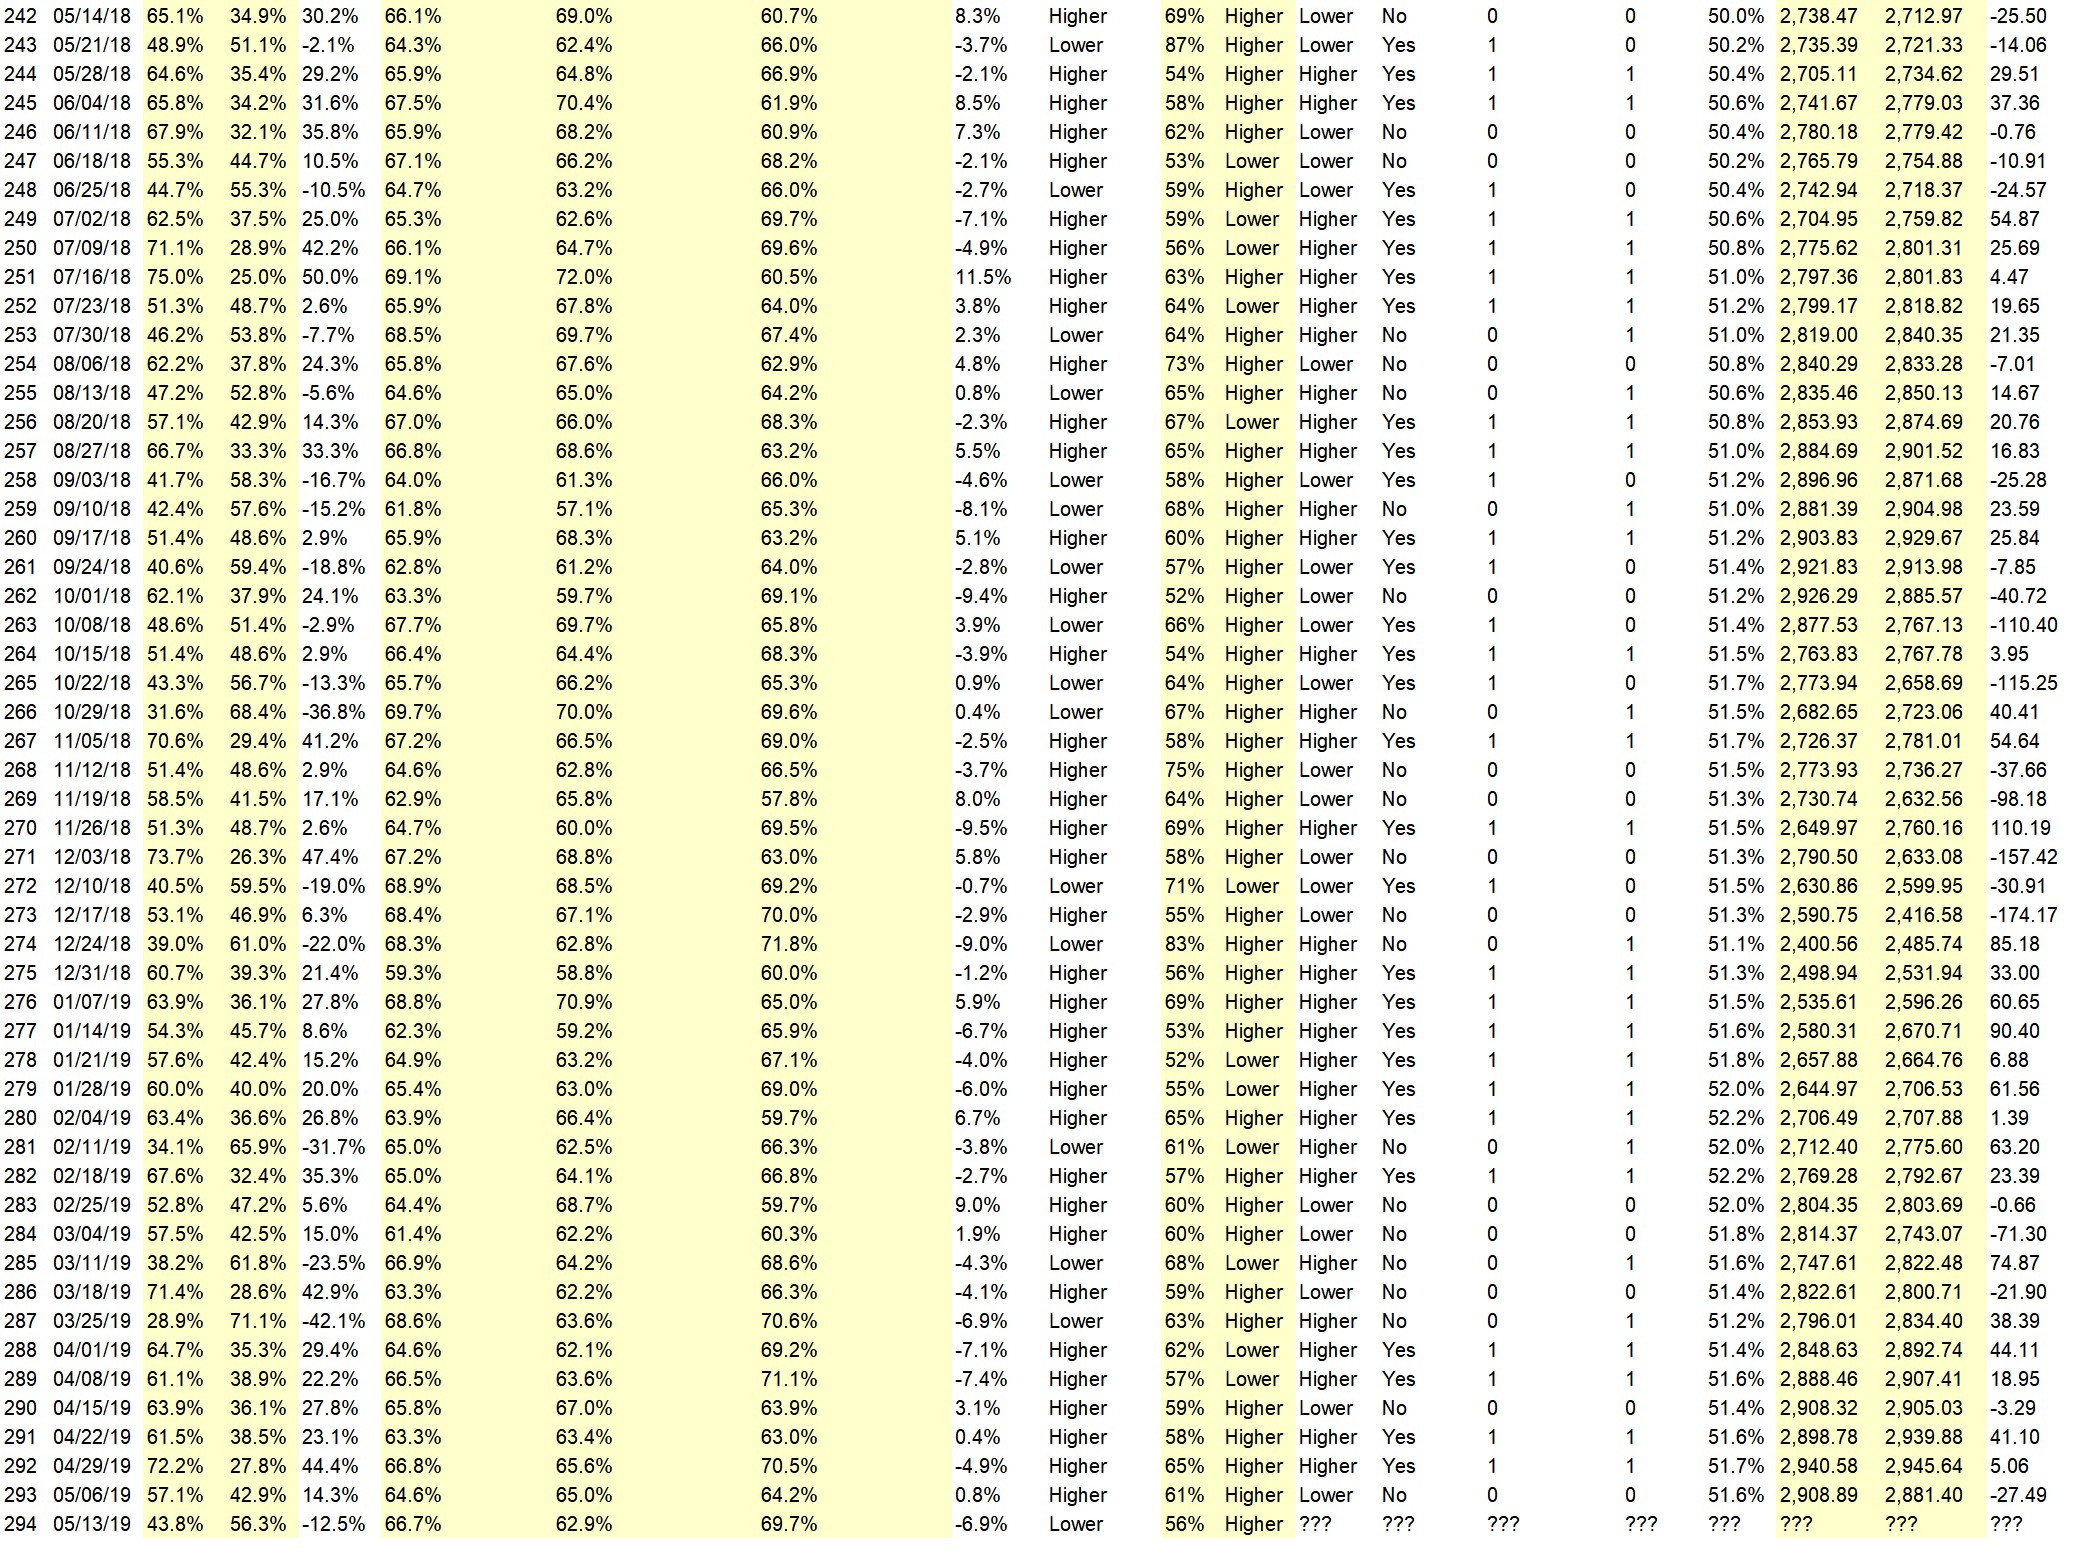
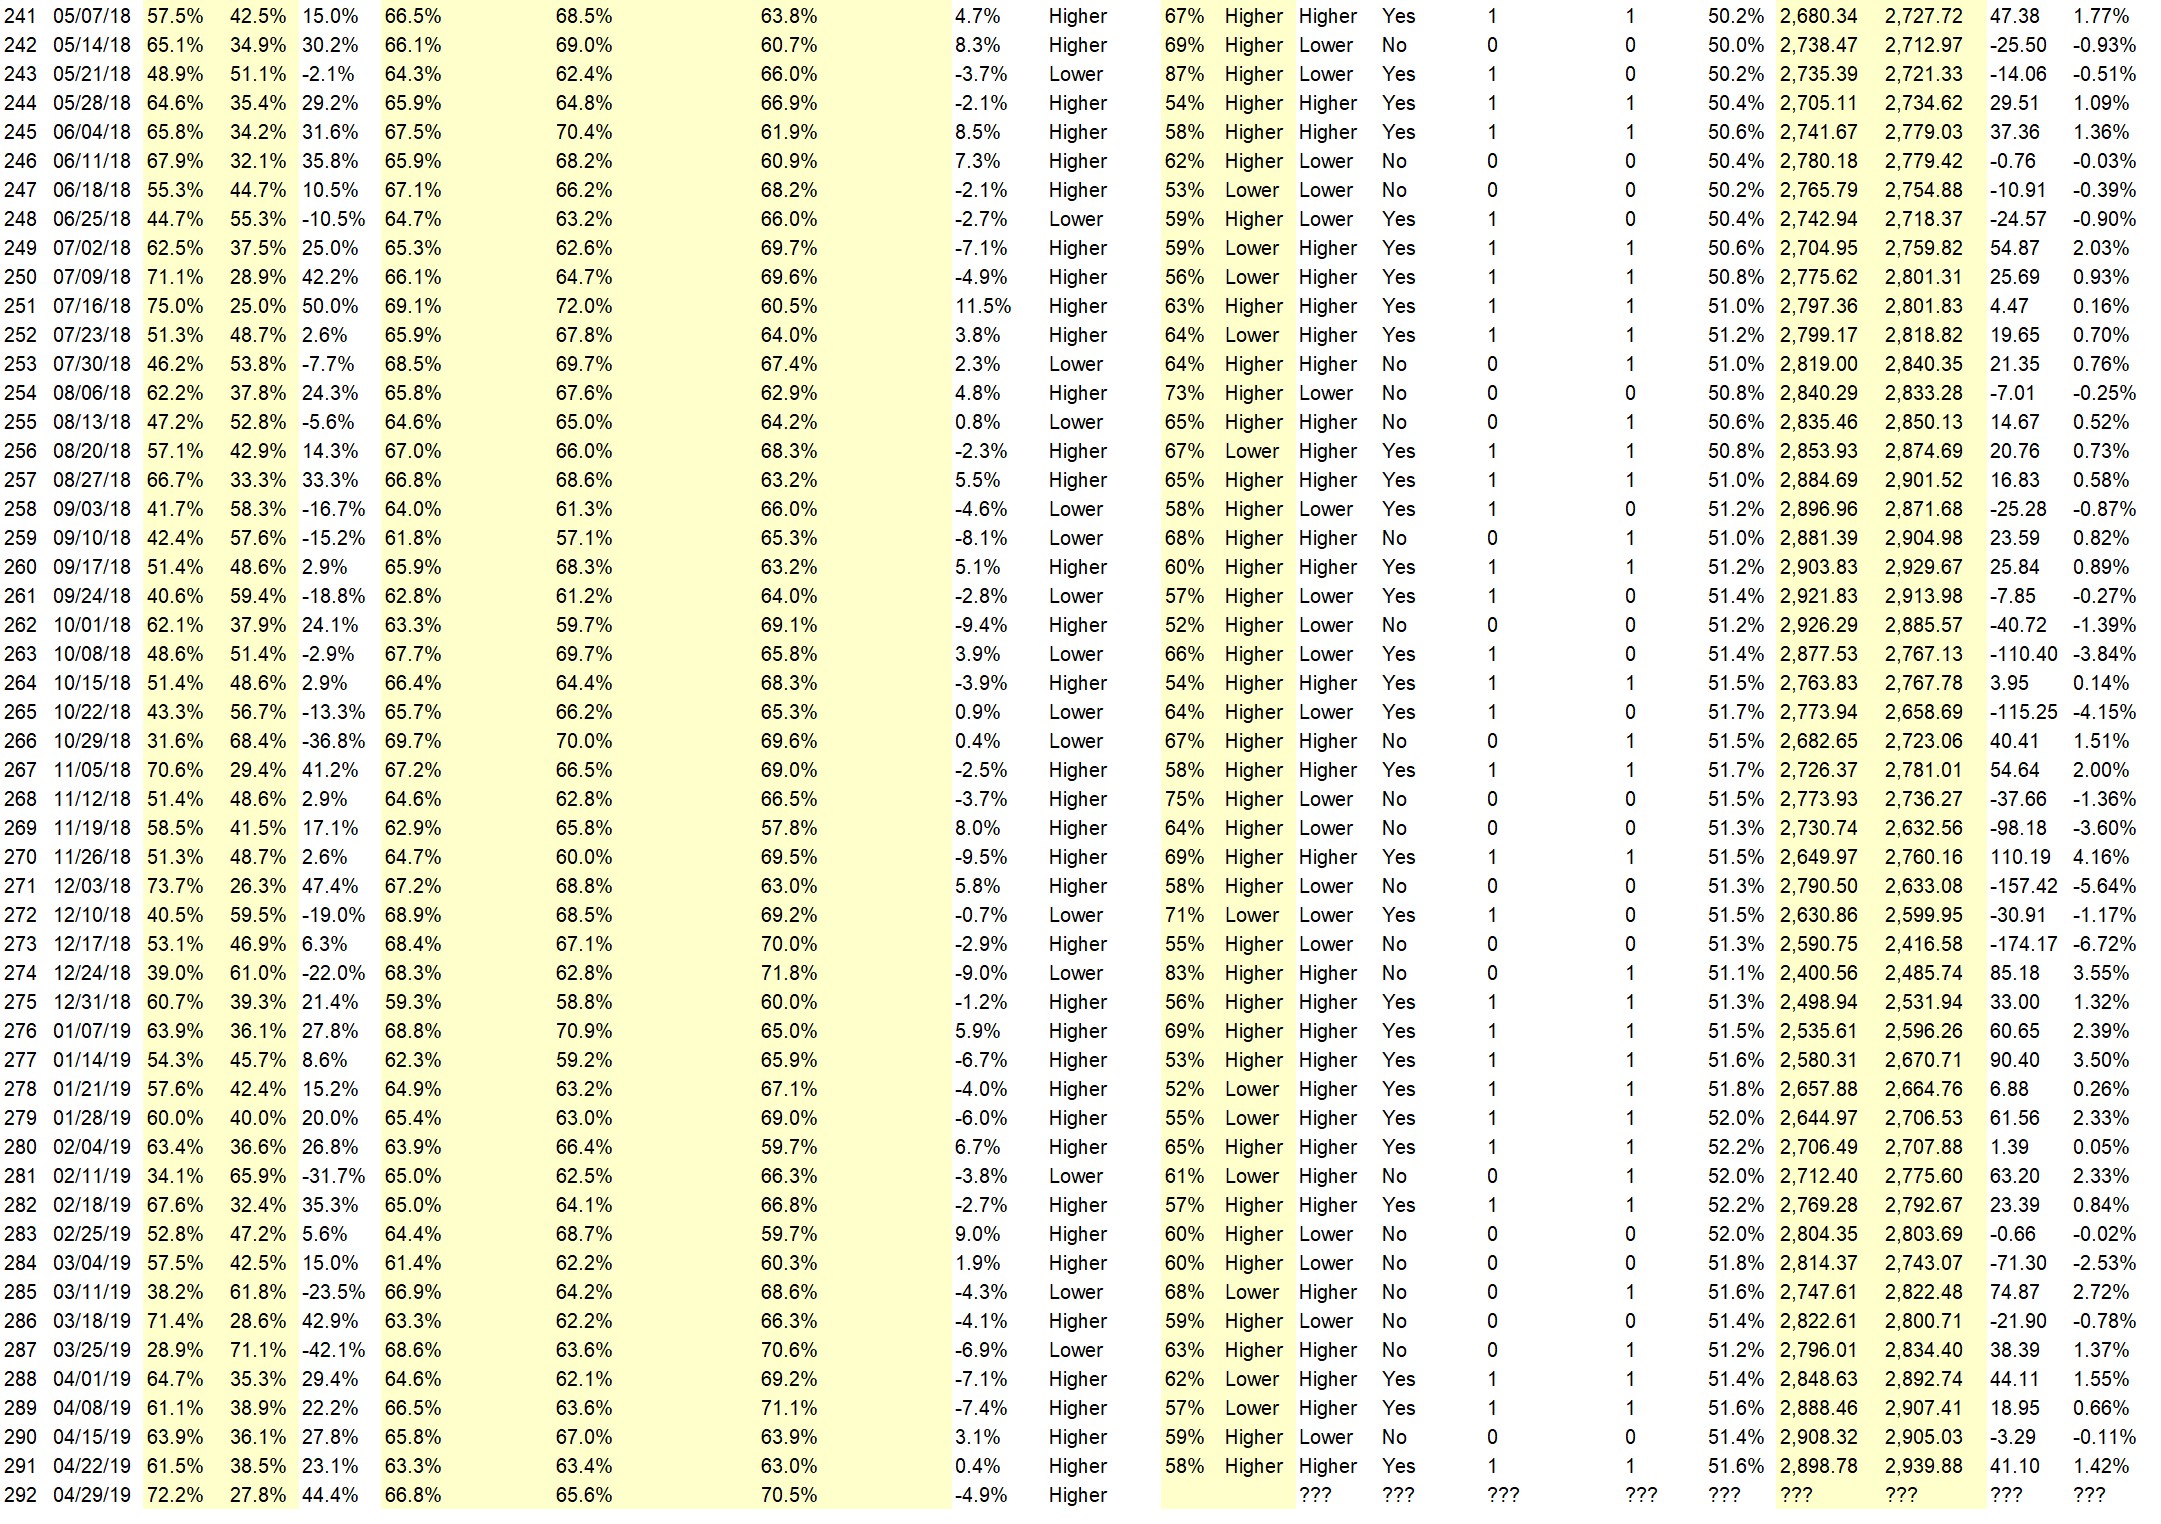
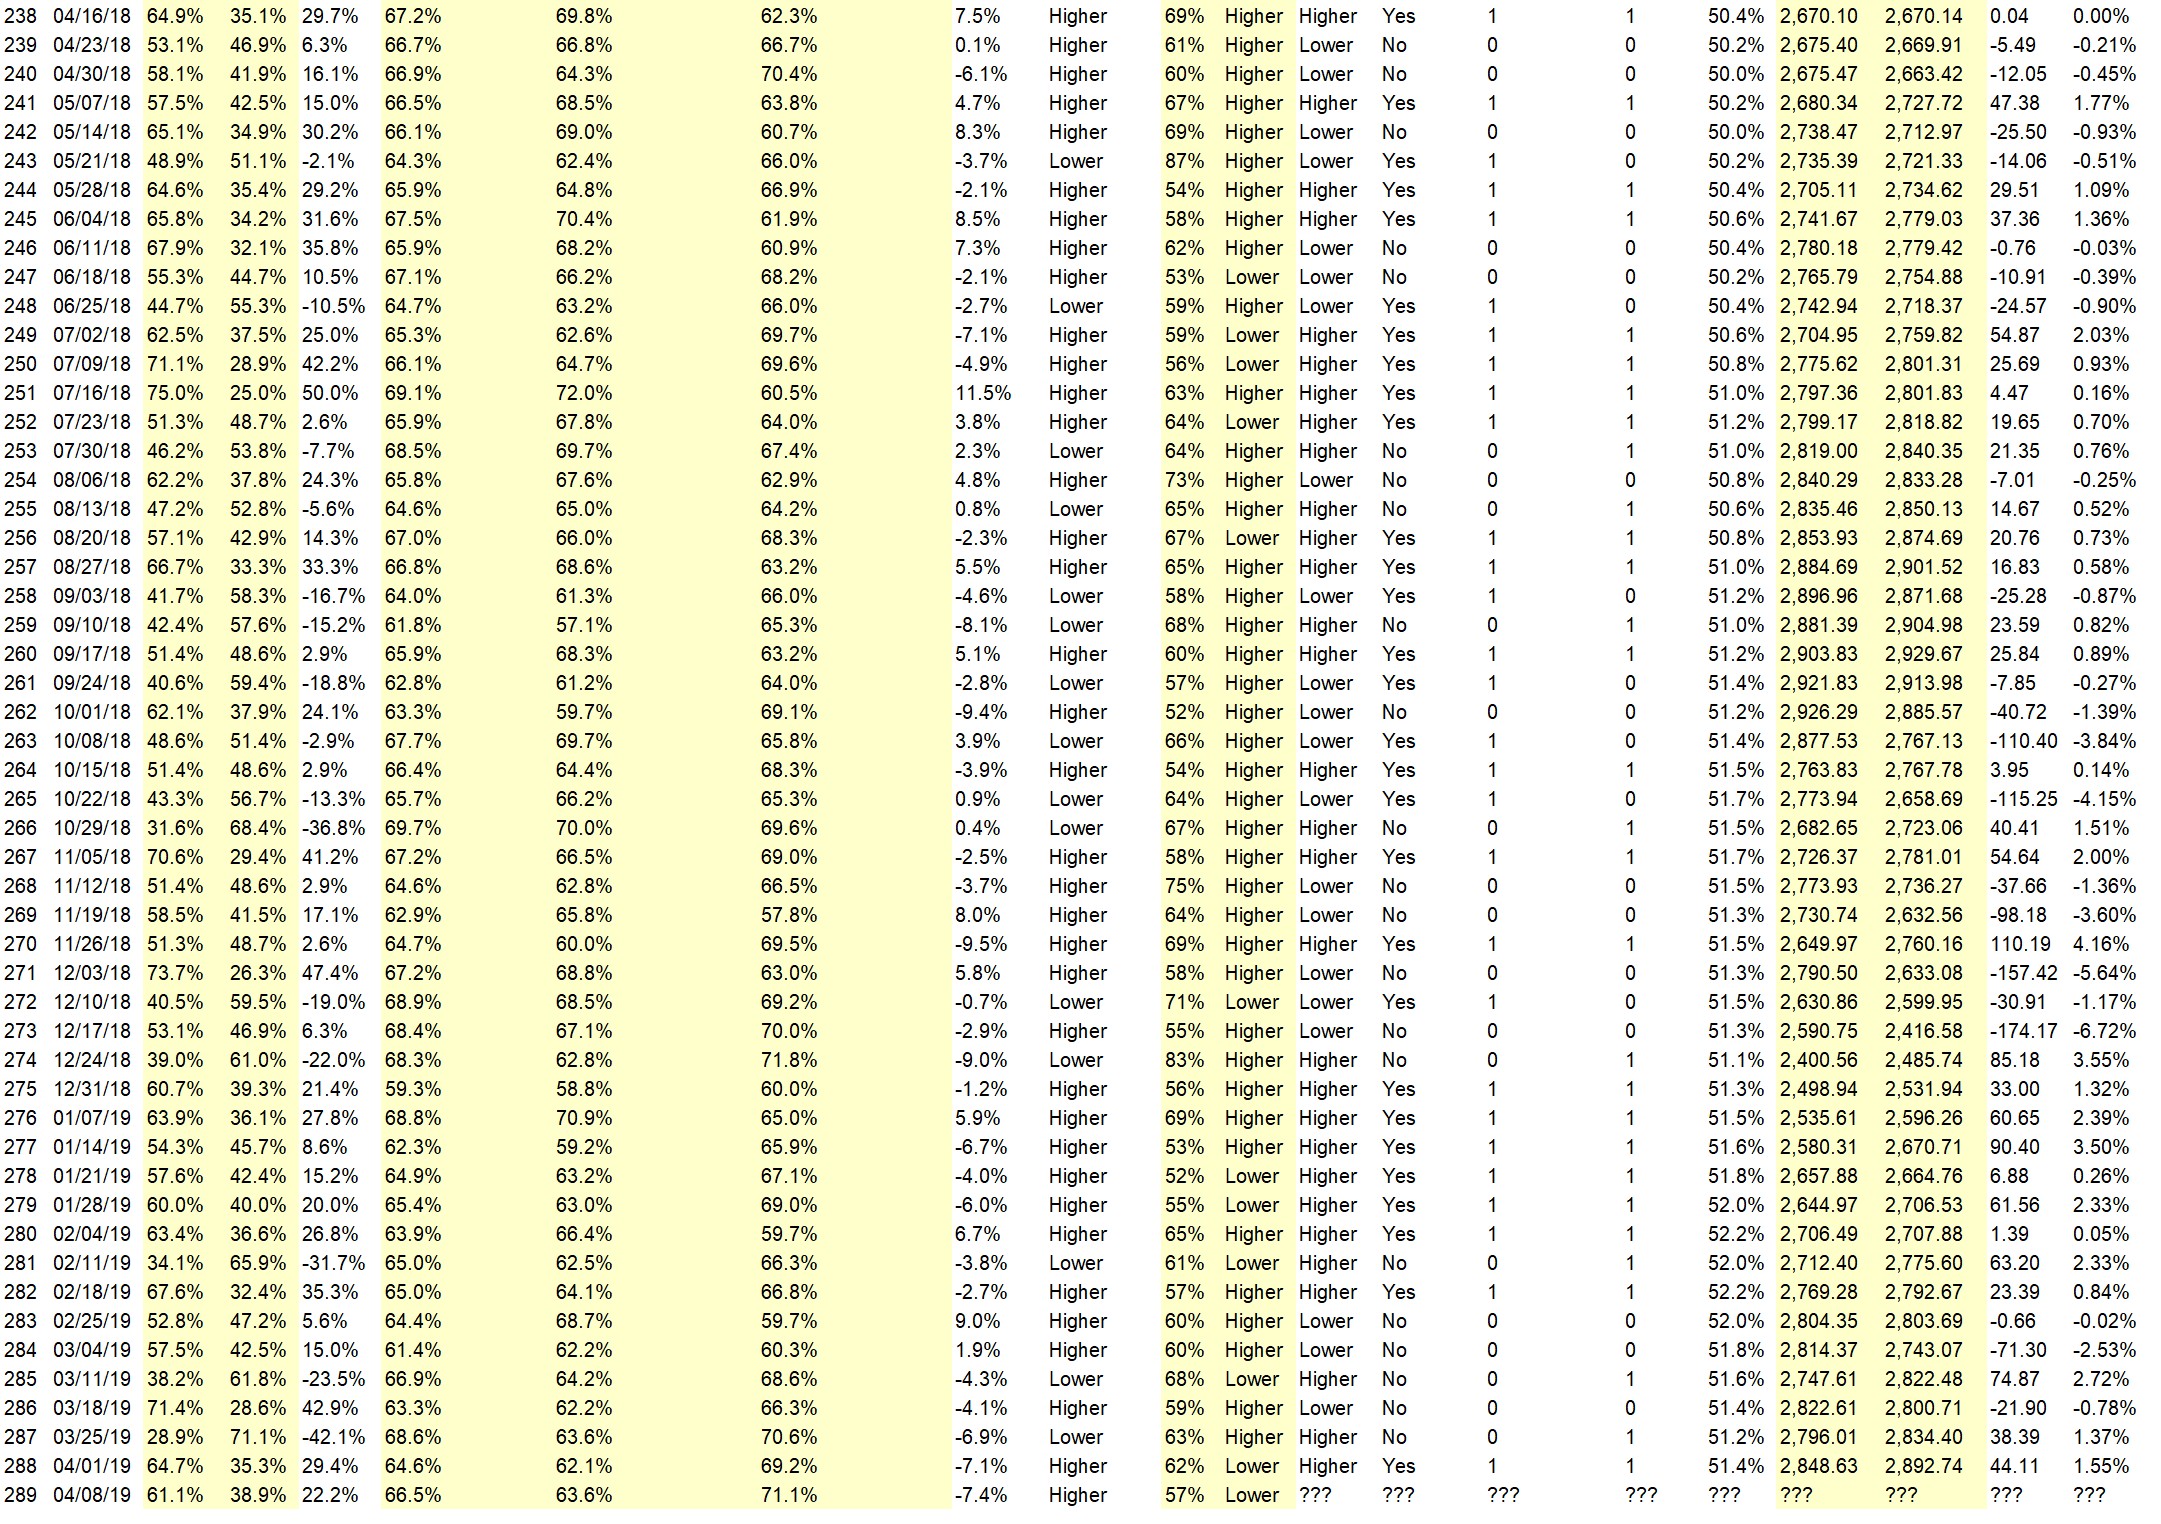
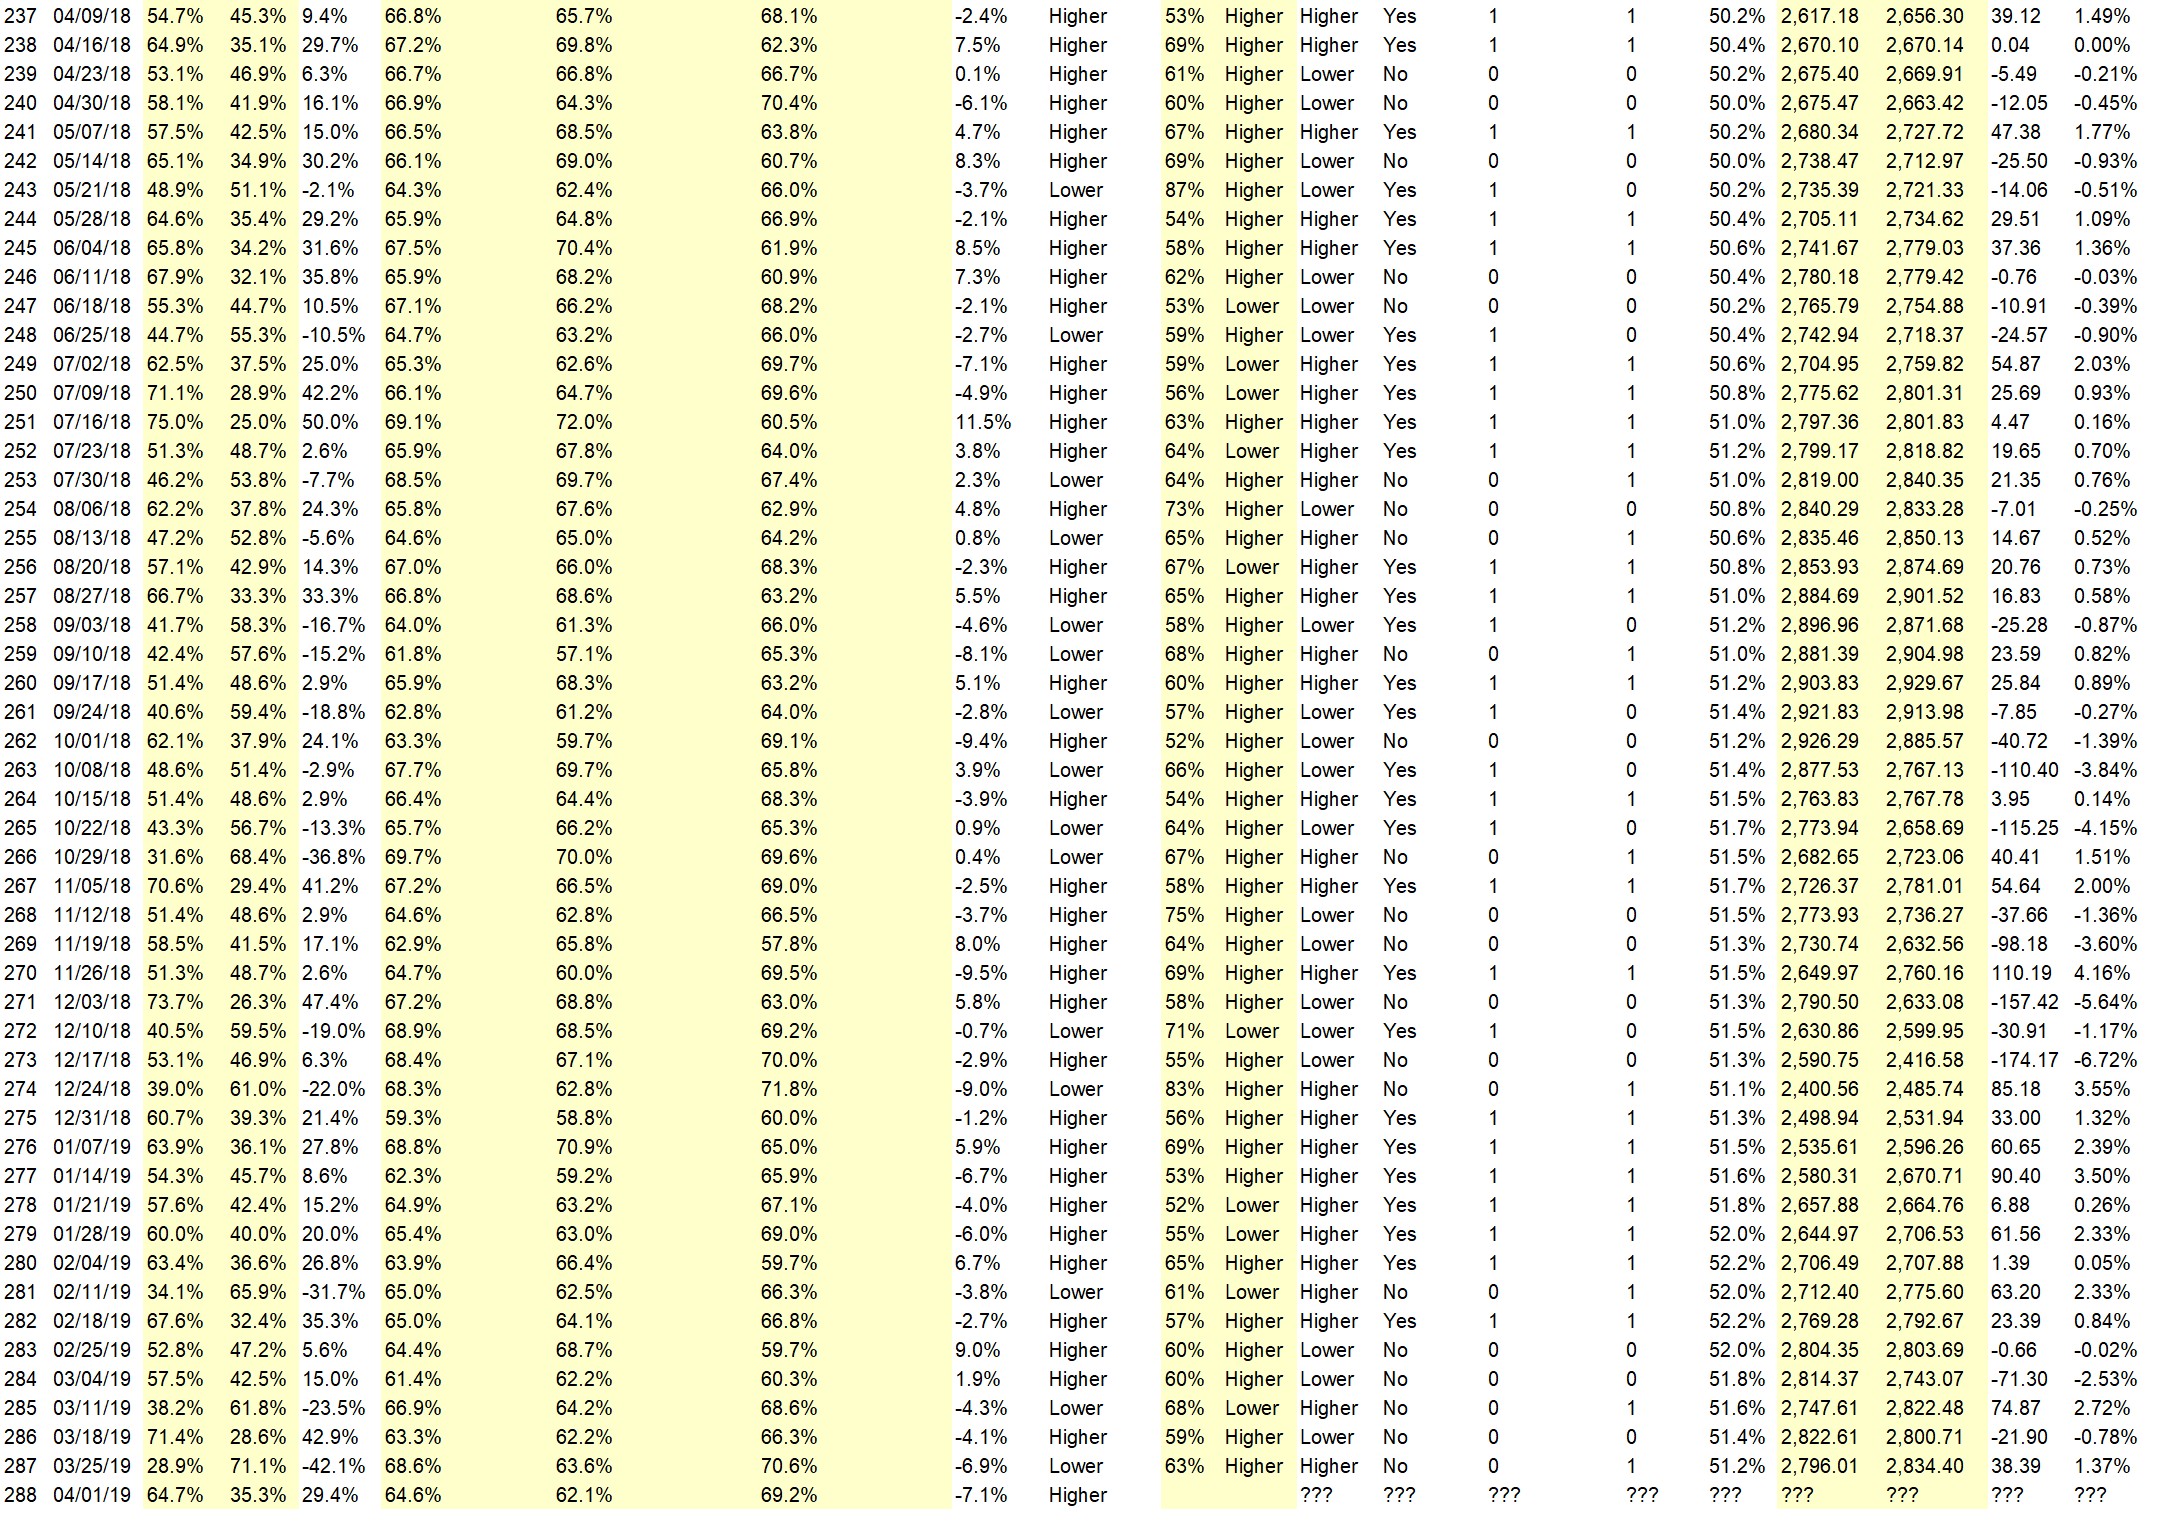
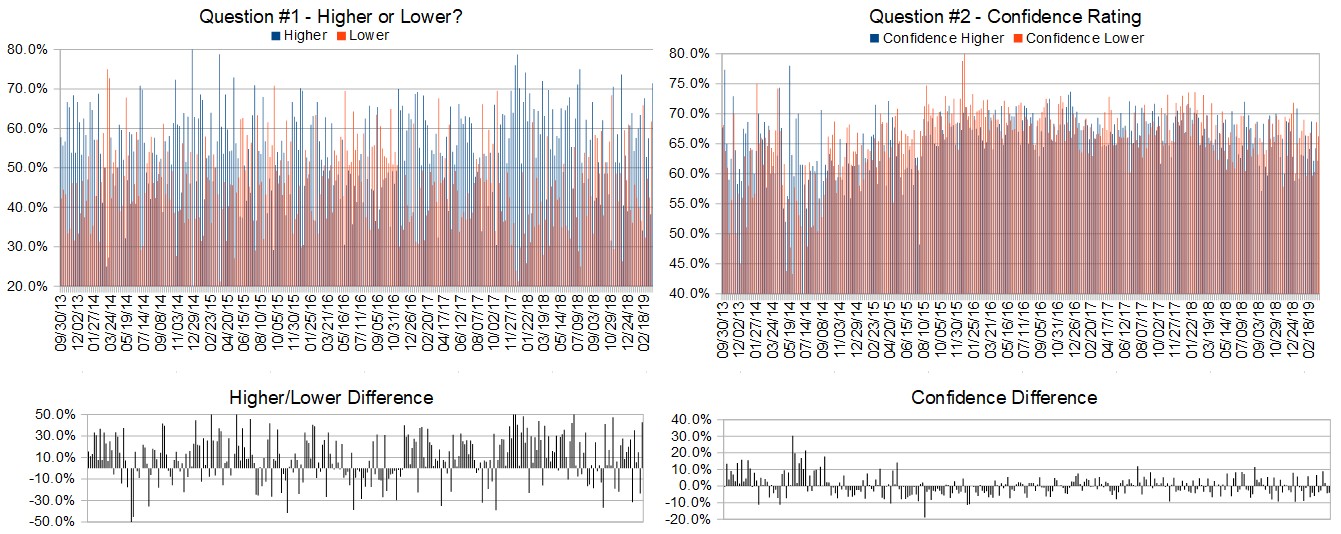
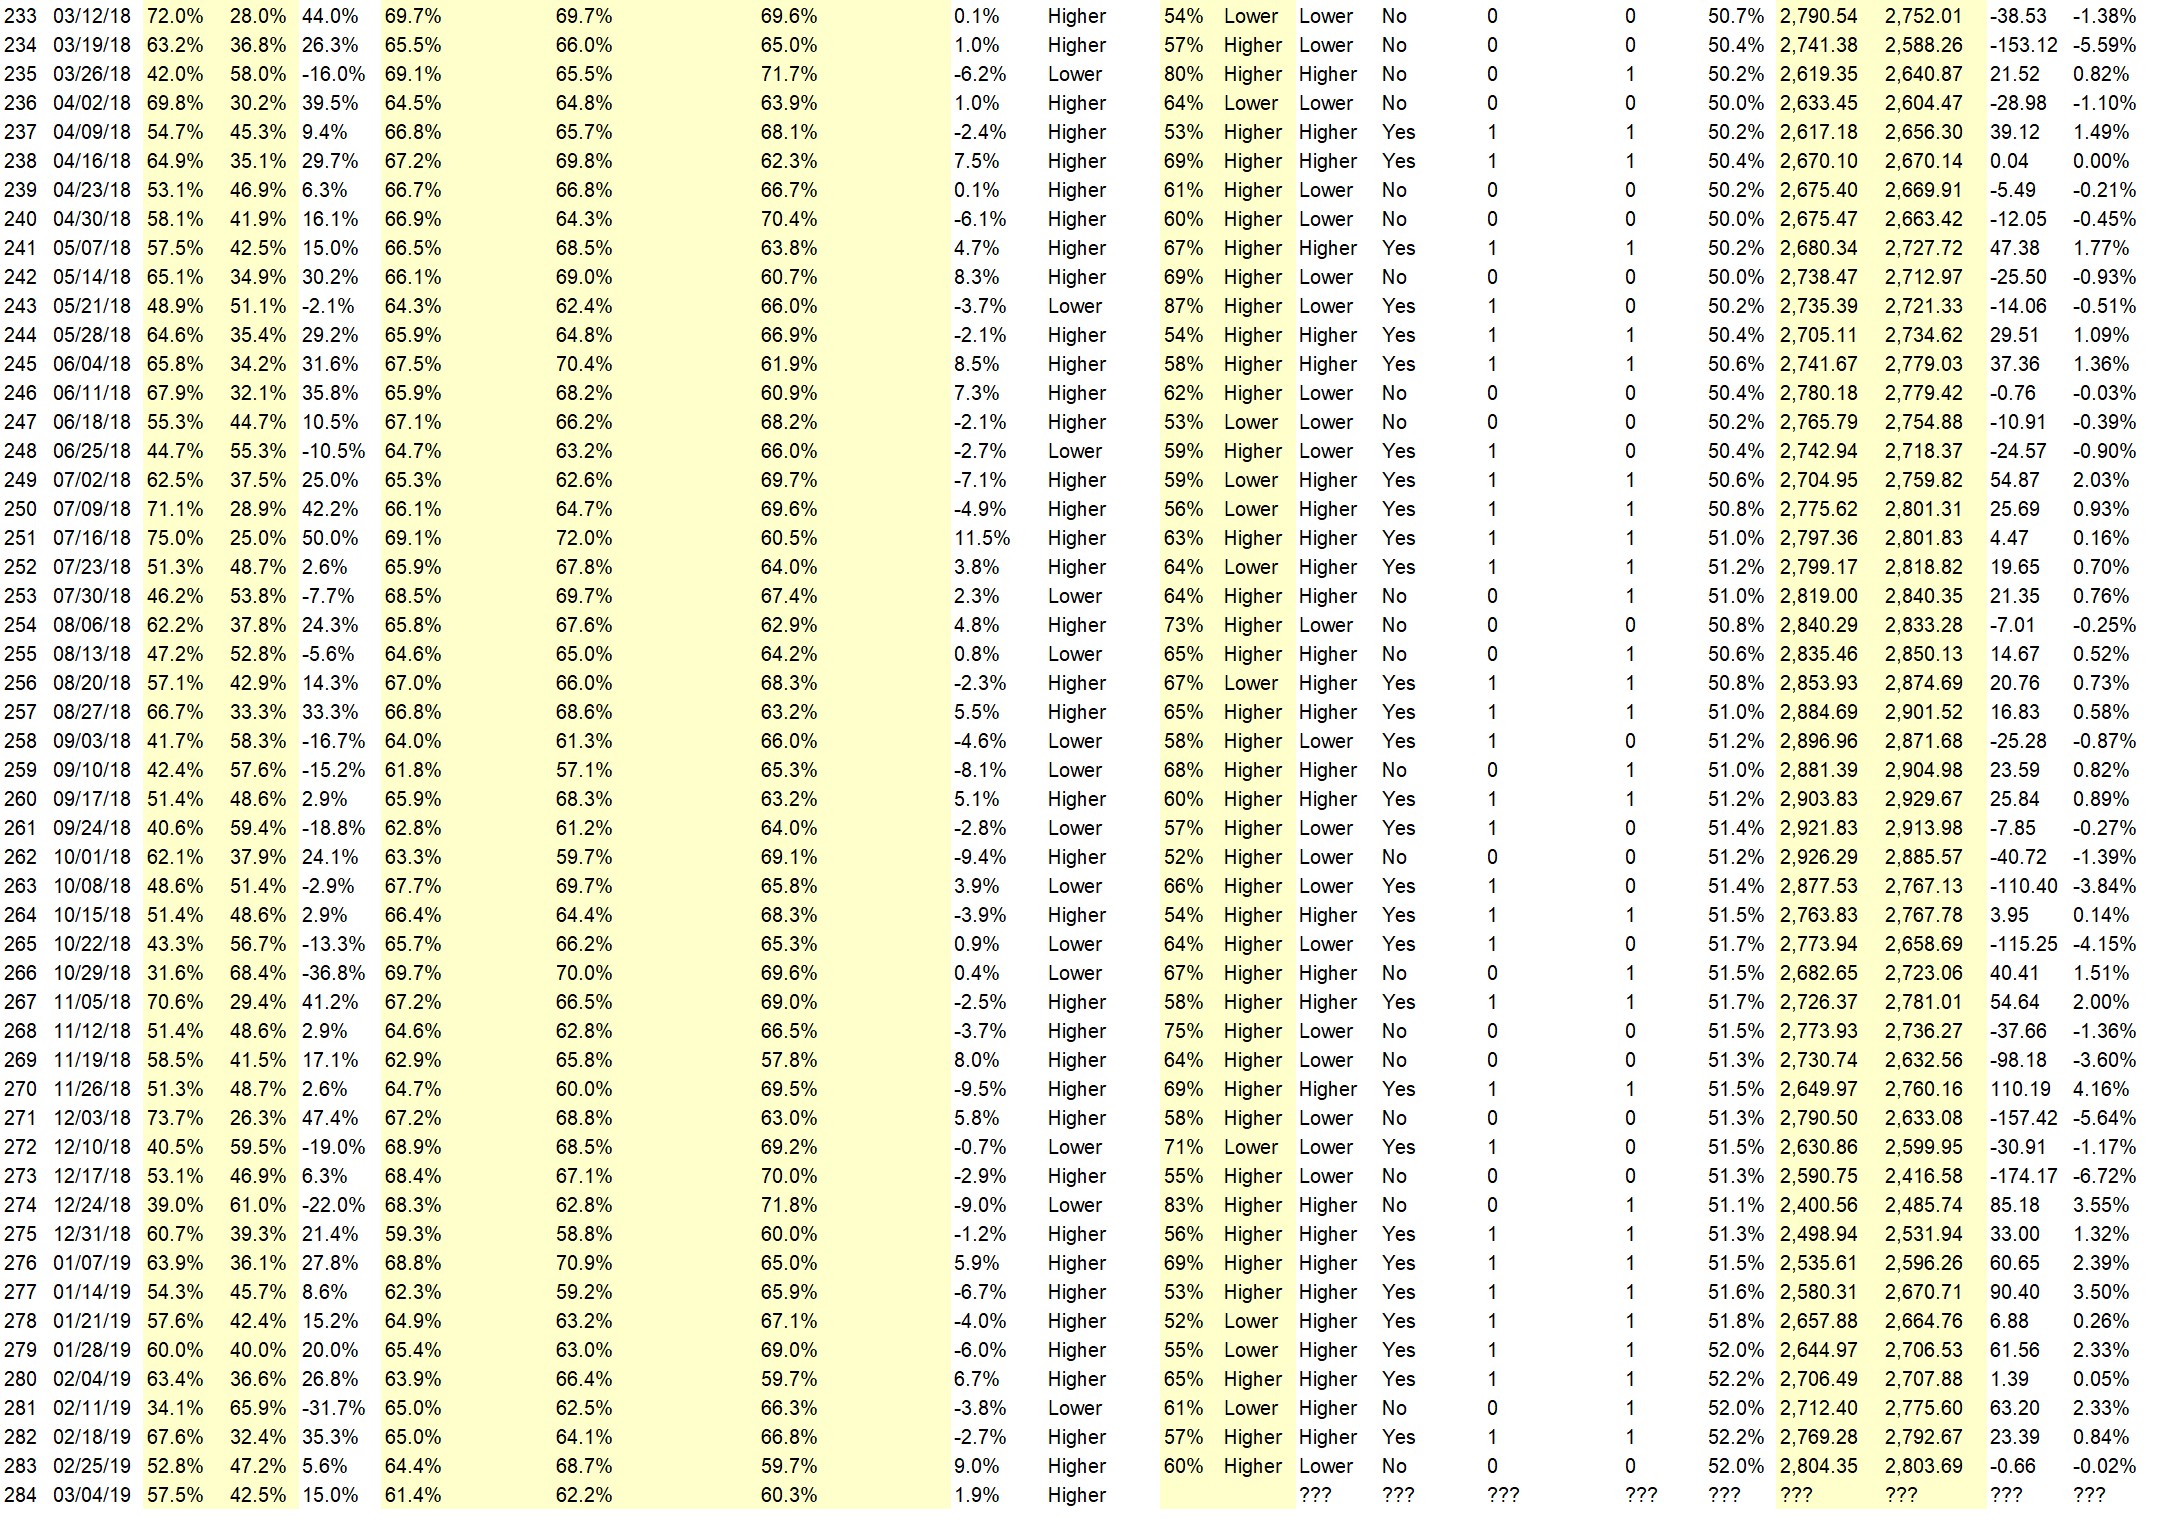
Full Weekly Results (full version of this chart available in the raw data spreadsheet for this week, “Date” field below lists the Monday of the week being predicted).
Overall Sentiment All-Time “Correct” Percentage: 51.6%
Overall Sentiment 52-Week “Correct” Percentage: 58.8%
Overall Sentiment 12-Week “Correct” Percentage: 36.4%
Only the previous 52 weeks of data are shown below, please download the raw data to see the full range of past data.
Weekly Reports Page: TimingResearch.com/reports
Raw Data Page: TimingResearch.com/rawdata
Current Survey Page: TimingResearch.com/currentsurvey
Any feedback: TimingResearch.com/contact
Email Alerts
Make sure you don’t miss all the future reports, show reminders, and bonus offers from TimingResearch, enter your email here:
By signing up you agree to receive newsletter and alert emails. You can unsubscribe at any time. Privacy Policies
NOTE: The following open-ended answers are solely the opinions of the anonymous respondents to this survey. Responses are mostly unedited, but some have been reformatted slightly for to make them easier to read. Some irrelevant responses (e.g. “none”), or anything obviously fake, or copy and pasted responses have been omitted. All-caps responses have been changed to all lowercase. All responses for each week, unedited, are available in the raw data spreadsheets at TimingResearch.com/data.
Question #3. For your answer to Question #1, please share what specific reason(s) you think the S&P500 will be heading the direction you chose.
“Higher” Respondent Answers:
• Cycles and the momentum that has been spawned by the political arena.
• sell gold
• A nice bounce after a steep drop.
• The chart is showing, it is going to go up
• Current decline looks completed.
• Trend continues
“Lower” Respondent Answers:
• Trade war with China
• Trade uncertainty
• macd is down
• When I’m long, the S&P decreases
• Trade war
• russell still strugging, few stocs tradingocer 20dma in s/p 500
• elliott wave 4 underway and oscillator has not yet turned
• The market is entering a downside correction faze.
• The market hit an all-time high in late April, and isn’t far below that now, i.e. the market is still high. With that, and considering all the uncertainty about tariffs and growth, the downward path is the more likely one.
• Last week’s market volatility soared as indexes fell
• Its over sucker rally dead ahead
• fibo
• Still in downtrend from beginning of May. Altho Friday looks like upward recovery, ES retraced only 50% up, and only enough so indicators are no longer oversold.
Question #4. What are the most important mental and emotional characteristics for traders to develop?
• Discipline
• Consistency removing emotion from trade.
• Use a workable trading plan so you don’t trade with your emotions….
• Ability to stick to their thesis, despite what the outside media is falsely proclaims.
• Common sense
• probability mindset, discipline wait for yr setup and take yr stops
• Detachment.
• ambivalence to trend
• disciple
• thick skin
• buy on strength
• alles
• Remember overall stats of your system and don’t get involved over individual losses or wins.
• Recognize when emotions are getting in the way of good trading; then focus on using techniques that ignore those emotions.
• Mental focus and recognizing emotional impact on decisions
Question #5. Additional Comments/Questions/Suggestions?
• none
Join us for this week’s shows:
Crowd Forecast News Episode #224
This week’s show will feature a discussion with the trading experts listed below about the most recent TimingResearch Crowd Forecast Newsletter report, where they think the S&P500 is headed, what they are watching for in the markets currently, and their best trading idea.
Date and Time:
– Monday, May 13th, 2019
– 1PM ET (10AM PT)
Moderator and Guests:
– Fausto Pugliese of CyberTradingUniversity.com
– Bennett McDowell of TradersCoach.com
– Jake Bernstein of Trade-Futures.com
– Norman Hallett of TheDisciplinedTrader.com (moderator)
Analyze Your Trade Episode #77
When you register, you will be prompted to list the top 5 stocks that you are interested in trading. We will list the top 5 from all registrants and our experts will be prepared to offer their opinions on these trades.
Date and Time:
– Tuesday, May 14th, 2019
– 4PM ET (1PM PT)
Moderator and Guests:
– Jim Kenney of OptionProfessor.com
– Andrew Keene of AlphaShark.com
– E. Matthew “Whiz” Buckley of TopGunOptions.com
4
Crowd Forecast News Report #293
The new TimingResearch report for the week has been posted, you can download the full PDF report with the link below or you can read the full report in this post below.
Click here to download report in PDF format: TRReport050519.pdf
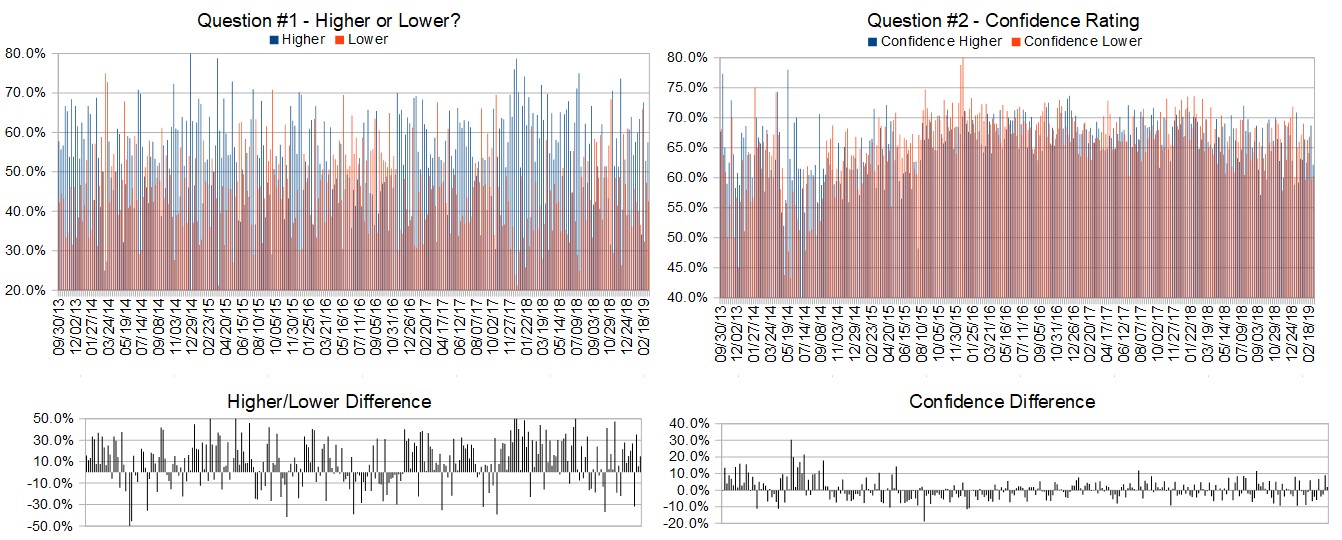
Question #1. Which direction do you think the S&P500 index will move from this coming Monday’s open to Friday’s close (May 6th to 10th)?
The order of possible responses to this question on the survey were randomized for each viewer.)
Higher: 57.1%
Lower: 42.9%
Higher/Lower Difference: 14.3%
Question #2. Rate your confidence in your answer to Question #2 by estimating the probability you have correctly predicted next week’s market move.
Average of All Responses: 64.6%
Average For “Higher” Responses: 65.0%
Average For “Lower” Responses: 64.2%
Higher/Lower Difference: 0.8%
Responses Submitted This Week: 30
52-Week Average Number of Responses: 39.4
TimingResearch Crowd Forecast Prediction: 61% Chance Higher
This prediction is an attempt by the editor of this newsletter to use the full 5 year history of data collected from this project to forecast a probability estimate for whether this week’s sentiment is going to be correct and ultimately what the markets will do this coming week.
Details: Last week’s majority sentiment from the survey was 72.2% Higher, and the Crowd Forecast Indicator prediction was 65% Chance Higher; the S&P500 closed 0.17% Higher for the week. This week’s majority sentiment from the survey is 57.1% Higher with a greater average confidence from those who responded Higher. Similar conditions have occurred 18 times in the previous 292 weeks, with the majority sentiment (Higher) being correct 61% of the time and with an average S&P500 move of 0.42% Higher for the week. Based on that history, the TimingResearch Crowd Forecast Indicator is forecasting a 61% Chance that the S&P500 is going to move Higher this coming week.
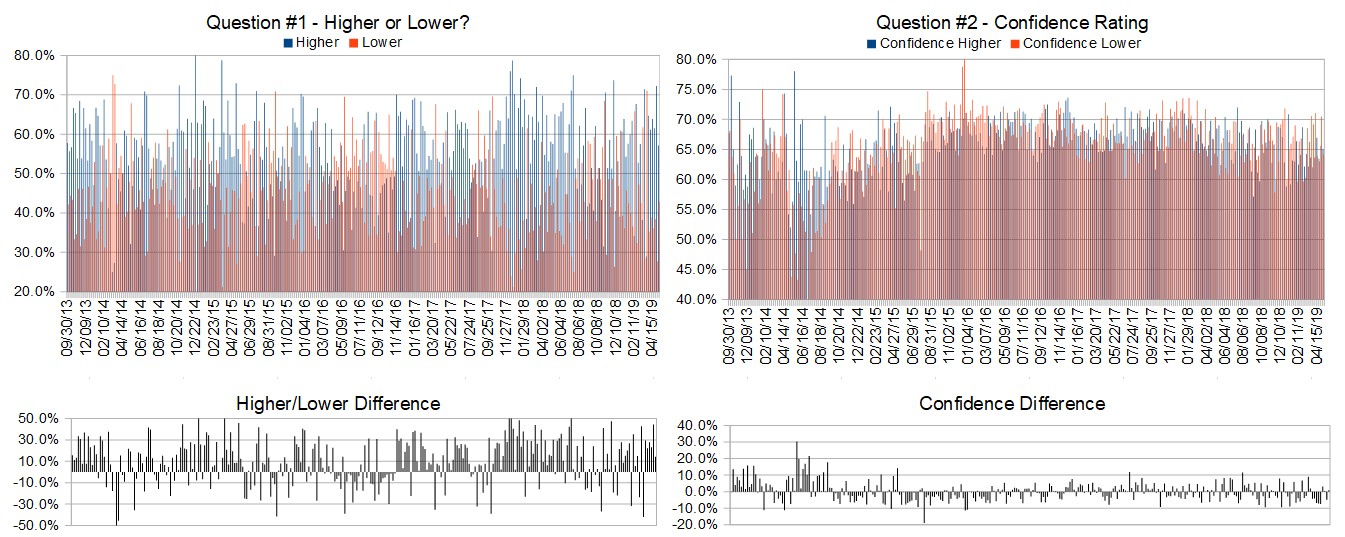
Raw Data Page (raw data files include full history spreadsheet and the above charts):
TimingResearch.com/data.
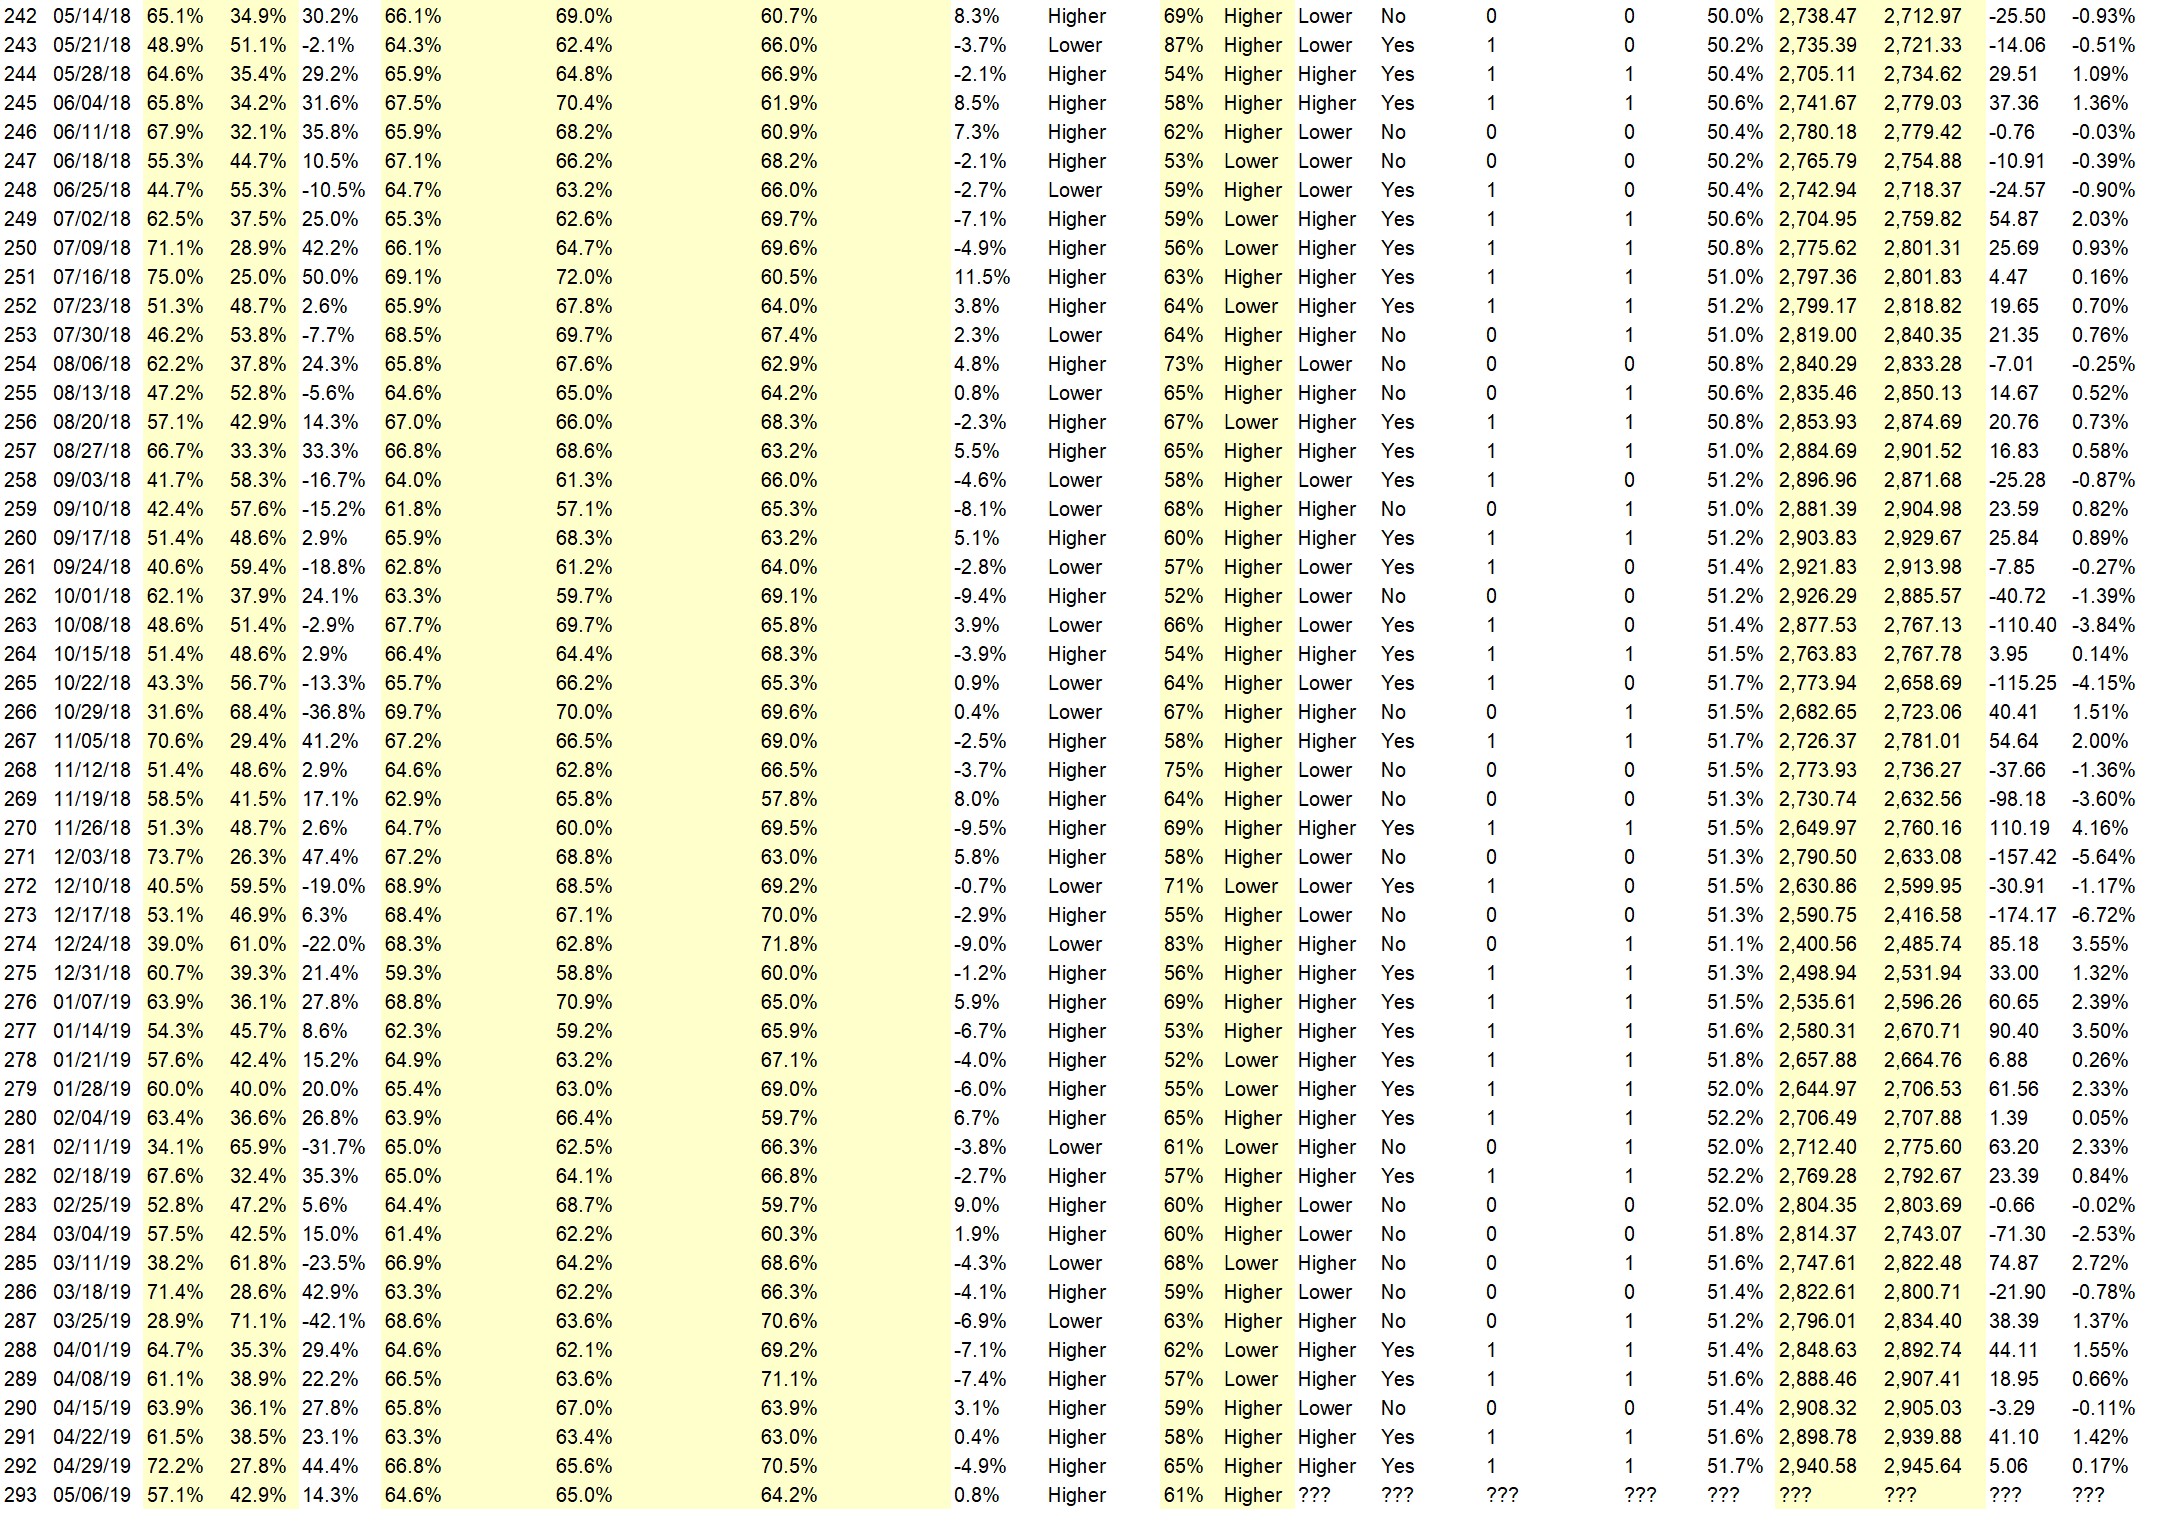
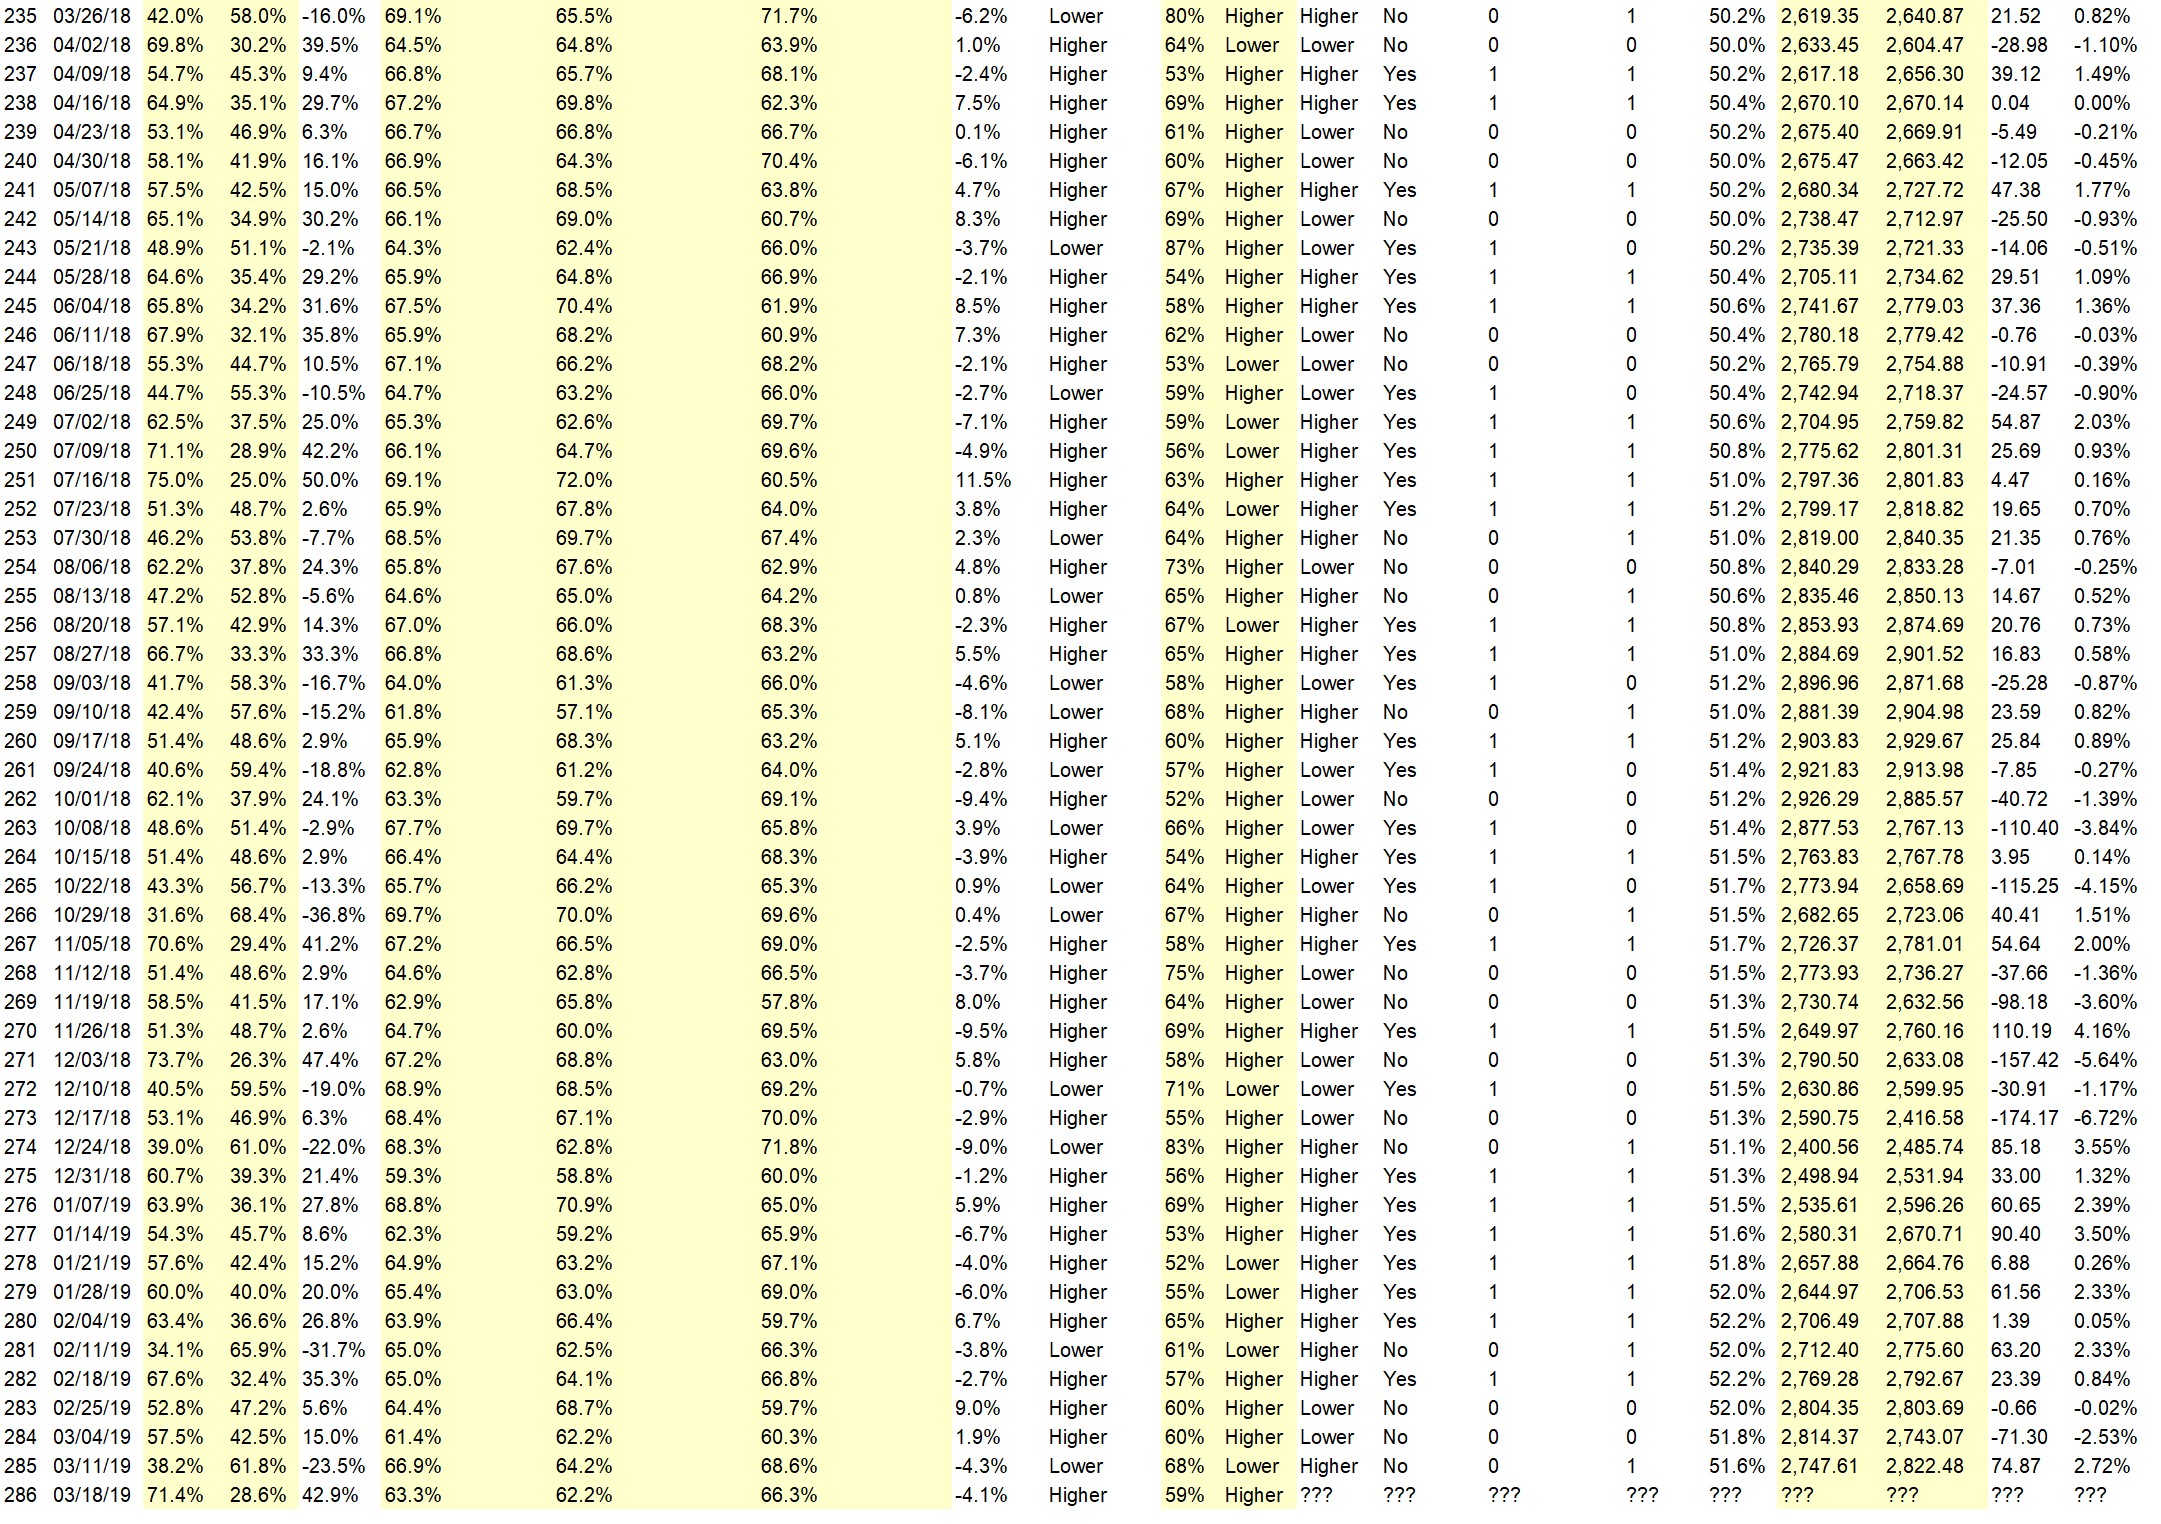
Full Weekly Results (full version of this chart available in the raw data spreadsheet for this week, “Date” field below lists the Monday of the week being predicted).
Overall Sentiment All-Time “Correct” Percentage: 51.7%
Overall Sentiment 52-Week “Correct” Percentage: 58.8%
Overall Sentiment 12-Week “Correct” Percentage: 45.5%
Only the previous 52 weeks of data are shown below, please download the raw data to see the full range of past data.
Weekly Reports Page: TimingResearch.com/reports
Raw Data Page: TimingResearch.com/rawdata
Current Survey Page: TimingResearch.com/currentsurvey
Any feedback: TimingResearch.com/contact
Email Alerts
Make sure you don’t miss all the future reports, show reminders, and bonus offers from TimingResearch, enter your email here:
By signing up you agree to receive newsletter and alert emails. You can unsubscribe at any time. Privacy Policies
NOTE: The following open-ended answers are solely the opinions of the anonymous respondents to this survey. Responses are mostly unedited, but some have been reformatted slightly for to make them easier to read. Some irrelevant responses (e.g. “none”), or anything obviously fake, or copy and pasted responses have been omitted. All-caps responses have been changed to all lowercase. All responses for each week, unedited, are available in the raw data spreadsheets at TimingResearch.com/data.
Question #3. For your answer to Question #1, please share what specific reason(s) you think the S&P500 will be heading the direction you chose.
“Higher” Respondent Answers:
• greed, continued low interest rates, more earnings beats than misses, nobody really expects a china deal, good jobs report, iran will not start shooting,
• monetary policy, jobs reaction
• Mohammed phaka International
• Trend up continues
• The effects of the jobs number, and the prospect of higher flow of goods and services. Plus the dovish stance by the Fed, should cause the indexes to explore new highs. Even if they don’t get the cannabis craze.
• Reaching the price of 3000 should not be in this strong trend problem
• Blockchain, Technology, Internet of things, 5G
“Lower” Respondent Answers:
• Charts SPY options IV and OI
• Big increase on good economic news will be followed a dip as there will be no additional good news Monday.
• Market rise after sharp fall into last hour The pros distributing and 30 year at 2.92%
• waiting for wave 4 to start
• Because of the actions of the past 4 months
• It is overvalued
• It had a key reversal day last week.
• Market is still overbought and needs a downside correction. More earnings due this week.
AD: Need more capital to trade? Click here.
Question #4. What advice would you give and/or what resources would you recommend to someone who is new to trading?
• just trade the s&p, and 3 or four other stocks, but keep an eye on all sectors for a roll over down
• Read Jesse Livermore book. Use Udemy tutorials View all the TastyTrade tutorials Look at FinViz screeners
• talk to a registered investment adviser
• Read everything by the Masters and paper trade for a while.
• Mabarka International trading
• If you are looking for an easy way to make some money – go do something else.
• Paper trade using a checklist
• Go with w\hat you know, learn what you don’t, and invest with the future in mind.
• Stop losing in time, success must to come !
• Pay for a coach, it will be cheaper
• no advice
• Follow @marketminute on twitter.
• Research
Question #5. Additional Comments/Questions/Suggestions?
• keep current, no buy and hold. Keep trailing stops tight.
• economy
• Vantage point software
Join us for this week’s shows:
Crowd Forecast News Episode #223
This week’s show will feature a discussion with the trading experts listed below about the most recent TimingResearch Crowd Forecast Newsletter report, where they think the S&P500 is headed, what they are watching for in the markets currently, and their best trading idea.
Date and Time:
– Monday, May 6th, 2019
– 1PM ET (10AM PT)
Moderator and Guests:
– Michael Guess of DayTradeSafe.com (first time guest!)
– Mark Sachs of RightLineTrading.com
– Jim Kenney of OptionProfessor.com
– Simon Klein of TradeSmart4x.com (moderator)
Analyze Your Trade Episode #76
When you register, you will be prompted to list the top 5 stocks that you are interested in trading. We will list the top 5 from all registrants and our experts will be prepared to offer their opinions on these trades.
Date and Time:
– Tuesday, May 7th, 2019
– 4PM ET (1PM PT)
Moderator and Guests:
– Marina Villatoro of TheTraderChick.com (first time guest!)
– Christian Fromhertz of TribecaTradeGroup.com
– Michael Filighera of LogicalSignals.com (moderator)
Crowd Forecast News Report #292
AD: 5 Experts Share Their Best Money Making Strategies
The new TimingResearch report for the week has been posted, you can download the full PDF report with the link below or you can read the full report in this post below.
Click here to download report in PDF format: TRReport042819.pdf
Question #1. Which direction do you think the S&P500 index will move from this coming Monday’s open to Friday’s close (April 29th to May 3rd)?
The order of possible responses to this question on the survey were randomized for each viewer.)
Higher: 72.2%
Lower: 27.8%
Higher/Lower Difference: 44.4%
Question #2. Rate your confidence in your answer to Question #2 by estimating the probability you have correctly predicted next week’s market move.
Average of All Responses: 66.8%
Average For “Higher” Responses: 65.6%
Average For “Lower” Responses: 70.5%
Higher/Lower Difference: -4.9%
Responses Submitted This Week: 37
52-Week Average Number of Responses: 39.6
TimingResearch Crowd Forecast Prediction: 65% Chance Higher
This prediction is an attempt by the editor of this newsletter to use the full 5 year history of data collected from this project to forecast a probability estimate for whether this week’s sentiment is going to be correct and ultimately what the markets will do this coming week.
Details: Last week’s majority sentiment from the survey was 61.5% Higher, and the Crowd Forecast Indicator prediction was 58% Chance Higher; the S&P500 closed 1.42% Higher for the week. This week’s majority sentiment from the survey is 72.2% Higher with a greater average confidence from those who responded Higher. Similar conditions have occurred 20 times in the previous 291 weeks, with the majority sentiment (Higher) being correct 65% of the time and with an average S&P500 move of 0.09% Higher for the week. Based on that history, the TimingResearch Crowd Forecast Indicator is forecasting a 65% Chance that the S&P500 is going to move Higher this coming week.
Raw Data Page (raw data files include full history spreadsheet and the above charts):
TimingResearch.com/data.
AD: 5 Experts Share Their Best Money Making Strategies
Full Weekly Results (full version of this chart available in the raw data spreadsheet for this week, “Date” field below lists the Monday of the week being predicted).
Overall Sentiment All-Time “Correct” Percentage: 51.6%
Overall Sentiment 52-Week “Correct” Percentage: 58.8%
Overall Sentiment 12-Week “Correct” Percentage: 36.4%
Only the previous 52 weeks of data are shown below, please download the raw data to see the full range of past data.
Weekly Reports Page: TimingResearch.com/reports
Raw Data Page: TimingResearch.com/rawdata
Current Survey Page: TimingResearch.com/currentsurvey
Any feedback: TimingResearch.com/contact
Email Alerts
Make sure you don’t miss all the future reports, show reminders, and bonus offers from TimingResearch, enter your email here:
By signing up you agree to receive newsletter and alert emails. You can unsubscribe at any time. Privacy Policies
NOTE: The following open-ended answers are solely the opinions of the anonymous respondents to this survey. Responses are mostly unedited, but some have been reformatted slightly for to make them easier to read. Some irrelevant responses (e.g. “none”), or anything obviously fake, or copy and pasted responses have been omitted. All-caps responses have been changed to all lowercase. All responses for each week, unedited, are available in the raw data spreadsheets at TimingResearch.com/data.
Question #3. For your answer to Question #1, please share what specific reason(s) you think the S&P500 will be heading the direction you chose.
“Higher” Respondent Answers:
• Momentum
• trend
• breakout
• Better earnings
• Banking is still reasonably OK and the China/U.S. trade deal seams to be moving forward.
• The trend is still higher
• We are in wave B. By FB retrac. wave B will be minim. 127% of wave A. That is, the SP will reach the 3100 in the short term
• Market closed at all time high
• Momentum
• Usually new highs all around hit the same week to suck in other longs before a correction. Statistically higher first week of May as well. New highs will undoubtedly bring choruses of “Sell in May doesn’t work anymore” just before a drop!
• more good earnings reports
• Positive results from Earnings season
• The market has been reacting positively to recent earnings/revenue reports. The upward trend is likely to continue.
• Still best six months of year historically
• MO & Earnings
• Earnings push the S&P up a bit
• Trend up continues
• Trend continues
• earnings still to come
“Lower” Respondent Answers:
• Selloffs in individual stocks continues
• stocks selling off individually
• Overbought
• 80% of double tops as in s/p..dow qqq,,usually sends them back down
• waiting to start wave 4
• The market remains overbought and needs a downside correction. More earnings reports are due this week.
• IWM nonconfirmation
• People can’t continue to be irrational forever.
AD: 5 Experts Share Their Best Money Making Strategies
Question #4. What procedures do you use to monitor and evaluate your trading results and progress over time?
• PFE, GM, MRK, MA, COP, BP, QCOM, CVS and a few others.
• technical analysis-1-yr daily chart
• broker stats
• Just the chart appearance itself, moving average crossovers, sometimes the VIX gives indication of market direction.
• Stop loss. First hour tracking. Periodic visual checkups during the day. Plus I read market related info about five to six hours a day. My goal is to keep my head in the market flow without giving in to emotional basis.
• Equity curve
• P&L
• Fibonacci distribution to help me decide when to buy & sell. Sell on way up & buy on way down
• move avg
• Net worth tracking
• watch news track stocks I read your poll results i think it shows the crowd and the crowd is wrong at market tops this is nearing a market top
• read
• Download trade info and track using python.
• Account balance monitor. Win/loss ratio
• Fundemantal
• P/L and overall account value. Critical look at trades and what happened afterwards–did I stave off more losses? Leave too much on the table? Try to be objective without beating myself up…easier said than done!
• Price & Profits
• Notebook
Question #5. Additional Comments/Questions/Suggestions?
• above
• To ALL new traders. Trade small and trade often! Do post trade examination of every trade.
• sell gold
Join us for this week’s shows:
Crowd Forecast News Episode #222
This week’s show will feature a discussion with the trading experts listed below about the most recent TimingResearch Crowd Forecast Newsletter report, where they think the S&P500 is headed, what they are watching for in the markets currently, and their best trading idea.
Date and Time:
– Monday, April 29th, 2019
– 1PM ET (10AM PT)
Moderator and Guests:
– Jim Kenney of OptionProfessor.com
– Mark Sachs of RightLineTrading.com
– Jake Bernstein of Trade-Futures.com (first time guest!)
Analyze Your Trade Episode #75
When you register, you will be prompted to list the top 5 stocks that you are interested in trading. We will list the top 5 from all registrants and our experts will be prepared to offer their opinions on these trades.
Date and Time:
– Tuesday, April 30th, 2019
– 4PM ET (1PM PT)
Moderator and Guests:
– Neil Batho of TraderReview.net
– Bryan Klindworth of AlphaShark.com
– Mike Pisani of AlphaShark.com & SmartOptionTrading.com (moderator)
AD: 5 Experts Share Their Best Money Making Strategies
Crowd Forecast News Report #290
AD: Watch the World Premiere of Money Revealed
The new TimingResearch report for the week has been posted, you can download the full PDF report with the link below or you can read the full report in this post below.
Click here to download report in PDF format: TRReport041419.pdf
Question #1. Which direction do you think the S&P500 index will move from this coming Monday’s open to Friday’s close (April 15th to 19th)?
The order of possible responses to this question on the survey were randomized for each viewer.)
Higher: 63.9%
Lower: 36.1%
Higher/Lower Difference: 27.8%
Question #2. Rate your confidence in your answer to Question #2 by estimating the probability you have correctly predicted next week’s market move.
Average of All Responses: 65.8%
Average For “Higher” Responses: 67.0%
Average For “Lower” Responses: 63.9%
Higher/Lower Difference: 3.1%
Responses Submitted This Week: 38
52-Week Average Number of Responses: 40.2
TimingResearch Crowd Forecast Prediction: 59% Chance Higher
This prediction is an attempt by the editor of this newsletter to use the full 5 year history of data collected from this project to forecast a probability estimate for whether this week’s sentiment is going to be correct and ultimately what the markets will do this coming week.
Details: Last week’s majority sentiment from the survey was 61.1% Higher, and the Crowd Forecast Indicator prediction was 57% Chance Lower; the S&P500 closed 1.55% Higher for the week. This week’s majority sentiment from the survey is 63.9% Higher with a greater average confidence from those who responded Higher. Similar conditions have occurred 58 times in the previous 289 weeks, with the majority sentiment (Higher) being correct 59% of the time and with an average S&P500 move of 0.07% Higher for the week. Based on that history, the TimingResearch Crowd Forecast Indicator is forecasting a 59% Chance that the S&P500 is going to move Higher this coming week.
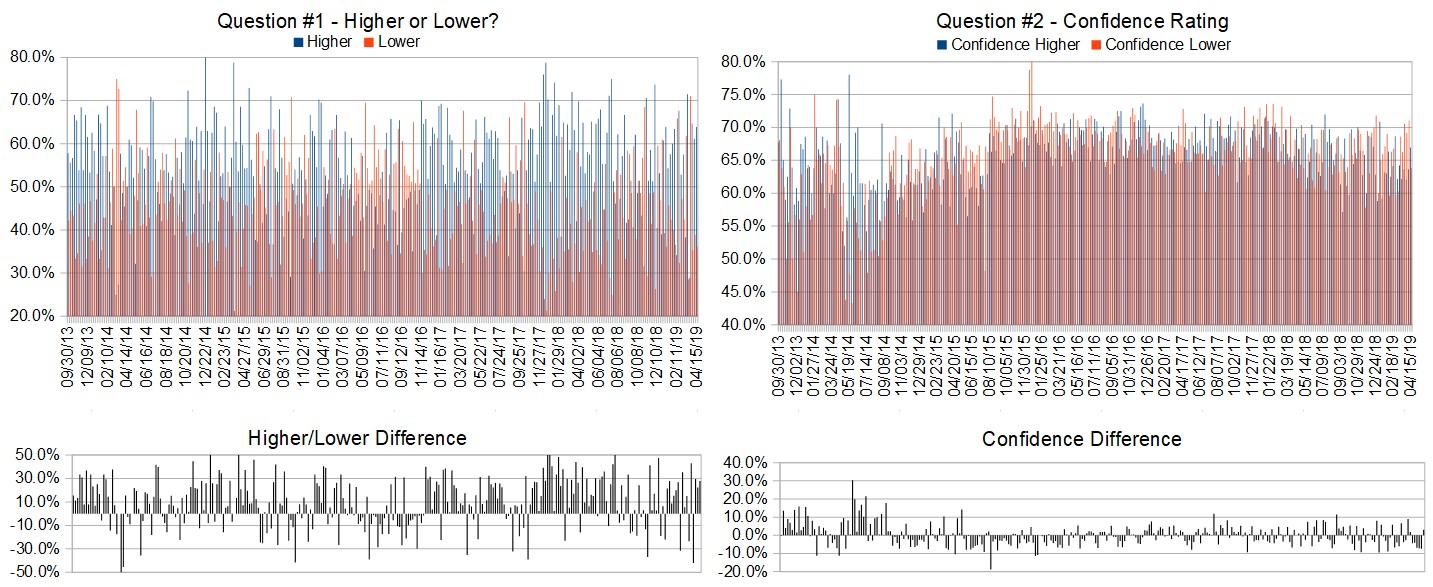
Raw Data Page (raw data files include full history spreadsheet and the above charts):
TimingResearch.com/data.
AD: Watch the World Premiere of Money Revealed
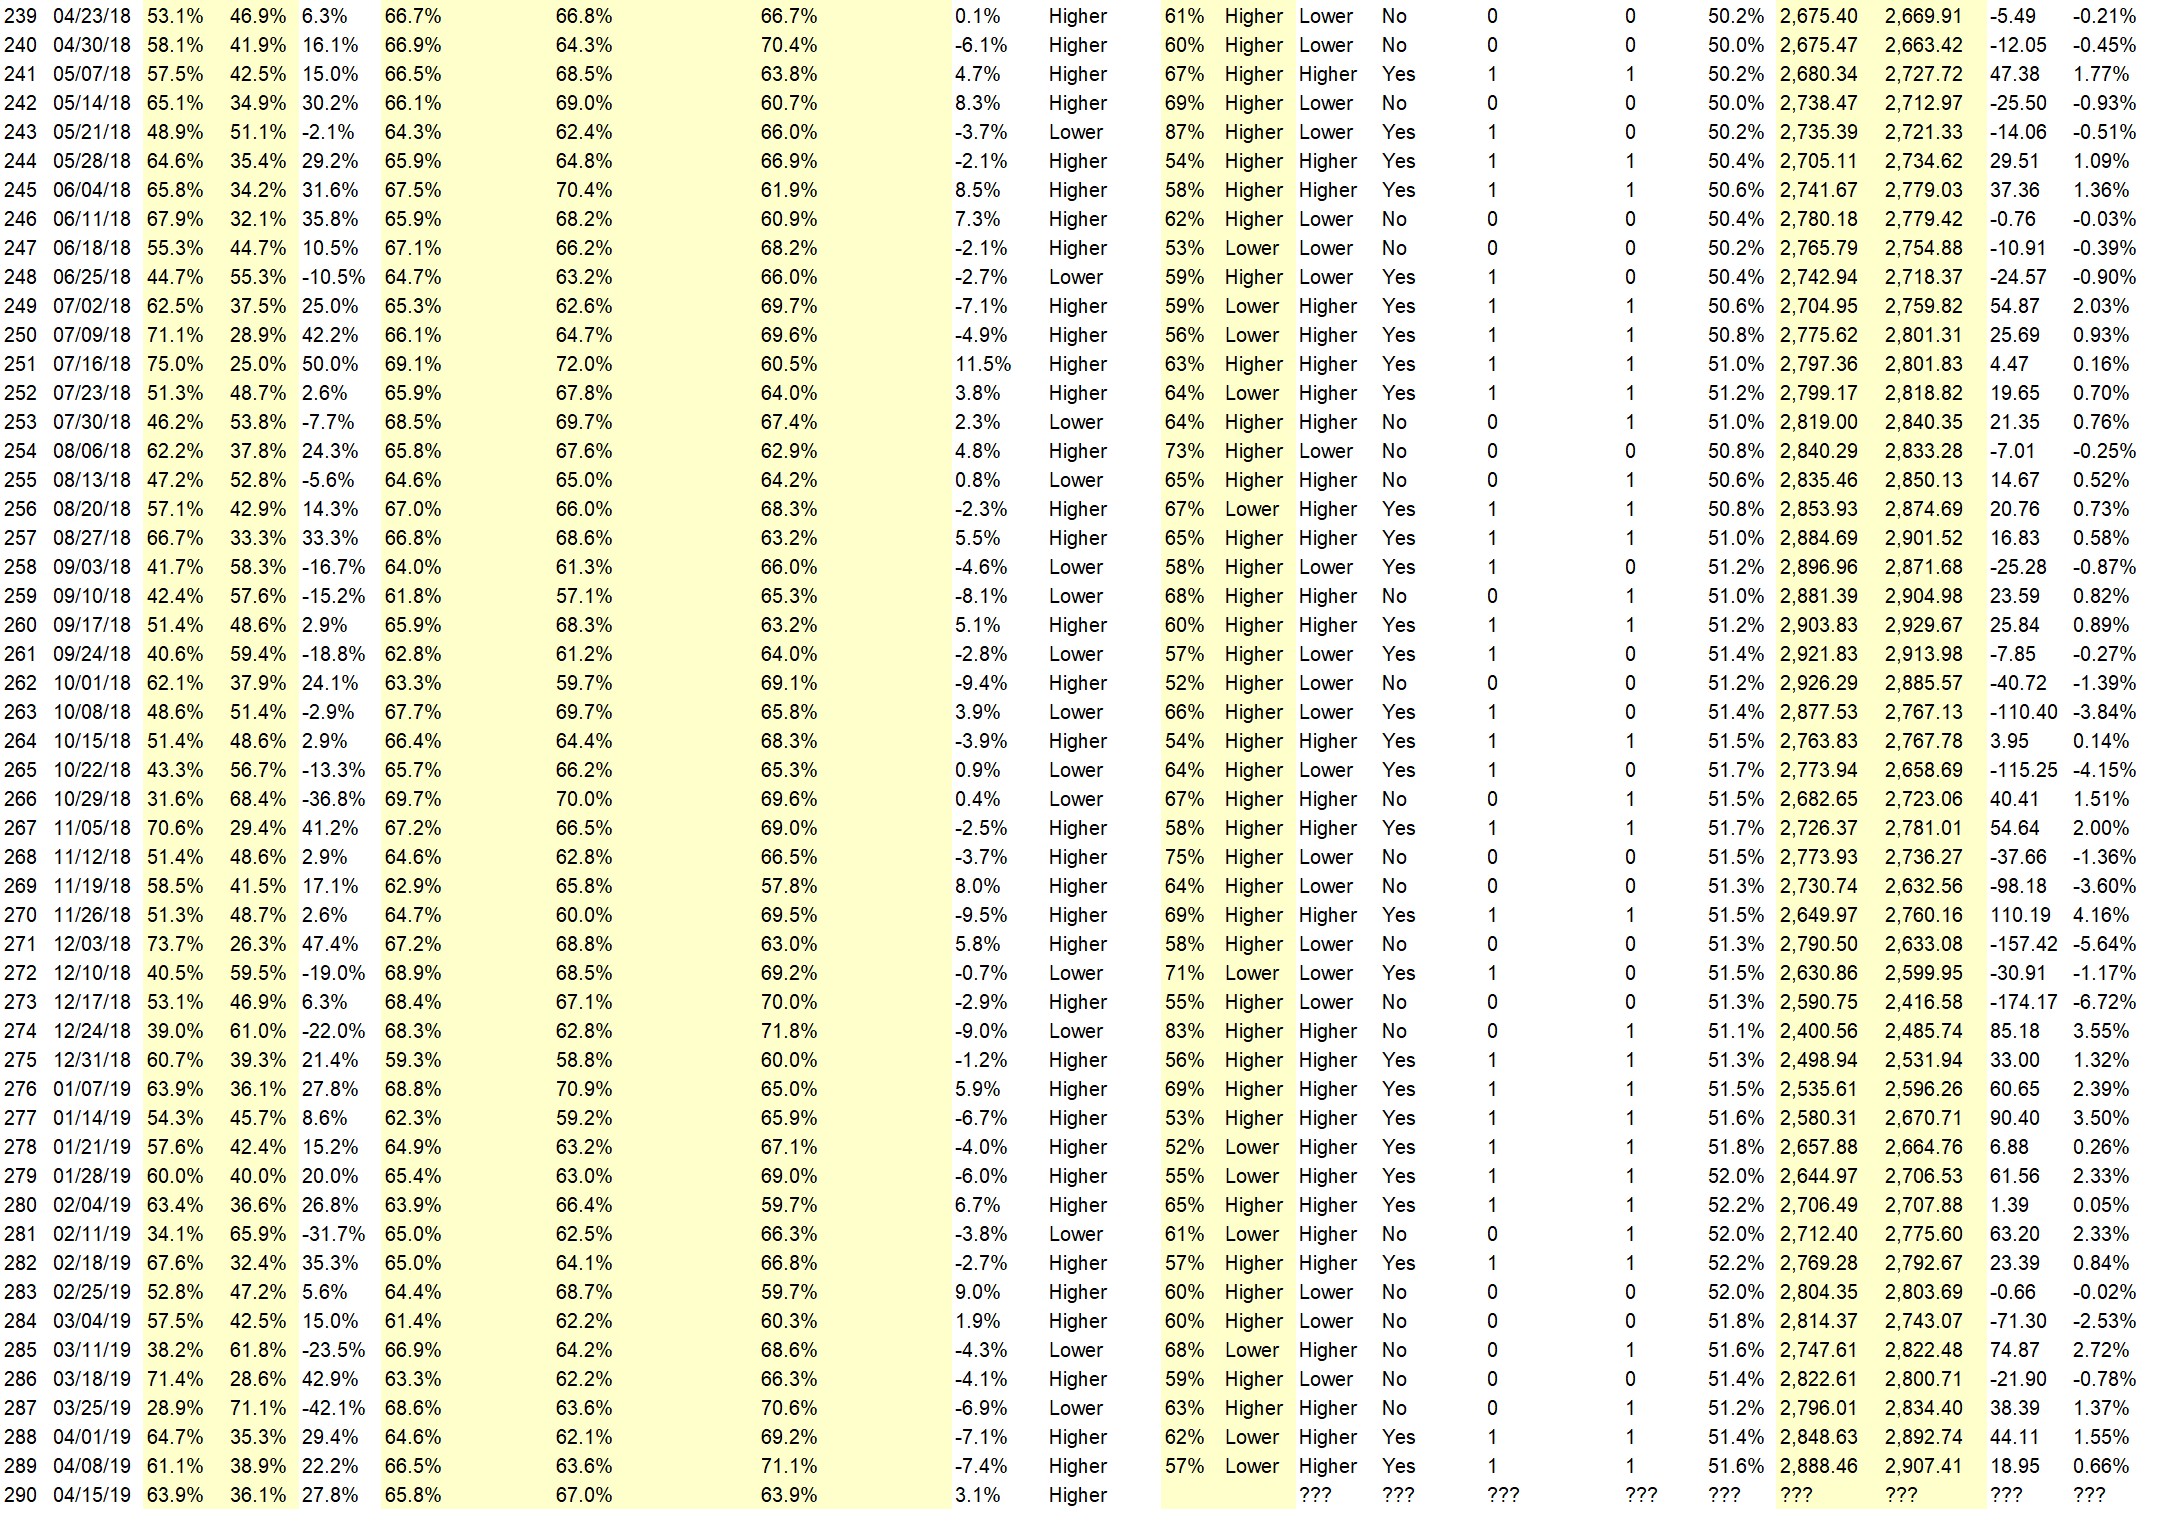
Full Weekly Results (full version of this chart available in the raw data spreadsheet for this week, “Date” field below lists the Monday of the week being predicted).
Overall Sentiment All-Time “Correct” Percentage: 51.6%
Overall Sentiment 52-Week “Correct” Percentage: 56.9%
Overall Sentiment 12-Week “Correct” Percentage: 45.5%
Only the previous 52 weeks of data are shown below, please download the raw data to see the full range of past data.
Weekly Reports Page: TimingResearch.com/reports
Raw Data Page: TimingResearch.com/rawdata
Current Survey Page: TimingResearch.com/currentsurvey
Any feedback: TimingResearch.com/contact
Email Alerts
Make sure you don’t miss all the future reports, show reminders, and bonus offers from TimingResearch, enter your email here:
By signing up you agree to receive newsletter and alert emails. You can unsubscribe at any time. Privacy Policies
NOTE: The following open-ended answers are solely the opinions of the anonymous respondents to this survey. Responses are mostly unedited, but some have been reformatted slightly for to make them easier to read. Some irrelevant responses (e.g. “none”), or anything obviously fake, or copy and pasted responses have been omitted. All-caps responses have been changed to all lowercase. All responses for each week, unedited, are available in the raw data spreadsheets at TimingResearch.com/data.
Question #3. For your answer to Question #1, please share what specific reason(s) you think the S&P500 will be heading the direction you chose.
“Higher” Respondent Answers:
• st trend
• Easter holiday week
• The trend is still our friend
• To the highest price from early October is a bit. The trend is convincingly LONG.
• Better than expected job growth.
• I recently added to my SDS long and SPY put hedges, so the market should skyrocket!
• bulls are in control
• Still best six months of the year and earnings should be ok
• More good bank earnings should help this week. Expecting the market to grind higher.
• Because earnings estimates have been reduced drastically, most companies will handily best the estimates, thus driving the S&P another leg higher.
• trend is up
• Trend plus Financials earnings
“Lower” Respondent Answers:
• The China agreement will spark sellers panick
• Taxes maybe keep people busy from buying that is support maybe sometimes maybe some
• A recession is in the forecast.
• ITK
• Holiday shortened week should produce a pause for the current march to new highs allowing a small decline back towards 2880 – 2900
• Time to consolidate
• elliott wave formation
• The market is overbought and earnings season is beginning.
• lower earnings
• overbought
ADVERTISEMENT
36 ways to get rich – watch the movie
Imagine if you just had $10-$20k per month rolling in… Just to take care of you… And you didn’t have to lift a finger to keep it flowing.
That—and more—is the reality for the wealthy because they know how to create passive income while the rest of us trade time for money.
That’s just one of the things you’ll learn about—at not cost—right here:
>> Watch the Money Revealed Trailer <<
Question #4. What indicator influences your trading the most?
• RSI
• the wrong ones
• MAs
• chart
• Exponential & Simple moving averages, RSI, & volume.
• DIVERGENCES
• I use 3, cci, rsi and ma
• ma200
• Keltner channels
• Economic
• Elliott Wave
• RSI
• Rsi
• Interest rates
• Price-volume action and trend channels.
• Charts and MAs.
• S&P 500 Index, Russell 2000 Index
• Elliott Wave Theory and Stochastic/Momentum Index.
• SMA or DMA (10,20,50,200)
• MACD
• The bull will flood the market with commodities to service the consumers before the summer. The bear market will appear for the bartering agreements.
• 8 MA & the IC
Question #5. Additional Comments/Questions/Suggestions?
• The Bitcoins have declined as negotiable instruments.
Join us for this week’s shows:
Crowd Forecast News Episode #220
This week’s show will feature a discussion with the trading experts listed below about the most recent TimingResearch Crowd Forecast Newsletter report, where they think the S&P500 is headed, what they are watching for in the markets currently, and their best trading idea.
Date and Time:
– Monday, April 15th, 2019
– 1PM ET (10AM PT)
Moderator and Guests:
– Mark Sachs of RightLineTrading.com
– A.J. Brown of TradingTrainer.com
– Bennett McDowell of TradersCoach.com
– Dave Landry of DaveLandry.com (moderator)
Analyze Your Trade Episode #73
When you register, you will be prompted to list the top 5 stocks that you are interested in trading. We will list the top 5 from all registrants and our experts will be prepared to offer their opinions on these trades.
Date and Time:
– Tuesday, April 16th, 2019
– 4:30PM ET (1:30PM PT)
Moderator and Guests:
– John Thomas of MadHedgeFundTrader.com
– Larry Gaines of PowerCycleTrading.com
– Bryan Klindworth of AlphaShark.com
– Jim Kenney of OptionProfessor.com (moderator)
ADVERTISEMENT
36 ways to get rich – watch the movie
Imagine if you just had $10-$20k per month rolling in… Just to take care of you… And you didn’t have to lift a finger to keep it flowing.
That—and more—is the reality for the wealthy because they know how to create passive income while the rest of us trade time for money.
That’s just one of the things you’ll learn about—at not cost—right here:
Crowd Forecast News Report #289
AD: 6 days + 70 world-class wealth experts = 1 fantastic event (click here).
The new TimingResearch report for the week has been posted, you can download the full PDF report with the link below or you can read the full report in this post below.
Click here to download report in PDF format: TRReport040719.pdf
Question #1. Which direction do you think the S&P500 index will move from this coming Monday’s open to Friday’s close (April 8th to 12th)?
The order of possible responses to this question on the survey were randomized for each viewer.)
Higher: 61.1%
Lower: 38.9%
Higher/Lower Difference: 22.2%
Question #2. Rate your confidence in your answer to Question #2 by estimating the probability you have correctly predicted next week’s market move.
Average of All Responses: 66.5%
Average For “Higher” Responses: 63.6%
Average For “Lower” Responses: 71.1%
Higher/Lower Difference: -7.4%
Responses Submitted This Week: 38
52-Week Average Number of Responses: 40.3
TimingResearch Crowd Forecast Prediction: 57% Chance Lower
This prediction is an attempt by the editor of this newsletter to use the full 5 year history of data collected from this project to forecast a probability estimate for whether this week’s sentiment is going to be correct and ultimately what the markets will do this coming week.
Details: Last week’s majority sentiment from the survey was 64.7% Lower, and the Crowd Forecast Indicator prediction was 62% Chance Lower; the S&P500 closed 1.55% Higher for the week. This week’s majority sentiment from the survey is 61.1% Higher with a greater average confidence from those who responded Lower. Similar conditions have occurred 14 times in the previous 288 weeks, with the majority sentiment (Higher) being correct 43% of the time and with an average S&P500 move of 0.72% Lower for the week. Based on that history, the TimingResearch Crowd Forecast Indicator is forecasting a 57% Chance that the S&P500 is going to move Lower this coming week.
Raw Data Page (raw data files include full history spreadsheet and the above charts):
TimingResearch.com/data.
Full Weekly Results (full version of this chart available in the raw data spreadsheet for this week, “Date” field below lists the Monday of the week being predicted).
Overall Sentiment All-Time “Correct” Percentage: 51.4%
Overall Sentiment 52-Week “Correct” Percentage: 56.9%
Overall Sentiment 12-Week “Correct” Percentage: 45.5%
Only the previous 52 weeks of data are shown below, please download the raw data to see the full range of past data.
Weekly Reports Page: TimingResearch.com/reports
Raw Data Page: TimingResearch.com/rawdata
Current Survey Page: TimingResearch.com/currentsurvey
Any feedback: TimingResearch.com/contact
Email Alerts
Make sure you don’t miss all the future reports, show reminders, and bonus offers from TimingResearch, enter your email here:
By signing up you agree to receive newsletter and alert emails. You can unsubscribe at any time. Privacy Policies
NOTE: The following open-ended answers are solely the opinions of the anonymous respondents to this survey. Responses are mostly unedited, but some have been reformatted slightly for to make them easier to read. Some irrelevant responses (e.g. “none”), or anything obviously fake, or copy and pasted responses have been omitted. All-caps responses have been changed to all lowercase. All responses for each week, unedited, are available in the raw data spreadsheets at TimingResearch.com/data.
Question #3. For your answer to Question #1, please share what specific reason(s) you think the S&P500 will be heading the direction you chose.
“Higher” Respondent Answers:
• Economic reasons maybe I think some
• For the 2nd week in a row it’s been going up. keep going up baby!!!
• Higher oil prices and the continued increase o small cap stocks.
• Historically best six months
• Broke resistance and should be testing close to the all time high .. Volume is low and there is not much conviction after breaking resistance .. So it is a 2 blade knife .. but the bias so far is still to the Upside.
• Seasonality as researched by Norman Fasback in the early 1990s back to 1927 which showed that ALL of the market’s gains occurred on the last 2 trading days of the old month and the first 10 trading days of the old month! The rest of each month netted 0! Next week has trading day #6 – #10 for April. High probability, NOT guaranteed!
• Bullish momentum
• Good news
• weak trend will continue.
• go with the trend…until it ends
• history and world situation
• The S&P continues to drive upwards (no down days last week). It looks like it’s targeting the high from last September; and I wouldn’t bet against it getting there.-
• General improvement in global economic growth.
• trend is up
• Low Interest Rates
• Trend
“Lower” Respondent Answers:
• Wednesday is an important astrological turndate
• Time to re-group
• because -wil hit 2900 and re-test down.
• elliott wave 4 may be beginning
• Market is overbought. Market needs to back and fill to get healthy.
• Overbought, time for a break
• The 💰 has flowed in 1 thing unexpected and the herd will stampede 0ut
• Volatile markets lower trading due to uncertainty and global economic problems.
• Chart looks like a climactic top.
AD: 6 days + 70 world-class wealth experts = 1 fantastic event (click here).
Question #4. What trading-related questions or topics would you like the experts to discuss on future episodes of the weekly Crowd Forecast News show? (The show is off this coming week, but back on April 15th.)
• How useful is ” Sell in May & go away ?” #2. What resources can the DIY investor use to gauge the coming of a recession and how to prepare for one ?
• Levels Up and down ..
• No preference
• No reference
• Global macroeconomic issues managing volatile market conditions
• Trading market turning points
• Topping patterns
• trading vxxb weekly options
• Money management — need to consider 3 factors – risk reward probability. But how the heck to decide on probability? What if always guestimated probability to be 50%, then how to apply money management?
• The “Holy Grail” of trading
• Simple Trading Strategy/Systems for beginers
• Small caps and international markets such as China.
• Profit
• Option deltas
Question #5. Additional Comments/Questions/Suggestions?
• Keep up the good work
• LOL
• Keep up the good analysis !!
• what is the performance of your survey’s?
Join us for this week’s shows:
Crowd Forecast News Episode #220
This week’s show will feature a discussion with the trading experts listed below about the most recent TimingResearch Crowd Forecast Newsletter report, where they think the S&P500 is headed, what they are watching for in the markets currently, and their best trading idea.
Date and Time:
– Monday, April 15th, 2019
– 1PM ET (10AM PT)
Moderator and Guests:
– A.J. Brown of TradingTrainer.com
– Mark Sachs of RightLineTrading.com
– Bennett McDowell of TradersCoach.com
Analyze Your Trade Episode #73
When you register, you will be prompted to list the top 5 stocks that you are interested in trading. We will list the top 5 from all registrants and our experts will be prepared to offer their opinions on these trades.
Date and Time:
– Tuesday, April 16th, 2019
– 4:30PM ET (1:30PM PT)
Moderator and Guests:
– John Thomas of MadHedgeFundTrader.com
– Jim Kenney of OptionProfessor.com
– Larry Gaines of PowerCycleTrading.com
AD: 6 days + 70 world-class wealth experts = 1 fantastic event (click here).
Crowd Forecast News Report #288
AD: Get Trial Access To 3 Top Trading Services
The new TimingResearch report for the week has been posted, you can download the full PDF report with the link below or you can read the full report in this post below.
Click here to download report in PDF format: TRReport033119.pdf
Question #1. Which direction do you think the S&P500 index will move from this coming Monday’s open to Friday’s close (April 1st and 5th)?
The order of possible responses to this question on the survey were randomized for each viewer.)
Higher: 64.7%
Lower: 35.3%
Higher/Lower Difference: 29.4%
Question #2. Rate your confidence in your answer to Question #2 by estimating the probability you have correctly predicted next week’s market move.
Average of All Responses: 64.6%
Average For “Higher” Responses: 62.1%
Average For “Lower” Responses: 69.2%
Higher/Lower Difference: -7.1%
Responses Submitted This Week: 38
52-Week Average Number of Responses: 40.5
TimingResearch Crowd Forecast Prediction: 62% Chance Lower
This prediction is an attempt by the editor of this newsletter to use the full 5 year history of data collected from this project to forecast a probability estimate for whether this week’s sentiment is going to be correct and ultimately what the markets will do this coming week.
Details: Last week’s majority sentiment from the survey was 71.1% Lower, and the Crowd Forecast Indicator prediction was 63% Chance Higher; the S&P500 closed 1.37% Higher for the week. This week’s majority sentiment from the survey is 64.7% Higher with a greater average confidence from those who responded Lower. Similar conditions have occurred 13 times in the previous 287 weeks, with the majority sentiment (Higher) being correct 38% of the time and with an average S&P500 move of 0.89% Lower for the week. Based on that history, the TimingResearch Crowd Forecast Indicator is forecasting a 62% Chance that the S&P500 is going to move Lower this coming week.
Raw Data Page (raw data files include full history spreadsheet and the above charts):
TimingResearch.com/data.
AD: Get Trial Access To 3 Top Trading Services
Full Weekly Results (full version of this chart available in the raw data spreadsheet for this week, “Date” field below lists the Monday of the week being predicted).
Overall Sentiment All-Time “Correct” Percentage: 51.2%
Overall Sentiment 52-Week “Correct” Percentage: 56.9%
Overall Sentiment 12-Week “Correct” Percentage: 45.5%
Only the previous 52 weeks of data are shown below, please download the raw data to see the full range of past data.
Weekly Reports Page: TimingResearch.com/reports
Raw Data Page: TimingResearch.com/rawdata
Current Survey Page: TimingResearch.com/currentsurvey
Any feedback: TimingResearch.com/contact
Email Alerts
Make sure you don’t miss all the future reports, show reminders, and bonus offers from TimingResearch, enter your email here:
By signing up you agree to receive newsletter and alert emails. You can unsubscribe at any time. Privacy Policies
NOTE: The following open-ended answers are solely the opinions of the anonymous respondents to this survey. Responses are mostly unedited, but some have been reformatted slightly for to make them easier to read. Some irrelevant responses (e.g. “none”), or anything obviously fake, or copy and pasted responses have been omitted. All-caps responses have been changed to all lowercase. All responses for each week, unedited, are available in the raw data spreadsheets at TimingResearch.com/data.
Question #3. For your answer to Question #1, please share what specific reason(s) you think the S&P500 will be heading the direction you chose.
“Higher” Respondent Answers:
• historically best six months of the year
• Economy is improving
• Trend continues
• Can’t tell for sure where we’re going from here.
• Continued retracement
• Elliott Wave 4 Buys
• Friday’s’ surge suggests the market likes the chances of the US-China trade negotiations; and doesn’t worry much about the inverted yields.
• Momentum & China Trade deal
• economy.
• There is no selling almost and keep pumping with low volume They dont want to sell
• trend is upward on Basic stocks AMT, DIS etc. Macro a little different but trying to push higher unless some terrorist event
• higher low last week
• The trend continues
• seasonal
“Lower” Respondent Answers:
• I hate Trump
• S&P should rest
• cycle
• because rusesll is not keeping up with s/p-overbought -complacency-high-mrkt sideways 2-weeks-drift loweer
• S&P at upper resistance
• The market is still overbought and acting tired. Need more downside action.
• I refuse to go into any detail except to note that the writing is already on the wall. A market shake-out is coming. No one can predict with any certainty when that begins happening, but the circumstances for it’s inevitable occurrence are setting it all up. It’snot a question of IF.
• Market completing a double t0p b4 summet
• Failure of ES to stay above 2900 level.
AD: Get Trial Access To 3 Top Trading Services
Question #4. What type(s) of trading do you specialize in or focus on? How did you come to that decision?
• day trading cause it works
• Dividend
• Arbitrage of individual stocks who fall for unreasonable reasons. They generally rebound. Need tight stops though. I do it because these generally cause a sudden intense movement.
• Index options,I find it’s easier to follow and predict.
• options – elliott wave and other indicators
• Swing trading stocks. My schedule doesn’t allow for day trading; and longer term trading is too slow for me.
• selling BPS. Theta
• Options for the most part. Allows me to control large number of shares at a fraction for the share price.
• Puts and Calls hedging on stocks at earning dates or event. i have noticed strength upward bias
• Day trading as I can sleep well having closed very large positions.
• Futures
• futures
• Options
• options
• daytradingy technicals -stack moving avgs.mr
• options, less capital required
• Long term commodity etfs
• Eminis S&P because of liquidity and focus on researching on one name instead of several names like stocks.
Question #5. Additional Comments/Questions/Suggestions?
• Love you guys
Join us for this week’s shows:
Crowd Forecast News Episode #219
This week’s show will feature a discussion with the trading experts listed below about the most recent TimingResearch Crowd Forecast Newsletter report, where they think the S&P500 is headed, what they are watching for in the markets currently, and their best trading idea.
Date and Time:
– Monday, April 1st, 2019
– 1PM ET (10AM PT)
Moderator and Guests:
– Mark Sachs of RightLineTrading.com
– Jim Kenney of OptionProfessor.com
– Simon Klein of TradeSmart4x.com (moderator)
Analyze Your Trade Episode #72
When you register, you will be prompted to list the top 5 stocks that you are interested in trading. We will list the top 5 from all registrants and our experts will be prepared to offer their opinions on these trades.
Date and Time:
– Tuesday, April 2nd, 2019
– 4:30PM ET (1:30PM PT)
Moderator and Guests:
– Bryan Klindworth of AlphaShark.com (first time guest!)
– Jerremy Newsome of RealLifeTrading.com
– E. Matthew “Whiz” Buckley of TopGunOptions.com (moderator)
AD: Get Trial Access To 3 Top Trading Services
Crowd Forecast News Report #287
The new TimingResearch report for the week has been posted, you can download the full PDF report with the link below or you can read the full report in this post below.
Click here to download report in PDF format: TRReport032419.pdf
Full web version of the report available below the ad.
Smooth Markets Never Made a Skilled Investor
I see a lot of panicked traders and worried investors right now. And with good cause because we’re not convinced that the turbulence in the markets isn’t set to continue for a while.
But there’s one guy we know, Jeff, who looks pretty relaxed right now. You see, Jeff’s investing approach can pinpoint stocks and profit from them no matter whether the market is soaring or nose-diving.
Question #1. Which direction do you think the S&P500 index will move from this coming Monday’s open to Friday’s close (March 25th to 29th)?
The order of possible responses to this question on the survey were randomized for each viewer.)
Higher: 28.9%
Lower: 71.1%
Higher/Lower Difference: -42.1%
Question #2. Rate your confidence in your answer to Question #2 by estimating the probability you have correctly predicted next week’s market move.
Average of All Responses: 68.6%
Average For “Higher” Responses: 63.6%
Average For “Lower” Responses: 70.6%
Higher/Lower Difference: -6.9%
Responses Submitted This Week: 41
52-Week Average Number of Responses: 40.7
TimingResearch Crowd Forecast Prediction: 63% Chance Higher
This prediction is an attempt by the editor of this newsletter to use the full 5 year history of data collected from this project to forecast a probability estimate for whether this week’s sentiment is going to be correct and ultimately what the markets will do this coming week.
Details: Last week’s majority sentiment from the survey was 71.4% Higher, and the Crowd Forecast Indicator prediction was 59% Chance Higher; the S&P500 closed 0.78% Lower for the week. This week’s majority sentiment from the survey is 71.1% Lower with a greater average confidence from those who responded Lower. Similar conditions have occurred 16 times in the previous 286 weeks, with the majority sentiment being correct 63% of the time and with an average S&P500 move of 0.19% Higher for the week. Based on that history, the TimingResearch Crowd Forecast Indicator is forecasting a 63% Chance that the S&P500 is going to move Higher this coming week.
Raw Data Page (raw data files include full history spreadsheet and the above charts):
TimingResearch.com/data.
AD: 6 days + 70 world-class wealth experts = 1 fantastic event (click here).
Full Weekly Results (full version of this chart available in the raw data spreadsheet for this week, “Date” field below lists the Monday of the week being predicted).
Overall Sentiment All-Time “Correct” Percentage: 51.4%
Overall Sentiment 52-Week “Correct” Percentage: 56.9%
Overall Sentiment 12-Week “Correct” Percentage: 54.5%
Only the previous 52 weeks of data are shown below, please download the raw data to see the full range of past data.

Weekly Reports Page: TimingResearch.com/reports
Raw Data Page: TimingResearch.com/rawdata
Current Survey Page: TimingResearch.com/currentsurvey
Any feedback: TimingResearch.com/contact
Email Alerts
Make sure you don’t miss all the future reports, show reminders, and bonus offers from TimingResearch, enter your email here:
By signing up you agree to receive newsletter and alert emails. You can unsubscribe at any time. Privacy Policies
NOTE: The following open-ended answers are solely the opinions of the anonymous respondents to this survey. Responses are mostly unedited, but some have been reformatted slightly for to make them easier to read. Some irrelevant responses (e.g. “none”), or anything obviously fake, or copy and pasted responses have been omitted. All-caps responses have been changed to all lowercase. All responses for each week, unedited, are available in the raw data spreadsheets at TimingResearch.com/data.
Question #3. For your answer to Question #1, please share what specific reason(s) you think the S&P500 will be heading the direction you chose.
“Higher” Respondent Answers:
• Technically looks like to recover from friday’s low
• More positive comments in the news.
• end of quarter window dressing by institutions
• Unknown Mueller report is now known
• Correction
• Big impulse down, moderate + pullback.
“Lower” Respondent Answers:
• Pullback due to political/economic concerns
• technical.
• End of month rotation will cause the S & P to slide down.
• The uncertainty and noise around the completion of the Mueller invstigation
• technical analysis shows me a top has occurred
• Market will take a rest.
• below spx 2800 lower
• a reversal
• The Fed, which has lots of data to study, knows that they won’t raise rates this year, because they are confident that the economy is in a slowing phase. Also, the S&P chart looks like a triple top.
• After hitting the high of 2860 on S&P which was a known strong resistance point, the rally appears to have temporarily faded. It broke down through support at 2818, and is close to the next resistance of 2800. If it does not go up from here, we can expect the market to roll over here.
• Downside correction that started last week will continue.
• quiet period for buybacks weak internals support broken window dressing a difficult task
• Fridays drop
• It completed a reversal pattern on friday + fundamental factors like a slowing world economy.
• Engulfing at previous level of resistance.
• possible lower high on weekly chart
• The children will come in for lunch and not like what they are being served.
ADVERTISEMENT
Smooth Markets Never Made a Skilled Investor
I see a lot of panicked traders and worried investors right now. And with good cause because we’re not convinced that the turbulence in the markets isn’t set to continue for a while.
But there’s one guy we know, Jeff, who looks pretty relaxed right now. You see, Jeff’s investing approach can pinpoint stocks and profit from them no matter whether the market is soaring or nose-diving.
Question #4. What sort of hedging or portfolio protection strategies do you implement in your trading?
• Using options
• puts
• I sell that’s it
• Securities
• SDS options
• Stops
• Buy shunned winners.
• Buy puts.
• stops
• I used to in the past, but my timing was not correct, and I have lost money. But tomorrow I might buy some inverse SPY etf.
• I sell at mental stopped
• put spreads
• Debit spreads
• Use of multiple protective option strategies
• VXXB weekly calls -been working -atm.
• QQQ puts.
• inverse etfs
Question #5. Additional Comments/Questions/Suggestions?
• Mueller says no more indictments and the market will head to 2900
• If I knew any thing about markets, I’d be rich, which I ain’t.
• Please discuss how much percentage you expect the pullback to be. Is it safe to say it might be about 5% from the recent high of 2860? Thanks.
AD: 6 days + 70 world-class wealth experts = 1 fantastic event (click here).
Join us for this week’s shows:
Crowd Forecast News Episode #218
This week’s show will feature a discussion with the trading experts listed below about the most recent TimingResearch Crowd Forecast Newsletter report, where they think the S&P500 is headed, what they are watching for in the markets currently, and their best trading idea.
Date and Time:
– Monday, March 25th, 2019
– 1PM ET (10AM PT)
Moderator and Guests:
– Bennett McDowell of TradersCoach.com
– Jim Kenney of OptionProfessor.com
– John Thomas of MadHedgeFundTrader.com
Analyze Your Trade Episode #71
When you register, you will be prompted to list the top 5 stocks that you are interested in trading. We will list the top 5 from all registrants and our experts will be prepared to offer their opinions on these trades.
Date and Time:
– Tuesday, March 26th, 2019
– 4:30PM ET (1:30PM PT)
Moderator and Guests:
– Larry Gaines of PowerCycleTrading.com
– Andrew Keene of AlphaShark.com
– E. Matthew “Whiz” Buckley of TopGunOptions.com (moderator)
ADVERTISEMENT
Smooth Markets Never Made a Skilled Investor
I see a lot of panicked traders and worried investors right now. And with good cause because we’re not convinced that the turbulence in the markets isn’t set to continue for a while.
But there’s one guy we know, Jeff, who looks pretty relaxed right now. You see, Jeff’s investing approach can pinpoint stocks and profit from them no matter whether the market is soaring or nose-diving.
Crowd Forecast News Report #286
The new TimingResearch report for the week has been posted, you can download the full PDF report with the link below or you can read the full report in this post below.
Click here to download report in PDF format: TRReport031718.pdf
Question #1. Which direction do you think the S&P500 index will move from this coming Monday’s open to Friday’s close (March 18th to 22nd)?
The order of possible responses to this question on the survey were randomized for each viewer.)
Higher: 71.4%
Lower: 28.6%
Higher/Lower Difference: 42.9%
Question #2. Rate your confidence in your answer to Question #2 by estimating the probability you have correctly predicted next week’s market move.
Average of All Responses: 63.3%
Average For “Higher” Responses: 62.2%
Average For “Lower” Responses: 66.3%
Higher/Lower Difference: -4.1%
Responses Submitted This Week: 46
52-Week Average Number of Responses: 40.9
TimingResearch Crowd Forecast Prediction: 59% Chance Higher
This prediction is an attempt by the editor of this newsletter to use the full 5+ year history of data collected from this project to forecast a probability estimate for whether this week’s sentiment is going to be correct and ultimately what the markets will do this coming week.
Details: Last week’s majority sentiment from the survey was 38.2 Higher, and the Crowd Forecast Indicator prediction was 60% Chance Higher; the S&P500 closed 2.72% Higher for the week. This week’s majority sentiment from the survey is 71.4% Higher with a greater average confidence from those who responded Lower. Similar conditions have occurred 29 times in the previous 285 weeks, with the majority sentiment being correct 59% of the time and with an average S&P500 move of 0.01% Higher for the week. Based on that history, the TimingResearch Crowd Forecast Indicator is forecasting a 59% Chance that the S&P500 is going to move Higher this coming week.
Raw Data Page (raw data files include full history spreadsheet and the above charts):
TimingResearch.com/data.
Full Weekly Results (full version of this chart available in the raw data spreadsheet for this week, “Date” field below lists the Monday of the week being predicted).
Overall Sentiment All-Time “Correct” Percentage: 51.6%
Overall Sentiment 52-Week “Correct” Percentage: 56.9%
Overall Sentiment 12-Week “Correct” Percentage: 63.6%
Only the previous 52 weeks of data are shown below, please download the raw data to see the full range of past data.
Weekly Reports Page: TimingResearch.com/reports
Raw Data Page: TimingResearch.com/rawdata
Current Survey Page: TimingResearch.com/currentsurvey
Any feedback: TimingResearch.com/contact
Email Alerts
Make sure you don’t miss all the future reports, show reminders, and bonus offers from TimingResearch, enter your email here:
By signing up you agree to receive newsletter and alert emails. You can unsubscribe at any time. Privacy Policies
NOTE: The following open-ended answers are solely the opinions of the anonymous respondents to this survey. Responses are mostly unedited, but some have been reformatted slightly for to make them easier to read. Some irrelevant responses (e.g. “none”), or anything obviously fake, or copy and pasted responses have been omitted. All-caps responses have been changed to all lowercase. All responses for each week, unedited, are available in the raw data spreadsheets at TimingResearch.com/data.
Question #3. For your answer to Question #1, please share what specific reason(s) you think the S&P500 will be heading the direction you chose.
“Higher” Respondent Answers:
• Divergence in Motley is maybe interesting from price something Mrs maybe I think but Donald Trump is a popular President I saw 52 popularity maybe supporting more buying than selling now I think maybe
• Just a gut feel
• best six months of the year. go with the flow
• friday closed up
• China
• RSI is long on the day, H4 and H1
• Momentum
• it does the opposite of what I predict (lower)
• SPX break of resistance today.
• history
• The S&P closed just above the Nov 2018 high, with no signs of a reversal. The probability is for more upside.
• momentum
• Trum[p Veto, Market want Wall built
• no new bad news
• range break to the upside
• Testing highs, looking for resistance.
• Looks like second shoulder of head and shoulders pattern? Maybe higher then late week corrct…
“Lower” Respondent Answers:
• over bought.
• Rally in previous week
• Post expiration position squaring
• My 401 K hit an all time high and I need AMZN to go up.
• elliott wave 5
• Market is overbought.
• transports, Russell non-confirmation
• Market t0pped weeks ago
Question #4. Which do you think is best, trading one methodology or system all the time or trading multiple strategies? Why?
• Multiple strategies, for diversification
• Multiple because of changing conditions
• one
• Trading multiple strategies could be optimal for the different market moods — such as trending, range bound, chop.
• Short term
• multiple. satisfies the take profit part of me while allowing me to run my winners
• I dk
• 1 @ adjust as mkts change
• become the house
• kiss
• Having multiple possibilities seems best. It can help to use a strategy now that works best with the current trend; and different strategies for a different market phases or diverse sectors.
• one; only one brain
• Multiple strategies but using indicators as well to guide the trade…
• one methodology
• One method, less to keep track of.
• must be flexible with changing market conditions
• One is the best, but you have to be able to adapt to the changing market, and that might require a different system, trending verses ranging.
• one methodology which works
• Multiple strategies, life is constantly evolving and revolutiions
• I like profit n the trades but I think the support line has n a popular Republican could support more buying than selling rather than a resistance line I think now but I might think more selling than buying in a resistance line is more important as I do not like any loss at all
• Let us know when you find out
Question #5. Additional Comments/Questions/Suggestions?
• Make this a bit more competitive by having a league of the those who make the right calls more often
• anything can happen this week. I see testing the last large top soon. 09/21/2018
• If every one think the same way, you should take the oppose position
• Profit only I think
Join us for this week’s shows:
Crowd Forecast News Episode #217
This week’s show will feature a discussion with the trading experts listed below about the most recent TimingResearch Crowd Forecast Newsletter report, where they think the S&P500 is headed, what they are watching for in the markets currently, and their best trading idea.
Date and Time:
– Monday, October 1st, 2018
– 1PM ET (10AM PT)
Moderator and Guests:
– Mark Sachs of RightLineTrading.com
– Norman Hallett of TheDisciplinedTrader.com
– Lance Ippolito of AlphaShark.com
Analyze Your Trade Episode #70
When you register, you will be prompted to list the top 5 stocks that you are interested in trading. We will list the top 5 from all registrants and our experts will be prepared to offer their opinions on these trades.
Date and Time:
– Tuesday, , 2018
– 4:30PM ET (1:30PM PT)
Moderator and Guests:
– Jim Kenney of OptionProfessor.com
– John Thomas of MadHedgeFundTrader.com
Crowd Forecast News Report #285
The new TimingResearch report for the week has been posted, you can download the full PDF report with the link below or you can read the full report in this post below.
Click here to download report in PDF format: TRReport031019.pdf
Full web version of the report available below the ad.

There Was NO WAY He Was Going to Make It Until…
Like any young, high school gym teacher, Jason Bond struggled to make a living. And no matter how hard he trained, the weight of his college loans seemed heavier with each passing day. But what felt really heavy was the day that he looked at his retirement plan. There was NO WAY he was going to be able to make it on his paltry teacher’s salary (nor did he have any plans to become a greeter at Walmart!)
Learn more about his story here.
Question #1. Which direction do you think the S&P500 index will move from this coming Monday’s open to Friday’s close (March 11th to 15th)?
The order of possible responses to this question on the survey were randomized for each viewer.)
Higher: 38.2%
Lower: 61.8%
Higher/Lower Difference: -23.5%
Question #2. Rate your confidence in your answer to Question #2 by estimating the probability you have correctly predicted next week’s market move.
Average of All Responses: 66.9%
Average For “Higher” Responses: 64.2%
Average For “Lower” Responses: 68.6%
Higher/Lower Difference: -4.3%
Responses Submitted This Week: 35
52-Week Average Number of Responses: 40.8
TimingResearch Crowd Forecast Prediction: 68% Chance Lower
This prediction is an attempt by the editor of this newsletter to use the full 5+ year history of data collected from this project to forecast a probability estimate for whether this week’s sentiment is going to be correct and ultimately what the markets will do this coming week.
Details: Last week’s majority sentiment from the survey was 57.5% Higher, and the Crowd Forecast Indicator prediction was 60% Chance Higher; the S&P500 closed 2.53% Lower for the week. This week’s majority sentiment from the survey is 61.8% Higher with a greater average confidence from those who responded Lower. Similar conditions have occurred 19 times in the previous 284 weeks, with the majority sentiment being correct 68% of the time and with an average S&P500 move of 0.13% Lower for the week. Based on that history, the TimingResearch Crowd Forecast Indicator is forecasting a 68% Chance that the S&P500 is going to move Lower this coming week.

Raw Data Page (raw data files include full history spreadsheet and the above charts):
TimingResearch.com/data.
Full Weekly Results (full version of this chart available in the raw data spreadsheet for this week, “Date” field below lists the Monday of the week being predicted).
Overall Sentiment All-Time “Correct” Percentage: 51.8%
Overall Sentiment 52-Week “Correct” Percentage: 56.9%
Overall Sentiment 12-Week “Correct” Percentage: 63.6%
Only the previous 52 weeks of data are shown below, please download the raw data to see the full range of past data.
Weekly Reports Page: TimingResearch.com/reports
Raw Data Page: TimingResearch.com/rawdata
Current Survey Page: TimingResearch.com/currentsurvey
Any feedback: TimingResearch.com/contact
Email Alerts
Make sure you don’t miss all the future reports, show reminders, and bonus offers from TimingResearch, enter your email here:
By signing up you agree to receive newsletter and alert emails. You can unsubscribe at any time. Privacy Policies
NOTE: The following open-ended answers are solely the opinions of the anonymous respondents to this survey. Responses are mostly unedited, but some have been reformatted slightly for to make them easier to read. Some irrelevant responses (e.g. “none”), or anything obviously fake, or copy and pasted responses have been omitted. All-caps responses have been changed to all lowercase. All responses for each week, unedited, are available in the raw data spreadsheets at TimingResearch.com/data.
Question #3. For your answer to Question #1, please share what specific reason(s) you think the S&P500 will be heading the direction you chose.
“Higher” Respondent Answers:
• The market is oversold and should go up!! Watch the new lows vs highs.
• Trumped
• Options expiration week is usually an up week.
• Friday reversal leads to a bounce
• expect good news and mini correction bottoming out today
• Timing
“Lower” Respondent Answers:
• Economy slowdown no new jobs growth guys its 0ver
• Jobs need to go highest I think maybe higher for more of a bullish trend in the future new jobs of employment type even higher
• market topped months ago rebound ending lower job rate stocks getting slippery
• Global growth slow-down Trade & tariff wars El Stupido 65 Million economic refugees in the world- creating universal instability.
• Reversion to the mean
• We Are at s/p 500 200ma 2750 -,starting to see transports weakening dollar sideways, no leadership.
• Market is over sold and will over correct and after all the bad news will fall lower.
• reversion to the mean, fibonacci levels
• Elliott Wave 5
• we will bounce and then fail
• The downside correction that started last week will continue this week.
• Job creation faltering, yields inverting. Expecting any market strength to be shorted.
• mkts correcting now
• 50 and 200 dma going to collide with price on the daily chart….going down
ADVERTISEMENT
The “Fish Hook Trader” and What He Caught
Question #4. Which trading platforms or brokers do you like the best for executing your trades?
• Tddirectinginvesting.ca/TOS ( think or swim)
• Trading View ( free version ) Tasty Trade is my primary platform, It’s OK but needs improvements. I also often use Finviz and Bar-charts.
• ib
• Edward Jones
• tos
• Sogo
• ThinkorSwim
• schwab
• ADM and use Fidessa which cld be much better :(
• tradestation
• Schwab
• Thinkorswim, Ninjatrader 7
• sogo and i don’t care for it nor td both suck
• TOS & Tasty
• TDAmeritrade mobile is what I use. Not excellent but it works pretty well..
• TradeStation
• Yours
• e*Trade
• Ameritrade/ Think or Swim
• td ameritrade
• e*trade
Question #5. Additional Comments/Questions/Suggestions?
• 1. What research companies do U use for recession forecasts ? 2. That asked, what strategies used for hedging ?
• Tried several platforms and have never been content. A platform for me does not need all Think or Swim has to offer. The perfect platform needs to be user friendly – fractal screens -no confusion to open or close a trade – drag and drop stops on the charts etc.
• Thank you
• I like cash
Join us for this week’s shows:
Crowd Forecast News Episode #216
This week’s show will feature a discussion with the trading experts listed below about the most recent TimingResearch Crowd Forecast Newsletter report, where they think the S&P500 is headed, what they are watching for in the markets currently, and their best trading idea.
Date and Time:
– Monday, March 11th, 2019
– 1PM ET (10AM PT)
Moderator and Guests:
– TBA
Analyze Your Trade Episode #69
When you register, you will be prompted to list the top 5 stocks that you are interested in trading. We will list the top 5 from all registrants and our experts will be prepared to offer their opinions on these trades.
Date and Time:
– Tuesday, March 12th, 2019
– 4:30PM ET (1:30PM PT)
Moderator and Guests:
– TBA
ADVERTISEMENT
Crowd Forecast News Report #284
The new TimingResearch report for the week has been posted, you can download the full PDF report with the link below or you can read the full report in this post below.
Click here to download report in PDF format: TRReport030319.pdf
Full web version of the report available below the ad.

Smooth Markets Never Made a Skilled Investor
I see a lot of panicked traders and worried investors right now. And with good cause because we’re not convinced that the turbulence in the markets isn’t set to continue for a while.
But there’s one guy we know, Jeff, who looks pretty relaxed right now. You see, Jeff’s investing approach can pinpoint stocks and profit from them no matter whether the market is soaring or nose-diving.
Crowd Forecast News Report #284:
Question #1. Which direction do you think the S&P500 index will move from this coming Monday’s open to Friday’s close (March 4th to 8th)?
The order of possible responses to this question on the survey were randomized for each viewer.)
Higher: 57.5%
Lower: 42.5%
Higher/Lower Difference: 15.0%
Question #2. Rate your confidence in your answer to Question #2 by estimating the probability you have correctly predicted next week’s market move.
Average of All Responses: 61.4%
Average For “Higher” Responses: 62.2%
Average For “Lower” Responses: 60.3%
Higher/Lower Difference: 1.9%
Responses Submitted This Week: 41
52-Week Average Number of Responses: 41.1
TimingResearch Crowd Forecast Prediction: 60% Chance Higher
This prediction is an attempt by the editor of this newsletter to use the full 5 year history of data collected from this project to forecast a probability estimate for whether this week’s sentiment is going to be correct and ultimately what the markets will do this coming week.
Details: Last week’s majority sentiment from the survey was 52.8% Higher, and the Crowd Forecast Indicator prediction was 60% Chance Higher; the S&P500 closed 0.02% Lower for the week. This week’s majority sentiment from the survey is 57.5% Higher with a greater average confidence from those who responded Higher. Similar conditions have occurred 75 times in the previous 283 weeks, with the majority sentiment being correct 60% of the time and with an average S&P500 move of 0.19% Higher for the week. Based on that history, the TimingResearch Crowd Forecast Indicator is forecasting a 60% Chance that the S&P500 is going to move Higher this coming week.
Raw Data Page (raw data files include full history spreadsheet and the above charts):
TimingResearch.com/data.
Full Weekly Results (full version of this chart available in the raw data spreadsheet for this week, “Date” field below lists the Monday of the week being predicted).
Overall Sentiment All-Time “Correct” Percentage: 52.0%
Overall Sentiment 52-Week “Correct” Percentage: 56.9%
Overall Sentiment 12-Week “Correct” Percentage: 63.6%
Only the previous 52 weeks of data are shown below, please download the raw data to see the full range of past data.
Weekly Reports Page: TimingResearch.com/reports
Raw Data Page: TimingResearch.com/rawdata
Current Survey Page: TimingResearch.com/currentsurvey
Any feedback: TimingResearch.com/contact
Email Alerts
Make sure you don’t miss all the future reports, show reminders, and bonus offers from TimingResearch, enter your email here:
By signing up you agree to receive newsletter and alert emails. You can unsubscribe at any time. Privacy Policies
NOTE: The following open-ended answers are solely the opinions of the anonymous respondents to this survey. Responses are mostly unedited, but some have been reformatted slightly for to make them easier to read. Some irrelevant responses (e.g. “none”), or anything obviously fake, or copy and pasted responses have been omitted. All-caps responses have been changed to all lowercase. All responses for each week, unedited, are available in the raw data spreadsheets at TimingResearch.com/data.
Question #3. For your answer to Question #1, please share what specific reason(s) you think the S&P500 will be heading the direction you chose.
“Higher” Respondent Answers:
• Trend with room to YTD high
• Based on New Highs and a trade deal with China, and continuation of the trend
• Still best six months of year historically
• Good Trump Presidential lederhip
• No such thing as a “quadruple top.” Hurdle should be cleared to flush out the bears. Bullish cross of 21dma and 200dma. Then once we’re over, we’ll have a dip to screw the algos and bandwagoners.
• March effect.
• trend is up
• Economy is good.
• Friday’s market closed in an upward direction; with the S&P ending above 2800. Momentum continues positive. So, upward we should march over the next few days at least.
• I have no idea.
• China/US deal still on.
“Lower” Respondent Answers:
• 500 index nearing roll over point
• Market way overvalued
• Major resistance. Due for correctional above
• Pullback is due
• OB- too much bullishness
• Market may need to consolidate.
• elliott wave
• Market is overbought. Earnings season is winding down. Washington still has problems with upcoming debt ceiling.
• don’t know
• Market topping
• Game up! Now retrace…
• All buying climaxes end – don’t they? eventually?
Question #4. What procedures do you use for trade management? (e.g. position size, stops, scaling in or out, etc.)
• Position size
• All above depending on type of instrument
• Set risk (stop) and set target so that the target is always greater than the risk. But it’s more complicated than that. For example you can’t just set your target for 100 ES points away and set your risk for 50 points. It has to be reasonable. So risk should be a certain percentage of your trading balance – maybe 1%. Then your target could be maybe 1.5%. That’s the idea anyway.
• in and out, occasionlly Stops
• stops
• Position size, position risk, scaling in, hedging.
• position size, stops
• ✋ s
• Scaling in/out (thank you, Jim Cramer–best advice ever). Profit/loss targets. Chart patterns.
• position size and stops
• Percentages of total trading amount.
• Fibonacci regression & fan
• calls
• Stops Scaling? C’mon
• position size
• Stops, Scale in/out, Moving Average’s
• Loss percentage limit
• All mentioned plus chart indicators.
Question #5. Additional Comments/Questions/Suggestions?
• Thanks for the reports
• none
Join us for this week’s shows:
Crowd Forecast News Episode #215
This week’s show will feature a discussion with the trading experts listed below about the most recent TimingResearch Crowd Forecast Newsletter report, where they think the S&P500 is headed, what they are watching for in the markets currently, and their best trading idea.
Date and Time:
– Monday, March 4th, 2019
– 1PM ET (10AM PT)
Moderator and Guests:
– Norman Hallett of TheDisciplinedTrader.com
– Tim Racette of EminiMind.com
– Fausto Pugliese of CyberTradingUniversity.com
– Simon Klein of TradeSmart4x.com
– John Thomas of MadHedgeFundTrader.com (moderator)
Analyze Your Trade Episode #68
When you register, you will be prompted to list the top 5 stocks that you are interested in trading. We will list the top 5 from all registrants and our experts will be prepared to offer their opinions on these trades.
Date and Time:
– Tuesday, March 5th, 2019
– 4:30PM ET (1:30PM PT)
Moderator and Guests:
– Christian Fromhertz of TribecaTradeGroup.com
– Jim Kenney of OptionProfessor.com
– E. Matthew “Whiz” Buckley of TopGunOptions.com (moderator)