- Home
- Crowd Forecast News Reports
Crowd Forecast News Report #352
[AD] eBook: TSLA Options Trader (Complete Strategy Guide)The new TimingResearch report for the week has been posted, you can download the full PDF report with the link below or you can read the full report in this post below.
Click here to download report in PDF format: TRReport062220.pdf
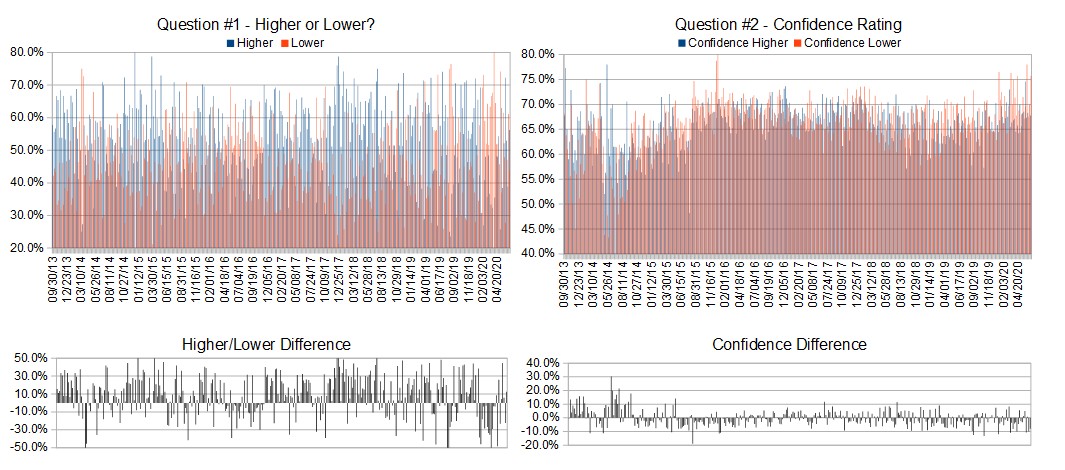
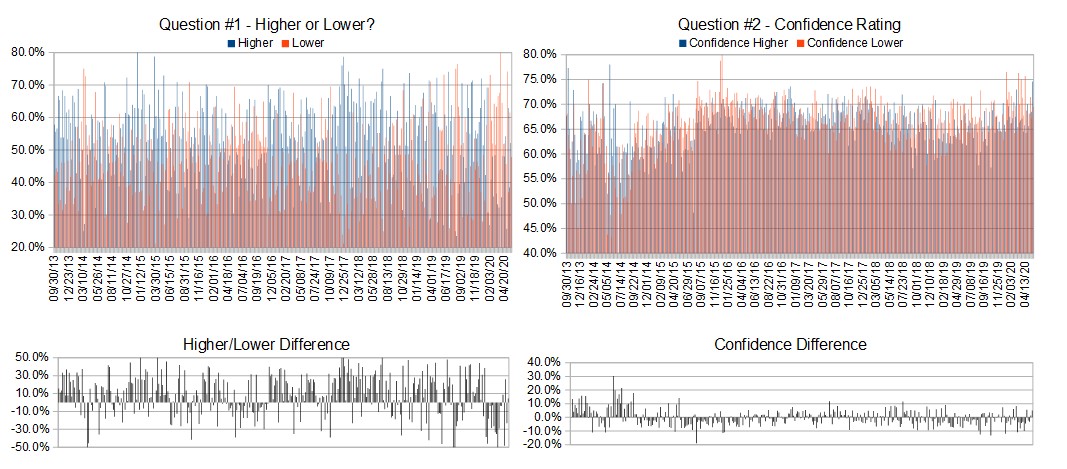
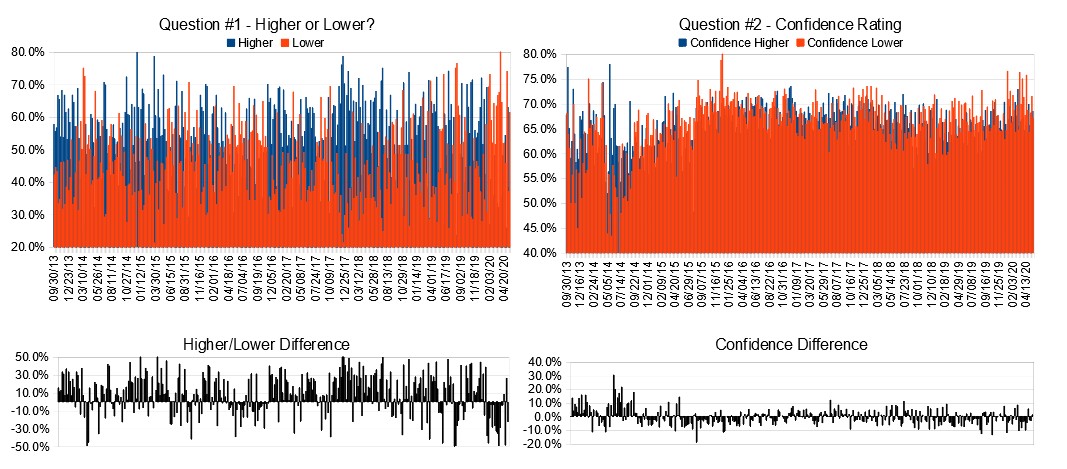
Question #1. Which direction do you think the S&P500 index will move from this coming Monday’s open to Friday’s close (June 22nd-26th)?
Higher: 56.3%
Lower: 43.8%
Higher/Lower Difference: 12.5%
Question #2. Rate your confidence in your answer to Question #2 by estimating the probability you have correctly predicted next week’s market move.
Average of All Responses: 71.3%
Average For “Higher” Responses: 67.8%
Average For “Lower” Responses: 75.7%
Higher/Lower Difference: -7.9%
Responses Submitted This Week: 17
52-Week Average Number of Responses: 29.4
TimingResearch Crowd Forecast Prediction: 56% Chance Higher
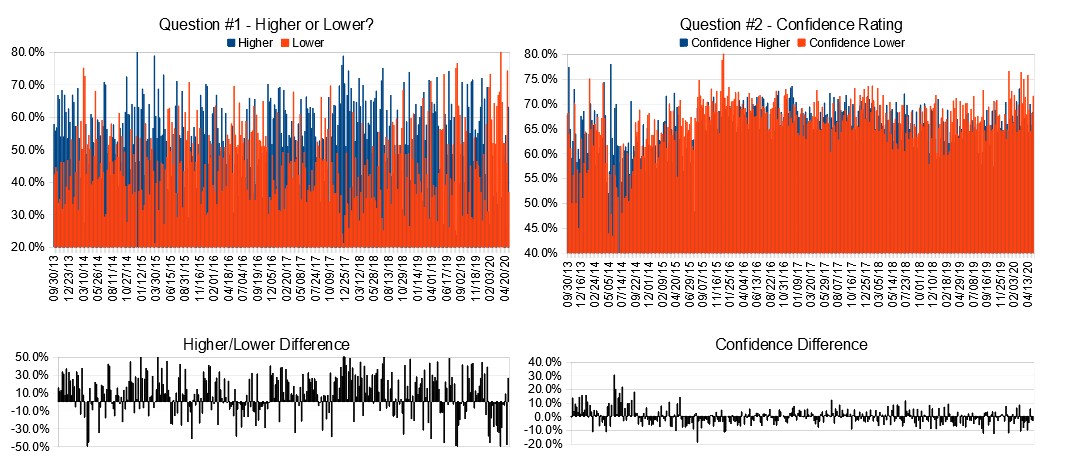
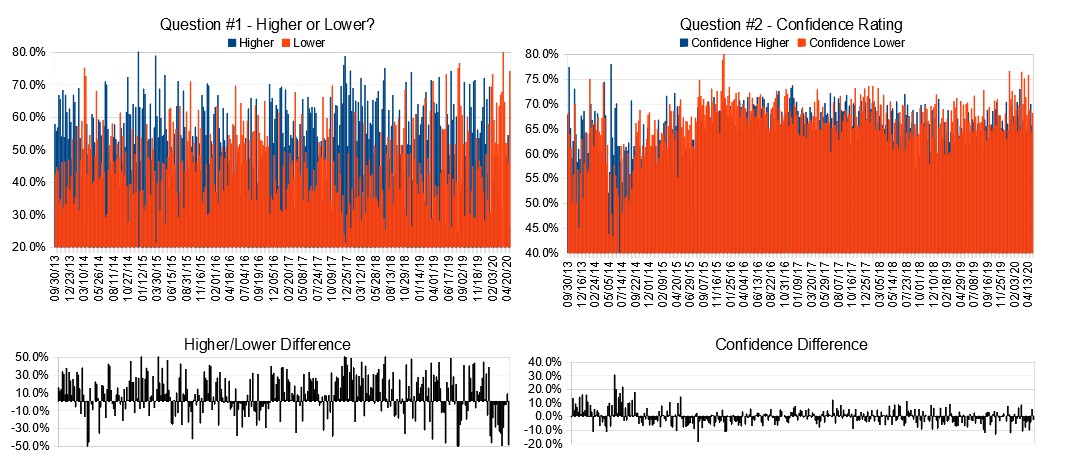
This prediction is an attempt by the editor of this newsletter to use the full 6+ year history of data collected from this project to forecast a probability estimate for whether this week’s sentiment is going to be correct and ultimately what the markets will do this coming week.
Details: Last week’s majority sentiment from the survey was 61.1% predicting Lower, and the Crowd Forecast Indicator prediction was 57% chance Higher; the S&P500 closed 3.47% Higher for the week. This week’s majority sentiment from the survey is 56.3% predicting Higher but with a greater average confidence from those who are predicting Lower. Similar conditions have occurred 72 times in the previous 351 weeks, with the majority sentiment (Higher) being correct 56% of the time and with an average S&P500 move of 0.01% Higher for the week. Based on that history, the TimingResearch Crowd Forecast Indicator is forecasting a 56% Chance that the S&P500 is going to move Higher this coming week.
Raw Data Page (raw data files include full history spreadsheet and the above charts):
TimingResearch.com/data.
[AD] eBook: TSLA Options Trader (Complete Strategy Guide)
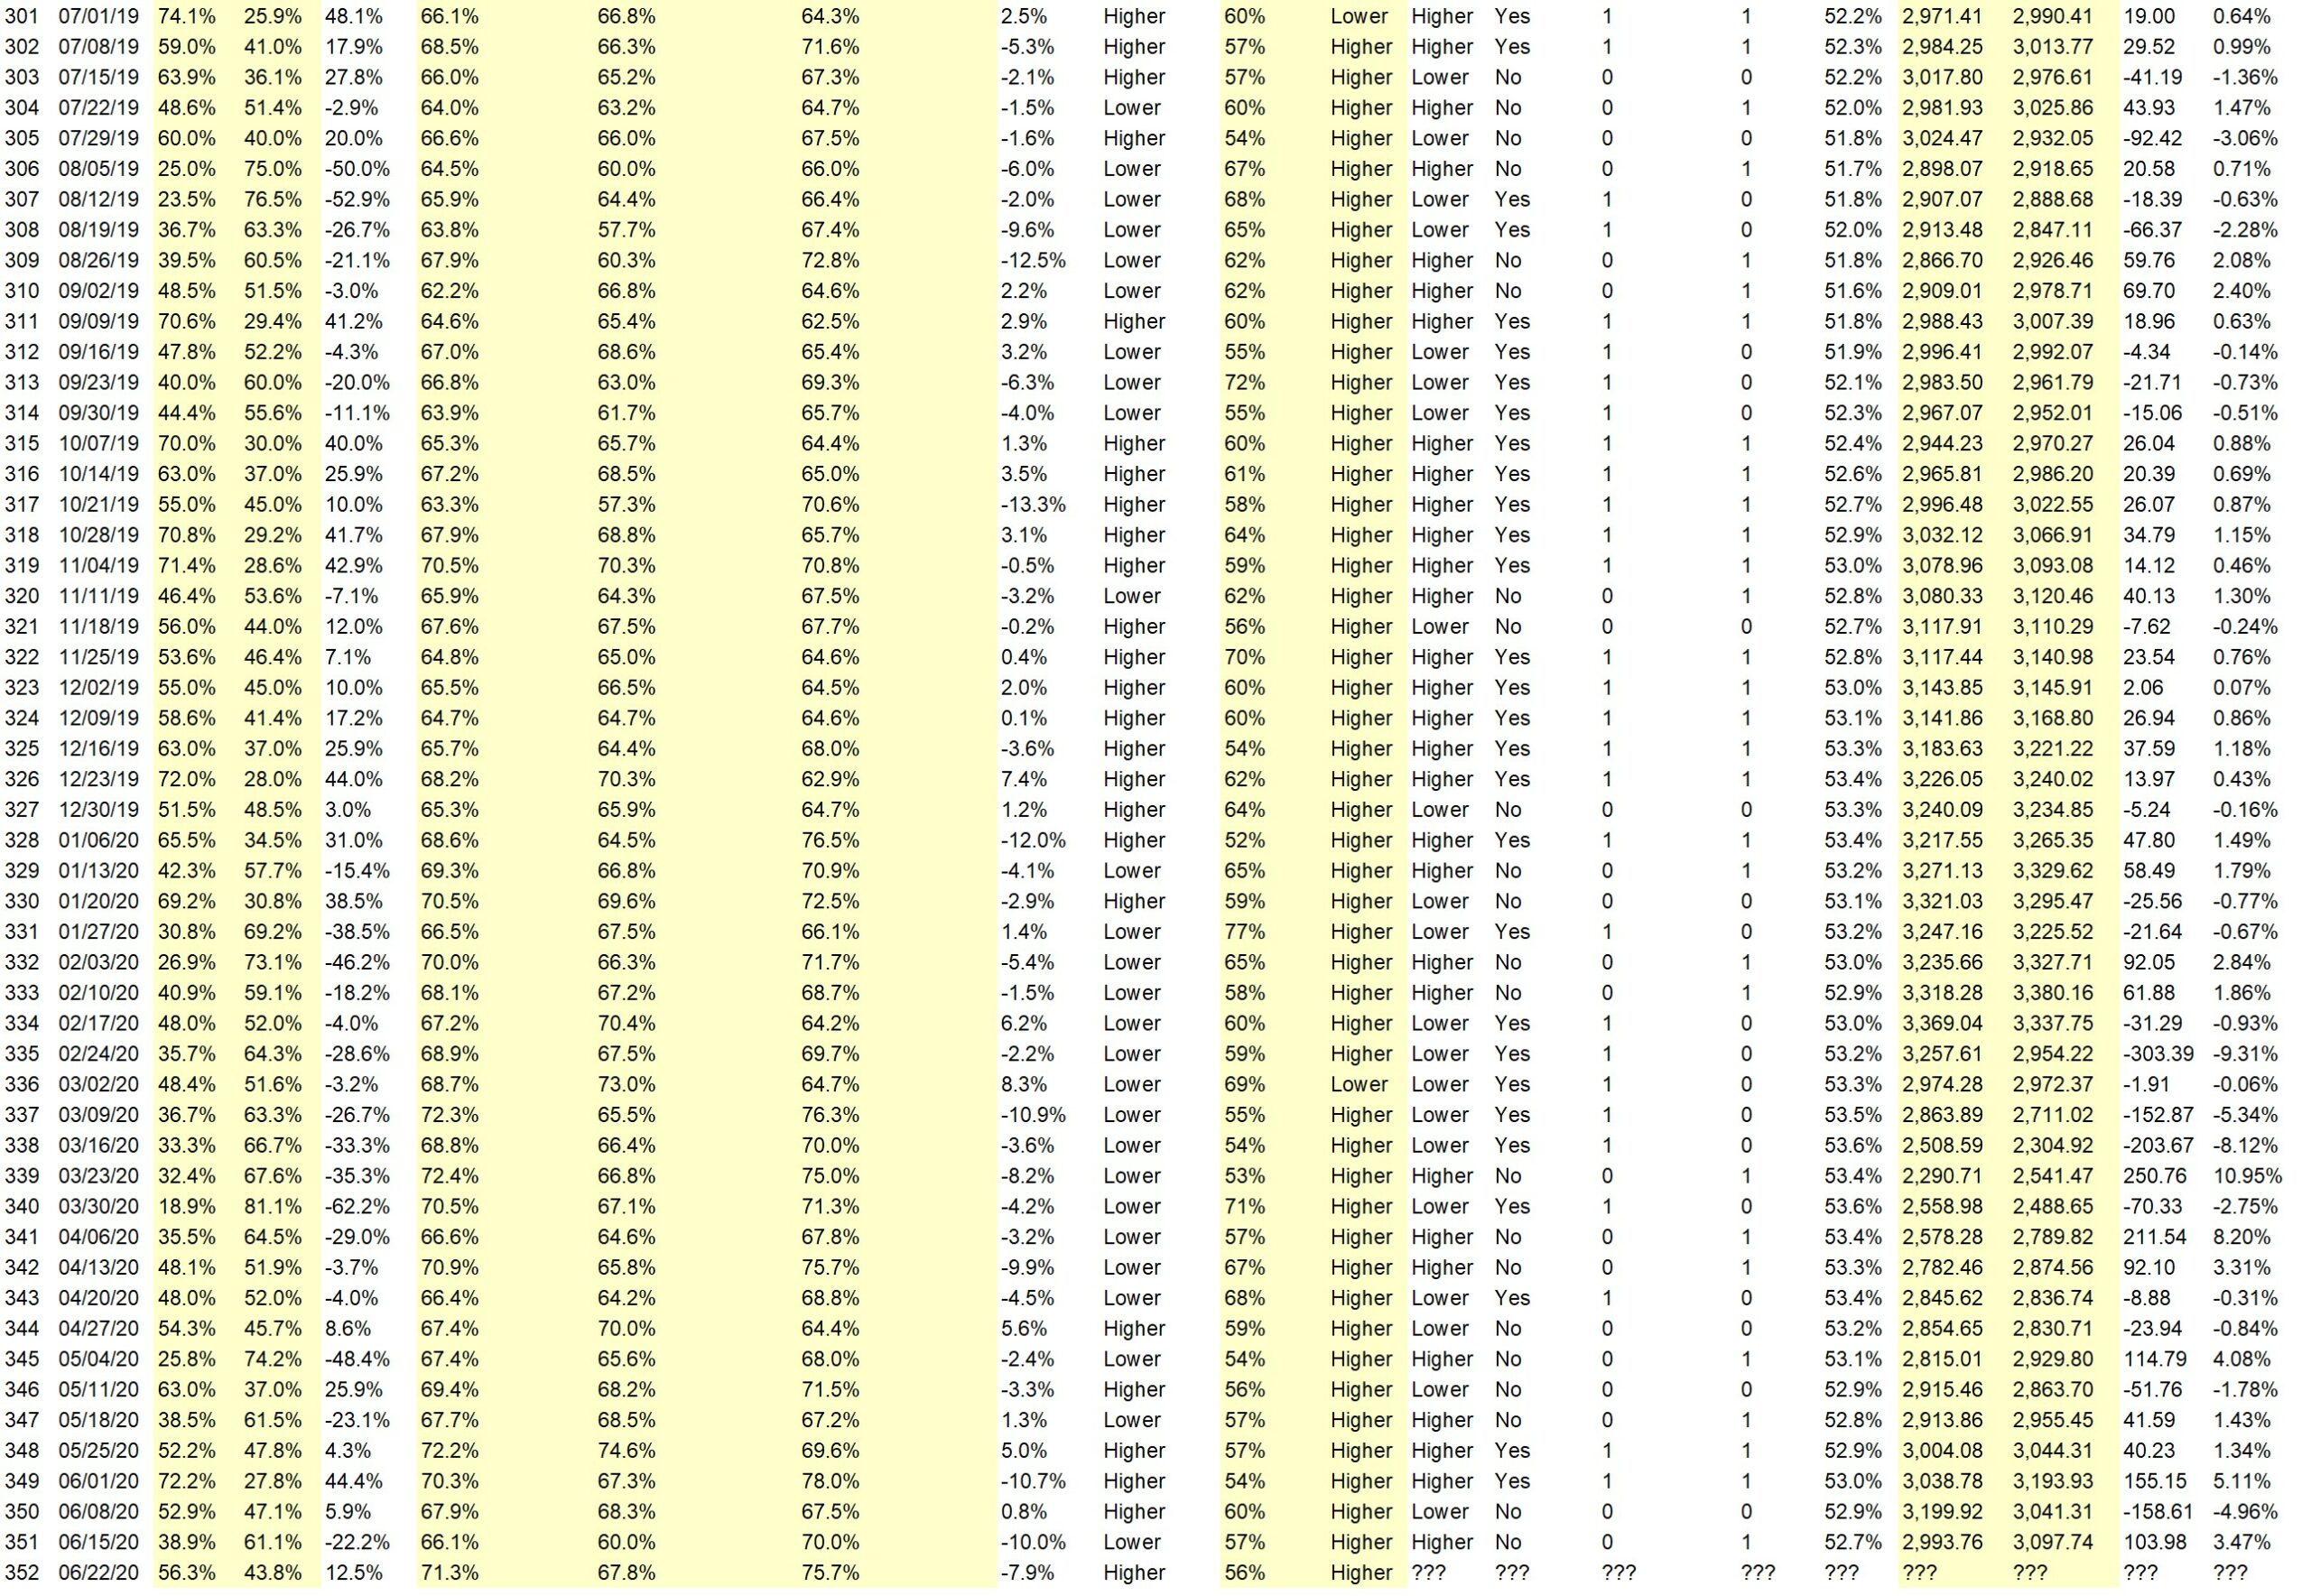
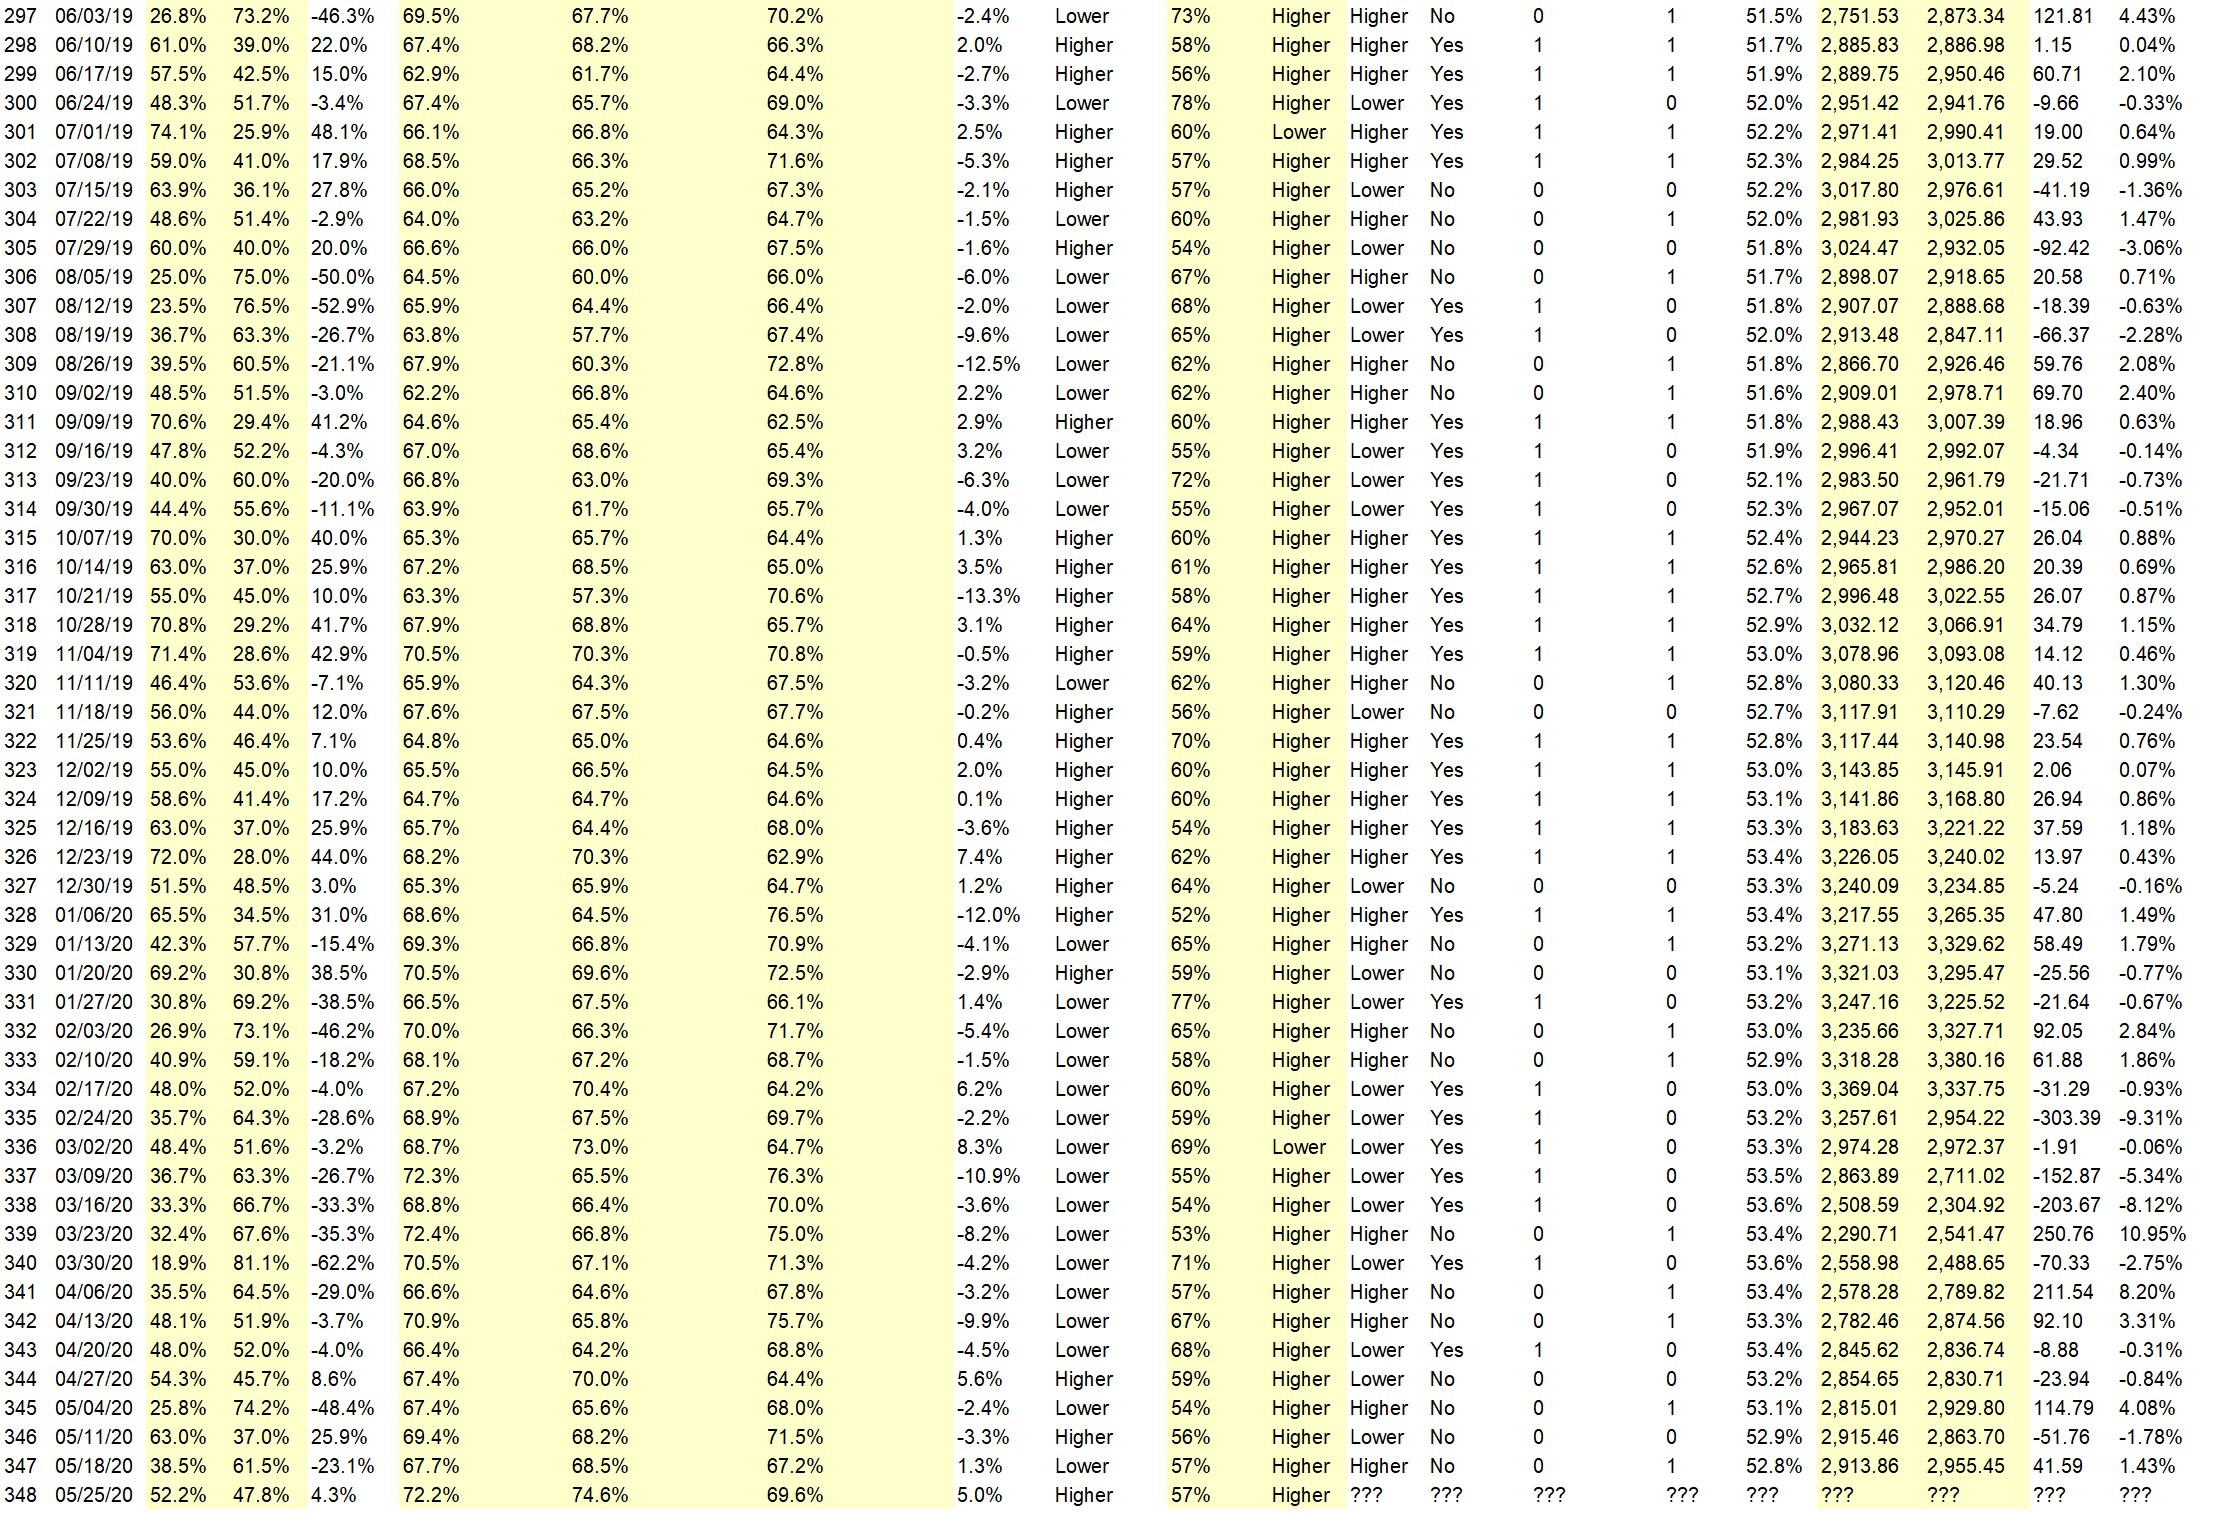
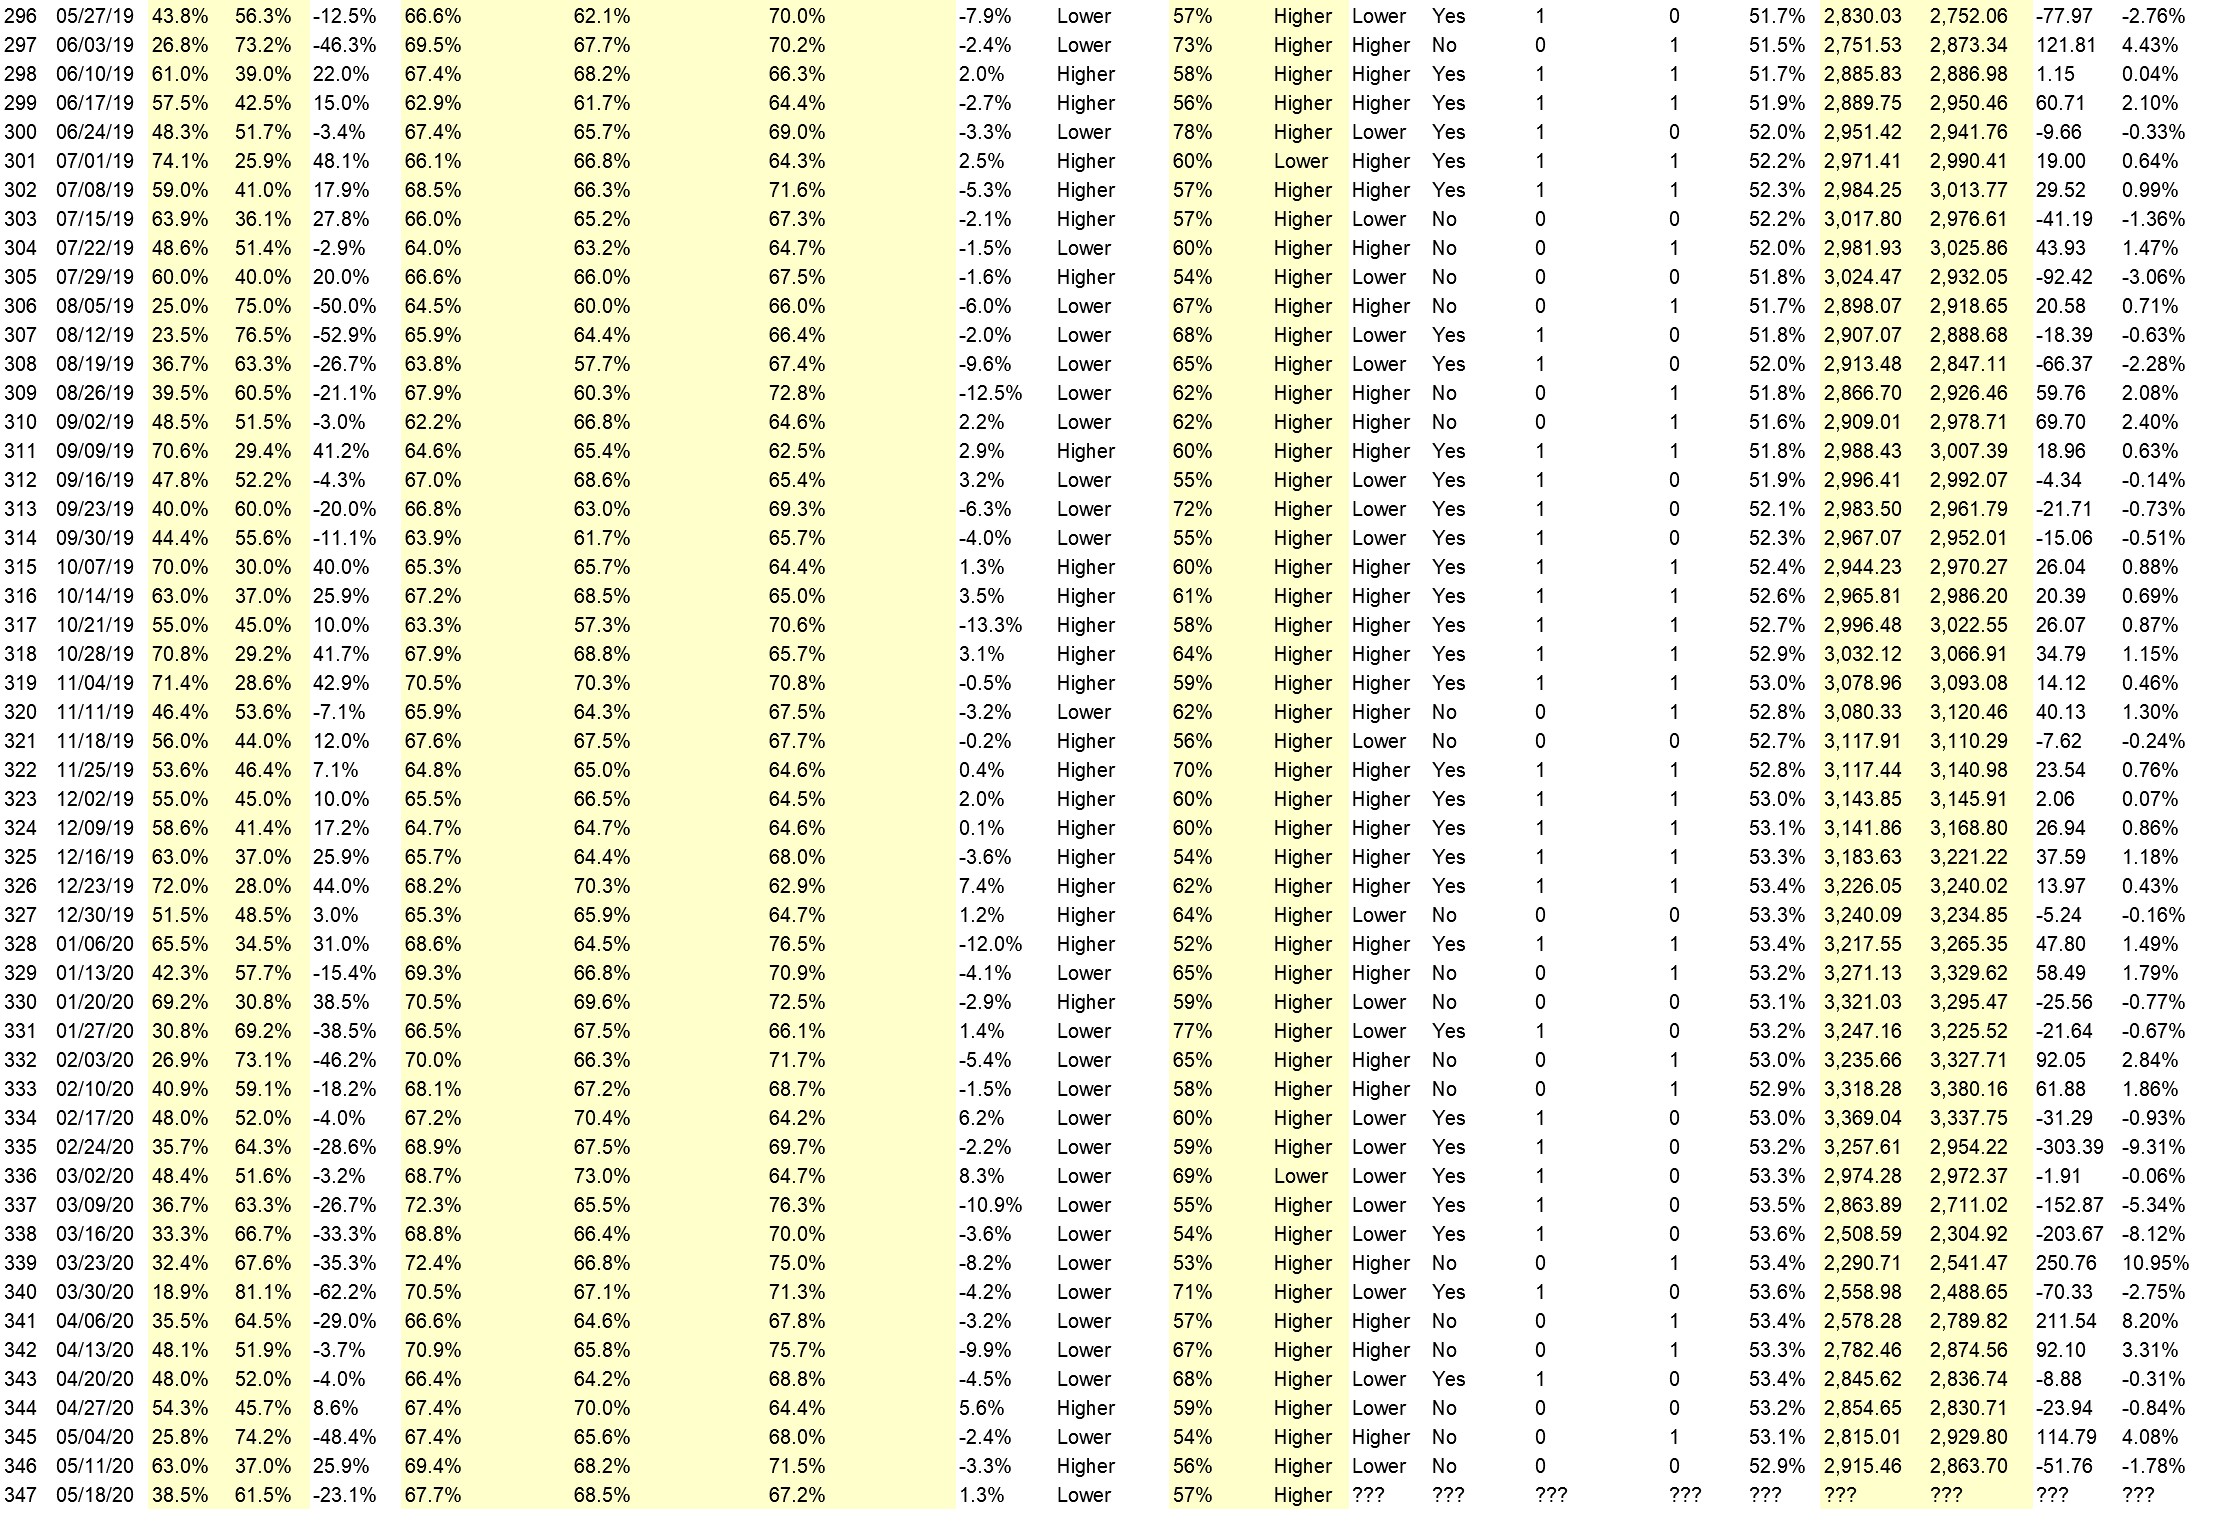
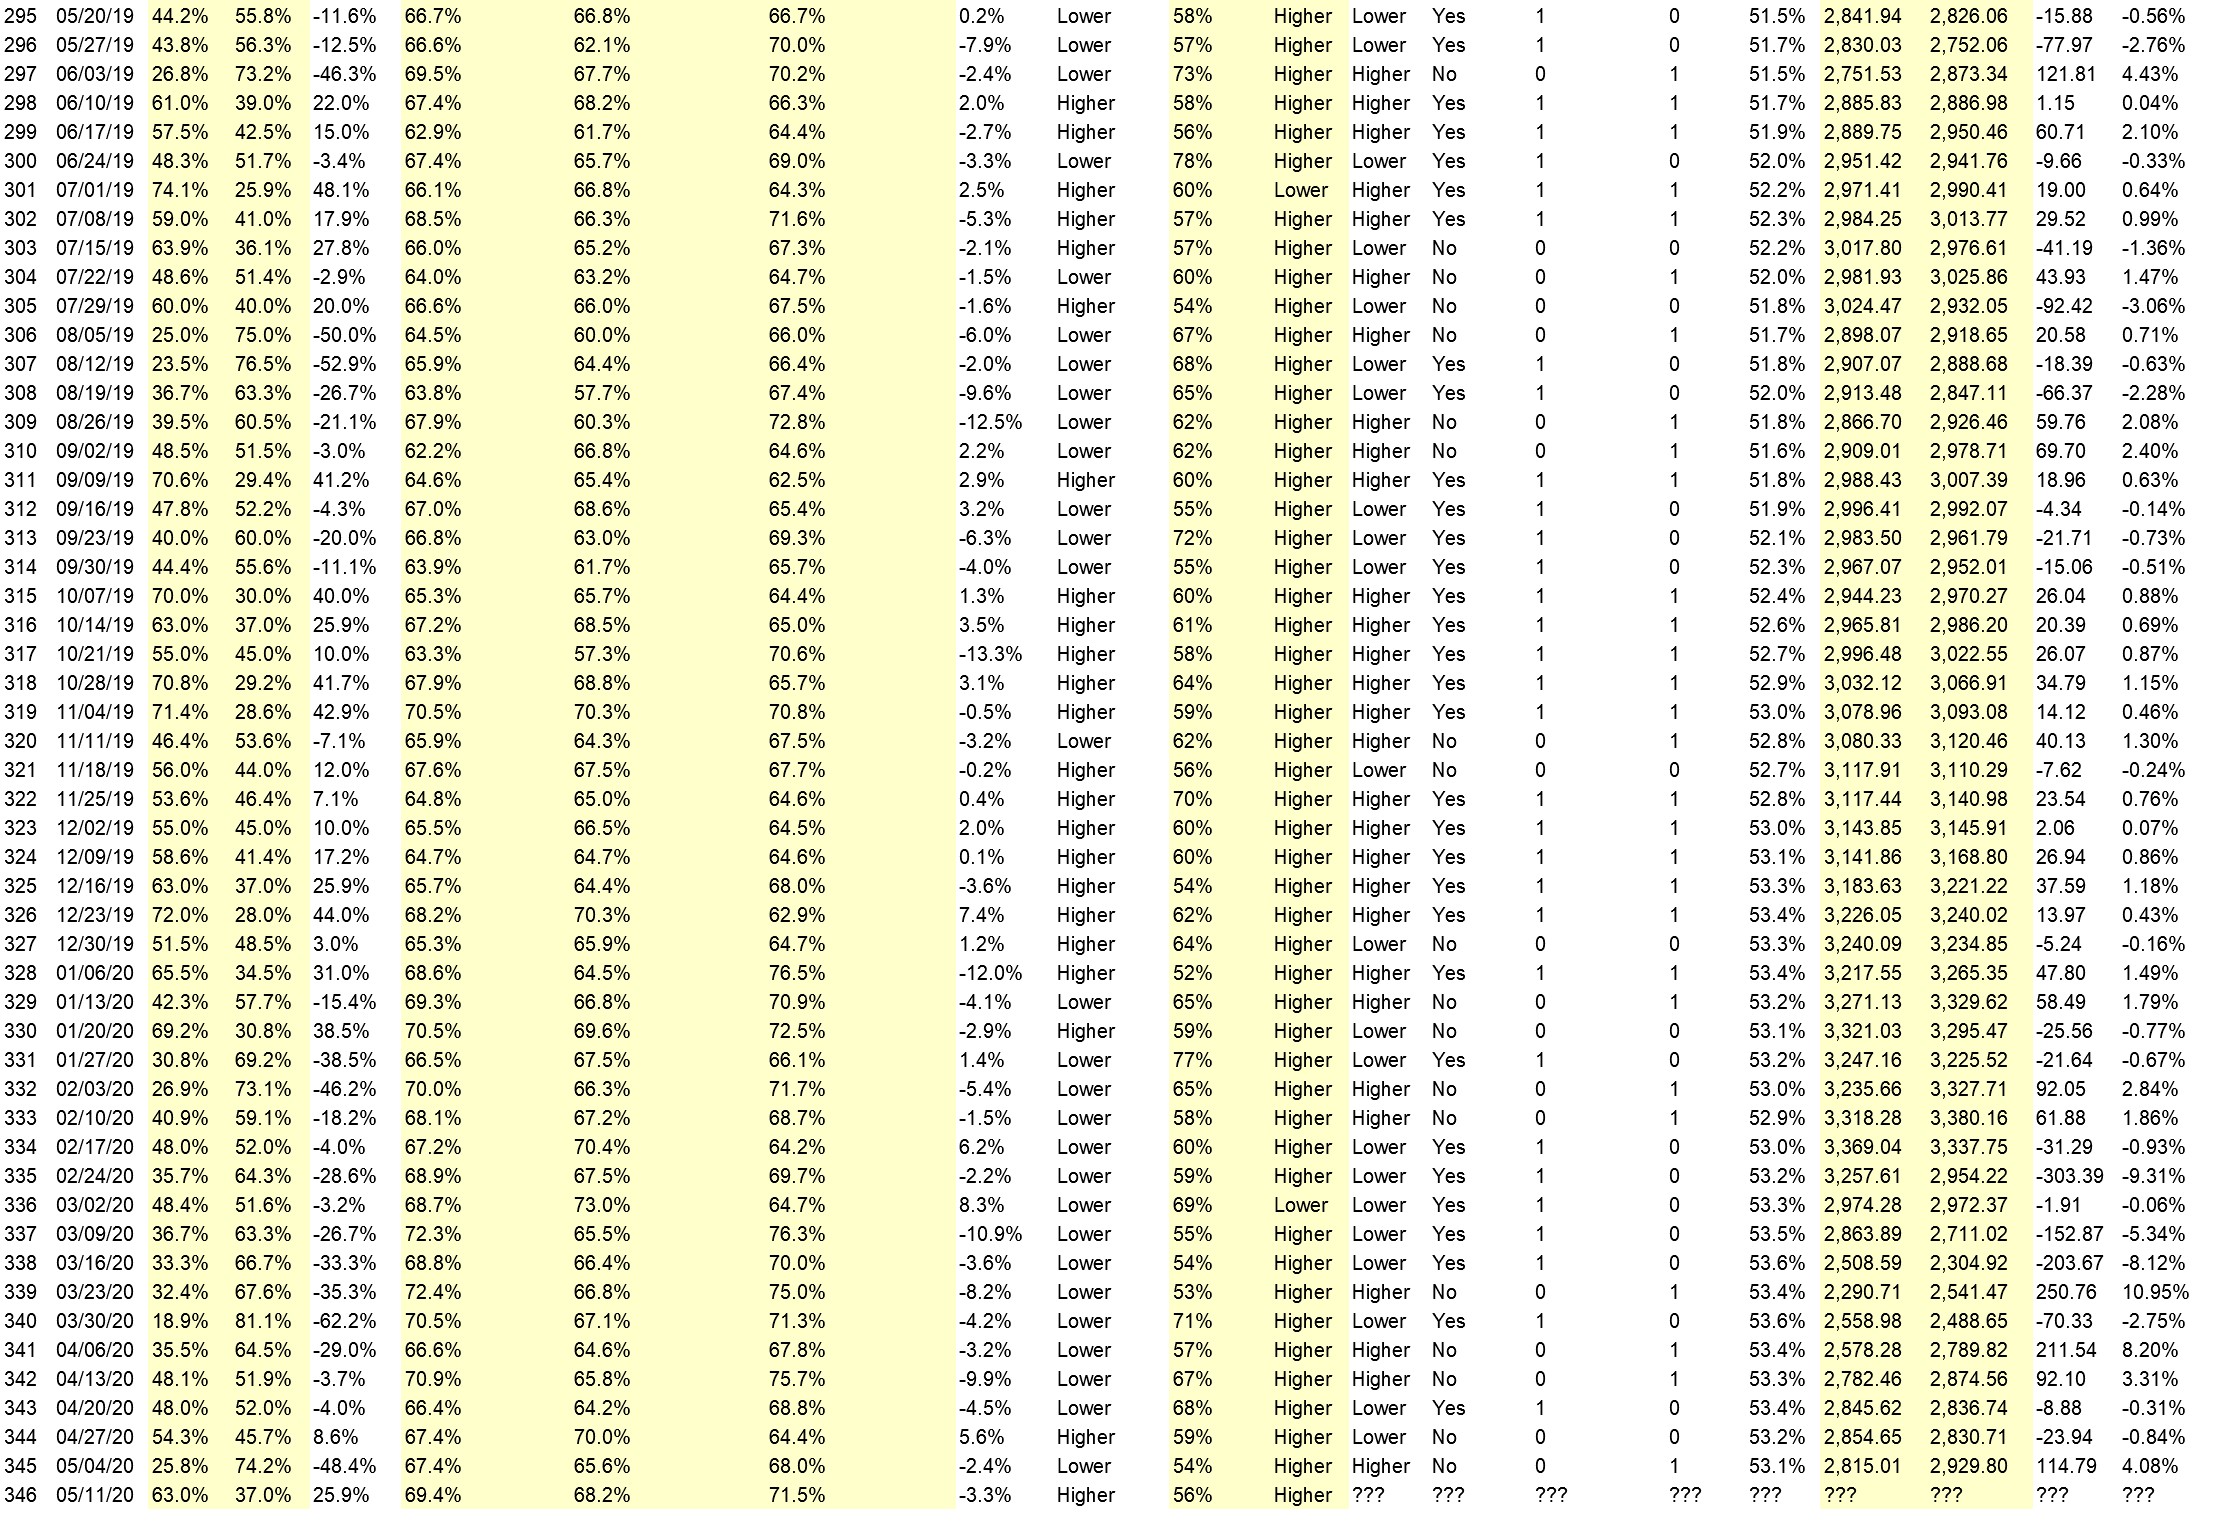
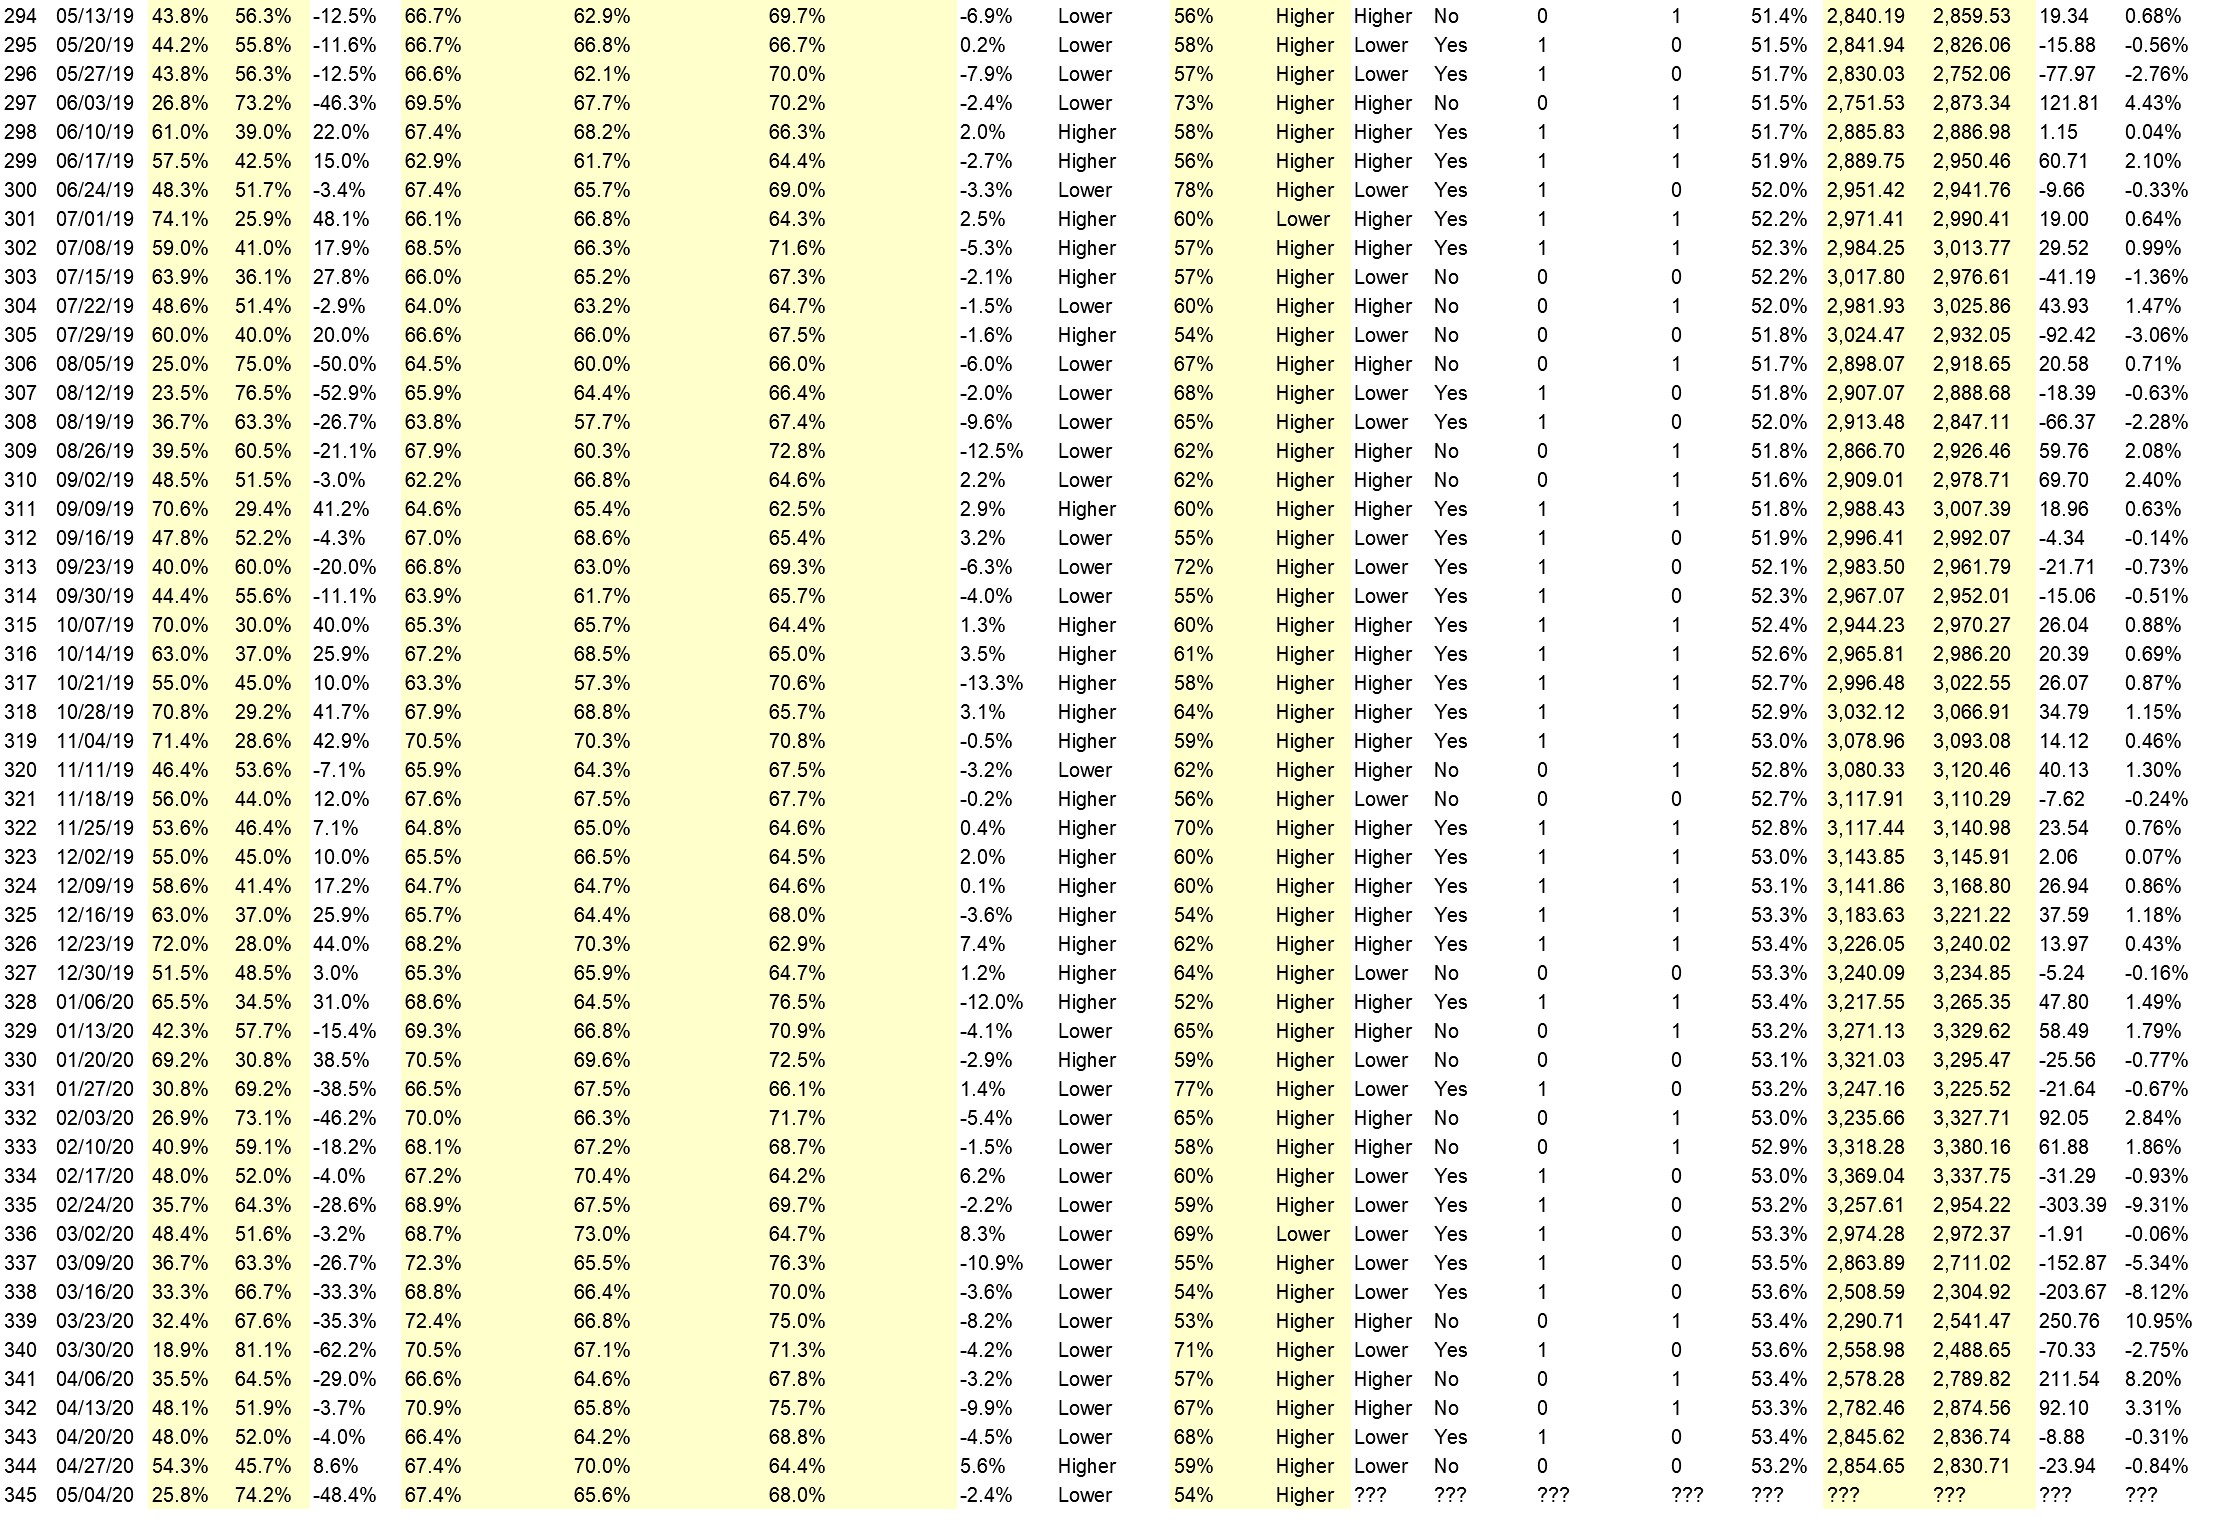
Full Weekly Results (full version of this chart available in the raw data spreadsheet for this week, “Date” field below lists the Monday of the week being predicted).
Overall Sentiment All-Time “Correct” Percentage: 52.7%
Overall Sentiment 52-Week “Correct” Percentage: 56.9%
Overall Sentiment 12-Week “Correct” Percentage: 27.3%
Only the previous 52 weeks of data are shown below, please download the raw data to see the full range of past data.
Weekly Reports Page: TimingResearch.com/reports
Raw Data Page: TimingResearch.com/rawdata
Current Survey Page: TimingResearch.com/currentsurvey
Any feedback: TimingResearch.com/contact
Email Alerts
Make sure you don’t miss all the future reports, show reminders, and bonus offers from TimingResearch, enter your best email here:
By signing up you agree to receive newsletter and marketing emails. You can unsubscribe at any time.
Privacy Policies
NOTE: The following open-ended answers are solely the opinions of the anonymous respondents to this survey. Responses are mostly unedited, but some have been reformatted slightly for to make them easier to read. Some irrelevant responses (e.g. “none”), or anything obviously fake, or copy and pasted responses have been omitted. All-caps responses have been changed to all lowercase. All responses for each week, unedited, are available in the raw data spreadsheets at TimingResearch.com/data.
Question #3. For your answer to Question #1, please share what specific reason(s) you think the S&P500 will be heading the direction you chose.
“Higher” Respondent Answers:
• I am not so sure about it.
• Things are picking up in many states
• Because SPY broke 20 day MA. So my contrarian theory is it bounces back above.
• the trend continues
“Lower” Respondent Answers:
• Will be big drop (third wave by Fibonacci)
• Lower because the number of virus cases are increasing and Apple has shut stores down in some locations.
• We are in a depression
• The Covid-19 virus is alive and happy, as the contagion level is rising sharply in some areas. That’s going to discourage a lot of people from spending at a level that supports economic growth.
• 2nd wave of Covid19 plus the uneasyness of the mkt with regard to upcoming earnings.
[AD] eBook: TSLA Options Trader (Complete Strategy Guide)
Question #4. What procedures do you use to monitor and evaluate your trading results and progress over time?
• p&l
• P/L
• Measure equity in time
• just watch the market where it headed?
• Extensive spreadsheets and monthly summaries
Question #5. Additional Comments/Questions/Suggestions?
• Need more information about candle stick? When to time the market movements.
[AD] eBook: TSLA Options Trader (Complete Strategy Guide)
Email Alerts
Make sure you don’t miss all the future reports, show reminders, and bonus offers from TimingResearch, enter your best email here:
By signing up you agree to receive newsletter and marketing emails. You can unsubscribe at any time.
Privacy Policies
Crowd Forecast News Report #351
[AD] eBook: TSLA Options Trader (Complete Strategy Guide)The new TimingResearch report for the week has been posted, you can download the full PDF report with the link below or you can read the full report in this post below.
Click here to download report in PDF format: TRReport061520.pdf
Question #1. Which direction do you think the S&P500 index will move from this coming Monday’s open to Friday’s close (June 15th-19th)?
Higher: 38.9%
Lower: 61.1%
Higher/Lower Difference: -22.2%
Question #2. Rate your confidence in your answer to Question #2 by estimating the probability you have correctly predicted next week’s market move.
Average of All Responses: 66.1%
Average For “Higher” Responses: 60.0%
Average For “Lower” Responses: 70.0%
Higher/Lower Difference: -10.0%
Responses Submitted This Week: 18
52-Week Average Number of Responses: 29.6
TimingResearch Crowd Forecast Prediction: 57% Chance Higher
This prediction is an attempt by the editor of this newsletter to use the full 6+ year history of data collected from this project to forecast a probability estimate for whether this week’s sentiment is going to be correct and ultimately what the markets will do this coming week.
Details: Last week’s majority sentiment from the survey was 52.9% predicting Higher, and the Crowd Forecast Indicator prediction was 60% chance Higher; the S&P500 closed 4.96% Lower for the week. This week’s majority sentiment from the survey is 61.1% predicting Lower but with a much greater average confidence from those who are predicting Lower. Similar conditions have occurred 77 times in the previous 350 weeks, with the majority sentiment (Lower) being correct 43% of the time and with an average S&P500 move of 0.33% Higher for the week. Based on that history, the TimingResearch Crowd Forecast Indicator is forecasting a 57% Chance that the S&P500 is going to move Higher this coming week.
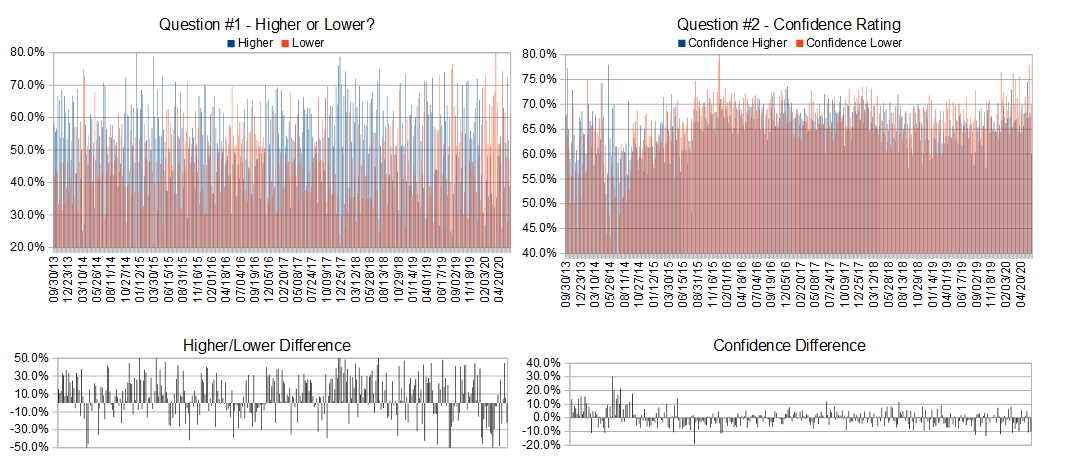
Raw Data Page (raw data files include full history spreadsheet and the above charts):
TimingResearch.com/data.
[AD] eBook: TSLA Options Trader (Complete Strategy Guide)
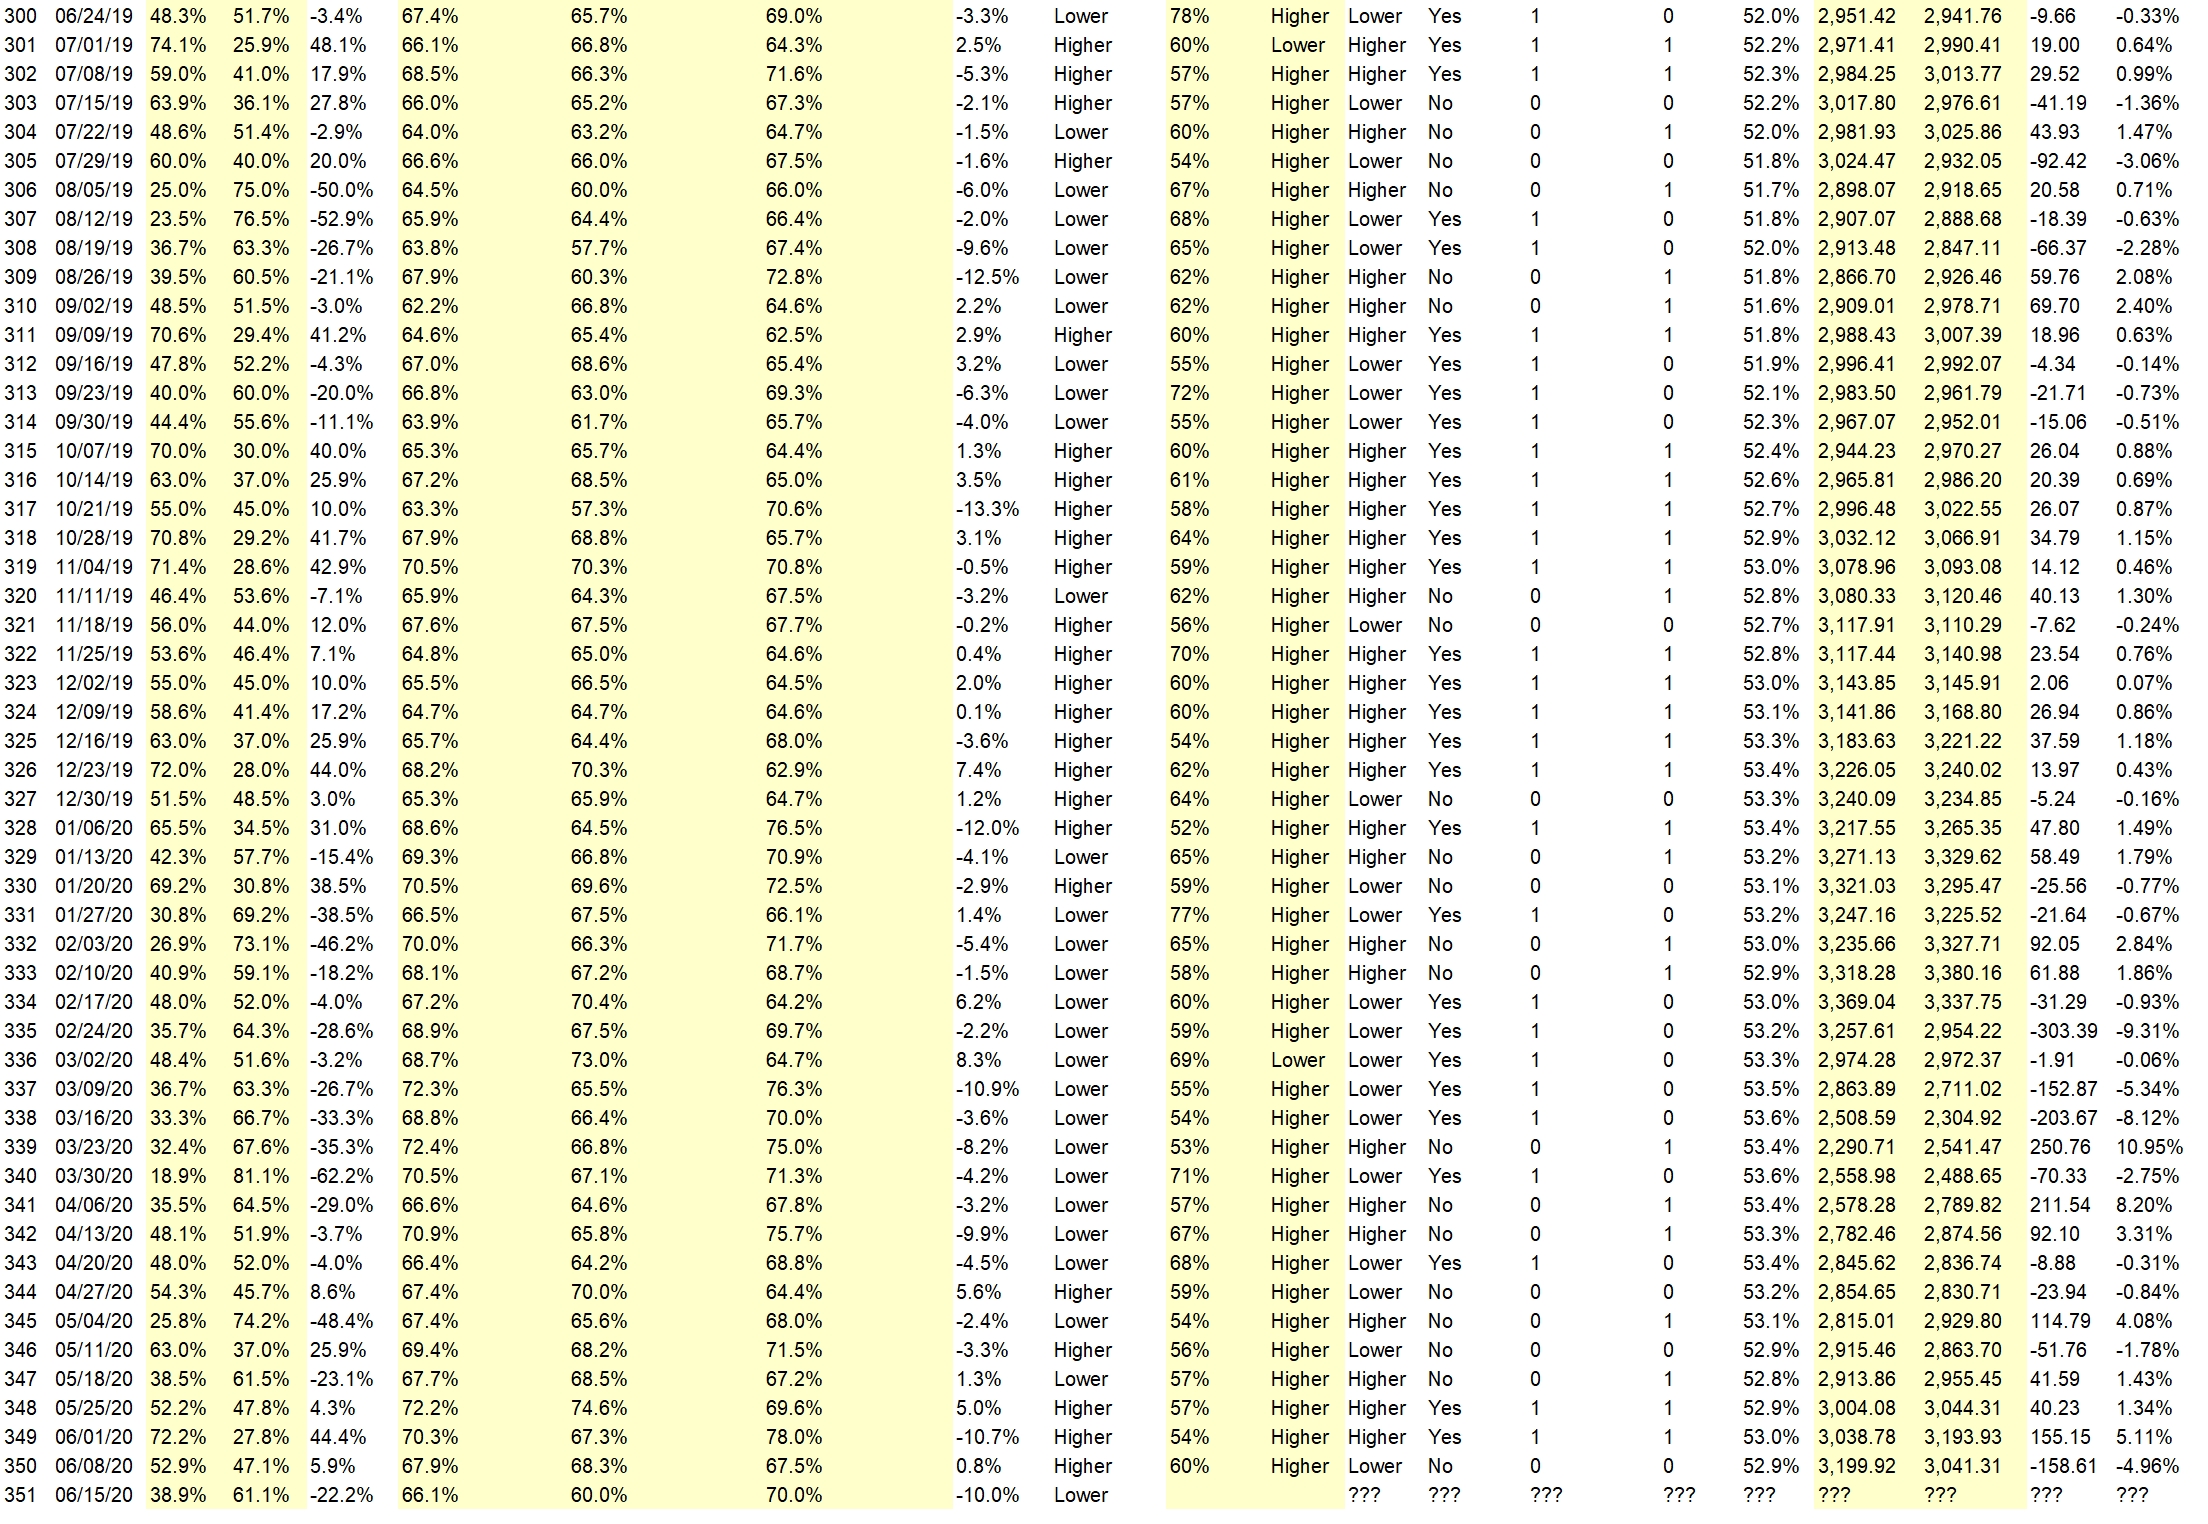
Full Weekly Results (full version of this chart available in the raw data spreadsheet for this week, “Date” field below lists the Monday of the week being predicted).
Overall Sentiment All-Time “Correct” Percentage: 52.9%
Overall Sentiment 52-Week “Correct” Percentage: 58.8%
Overall Sentiment 12-Week “Correct” Percentage: 36.4%
Only the previous 52 weeks of data are shown below, please download the raw data to see the full range of past data.
Weekly Reports Page: TimingResearch.com/reports
Raw Data Page: TimingResearch.com/rawdata
Current Survey Page: TimingResearch.com/currentsurvey
Any feedback: TimingResearch.com/contact
Email Alerts
Make sure you don’t miss all the future reports, show reminders, and bonus offers from TimingResearch, enter your best email here:
By signing up you agree to receive newsletter and marketing emails. You can unsubscribe at any time.
Privacy Policies
NOTE: The following open-ended answers are solely the opinions of the anonymous respondents to this survey. Responses are mostly unedited, but some have been reformatted slightly for to make them easier to read. Some irrelevant responses (e.g. “none”), or anything obviously fake, or copy and pasted responses have been omitted. All-caps responses have been changed to all lowercase. All responses for each week, unedited, are available in the raw data spreadsheets at TimingResearch.com/data.
Question #3. For your answer to Question #1, please share what specific reason(s) you think the S&P500 will be heading the direction you chose.
“Higher” Respondent Answers:
• FED wull keep flooding the market with liquidity
• Being contrarian
• Bounce back from Thursday
• LT Trend/bounce
• High liquidity, people isbuying on the dip.
“Lower” Respondent Answers:
• Overbought for weeks. Too far too fast.
• The market is very high based on fundamentals and in lieu of the increasing virus threat
• A pull back is due as the recent rally has run out o steam
• The daily trend will change next week per moving averages.
• An island reversal (up-gap, then 4 days later, a down-gap) occurred over the last several days. That’s generally bearish. Also, the virus wants to hang around, which dims hopes for economic recovery this year.
• I belive in megafone pattern(weekly chart). Price going to pivot (down)
• Technical
• the US facing Two big problems now a days Corona and protests,the first time i have seen low confident level in the president Mr Trump,these could led market to negative side..
• We are in a depression
[AD] eBook: TSLA Options Trader (Complete Strategy Guide)
Question #4. What trading software/platform(s) do you use to execute your trades?
• Schwab streetssmart
• Fidessa, IB
• online broker has its own I don’t trade frequently
• Schwab
• Etrade
• E-Trade
• Trade station
• Tradestation
• MT4
• ava trade
• Td
Question #5. Additional Comments/Questions/Suggestions?
• Very volatile markets are likely to continue
• this is my first time entry on your website
[AD] eBook: TSLA Options Trader (Complete Strategy Guide)
Email Alerts
Make sure you don’t miss all the future reports, show reminders, and bonus offers from TimingResearch, enter your best email here:
By signing up you agree to receive newsletter and marketing emails. You can unsubscribe at any time.
Privacy Policies
Crowd Forecast News Report #350
[AD] eBook: TSLA Options Trader (Complete Strategy Guide)The new TimingResearch report for the week has been posted, you can download the full PDF report with the link below or you can read the full report in this post below.
Click here to download report in PDF format: TRReport060720.pdf
Question #1. Which direction do you think the S&P500 index will move from this coming Monday’s open to Friday’s close (June 8th-12th)?
Higher: 52.9%
Lower: 47.1%
Higher/Lower Difference: 5.9%
Question #2. Rate your confidence in your answer to Question #2 by estimating the probability you have correctly predicted next week’s market move.
Average of All Responses: 67.9%
Average For “Higher” Responses: 68.3%
Average For “Lower” Responses: 67.5%
Higher/Lower Difference: 0.8%
Responses Submitted This Week: 18
52-Week Average Number of Responses: 30.1
TimingResearch Crowd Forecast Prediction: 60% Chance Higher
This prediction is an attempt by the editor of this newsletter to use the full 6+ year history of data collected from this project to forecast a probability estimate for whether this week’s sentiment is going to be correct and ultimately what the markets will do this coming week.
Details: Last week’s majority sentiment from the survey was 72.2% predicting Higher, and the Crowd Forecast Indicator prediction was 54% chance Higher; the S&P500 closed 5.11% Higher for the week. This week’s majority sentiment from the survey is 52.9% predicting Higher but with a much greater average confidence from those who are predicting Lower. Similar conditions have occurred 52 times in the previous 349 weeks, with the majority sentiment (Higher) being correct 60% of the time and with an average S&P500 move of 0.46% Higher for the week. Based on that history, the TimingResearch Crowd Forecast Indicator is forecasting a 60% Chance that the S&P500 is going to move Higher this coming week.
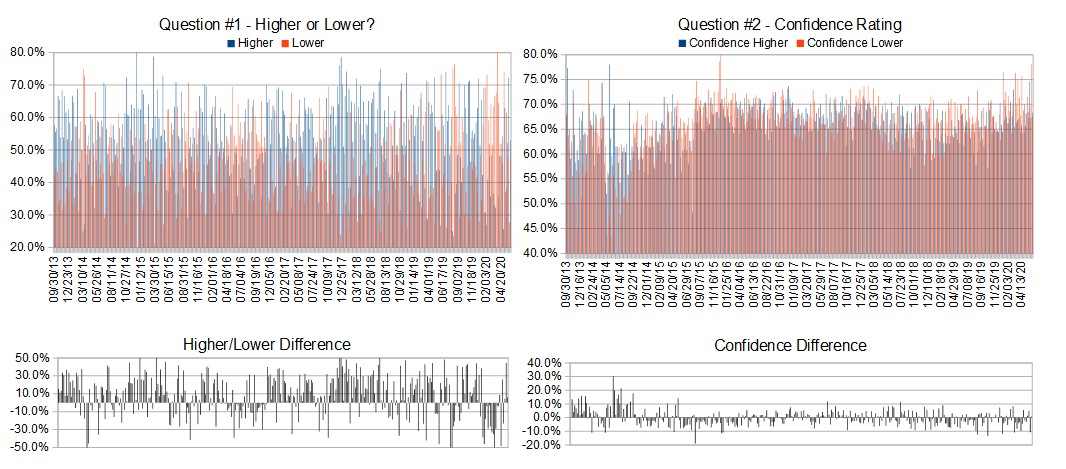
Raw Data Page (raw data files include full history spreadsheet and the above charts):
TimingResearch.com/data.
[AD] eBook: TSLA Options Trader (Complete Strategy Guide)
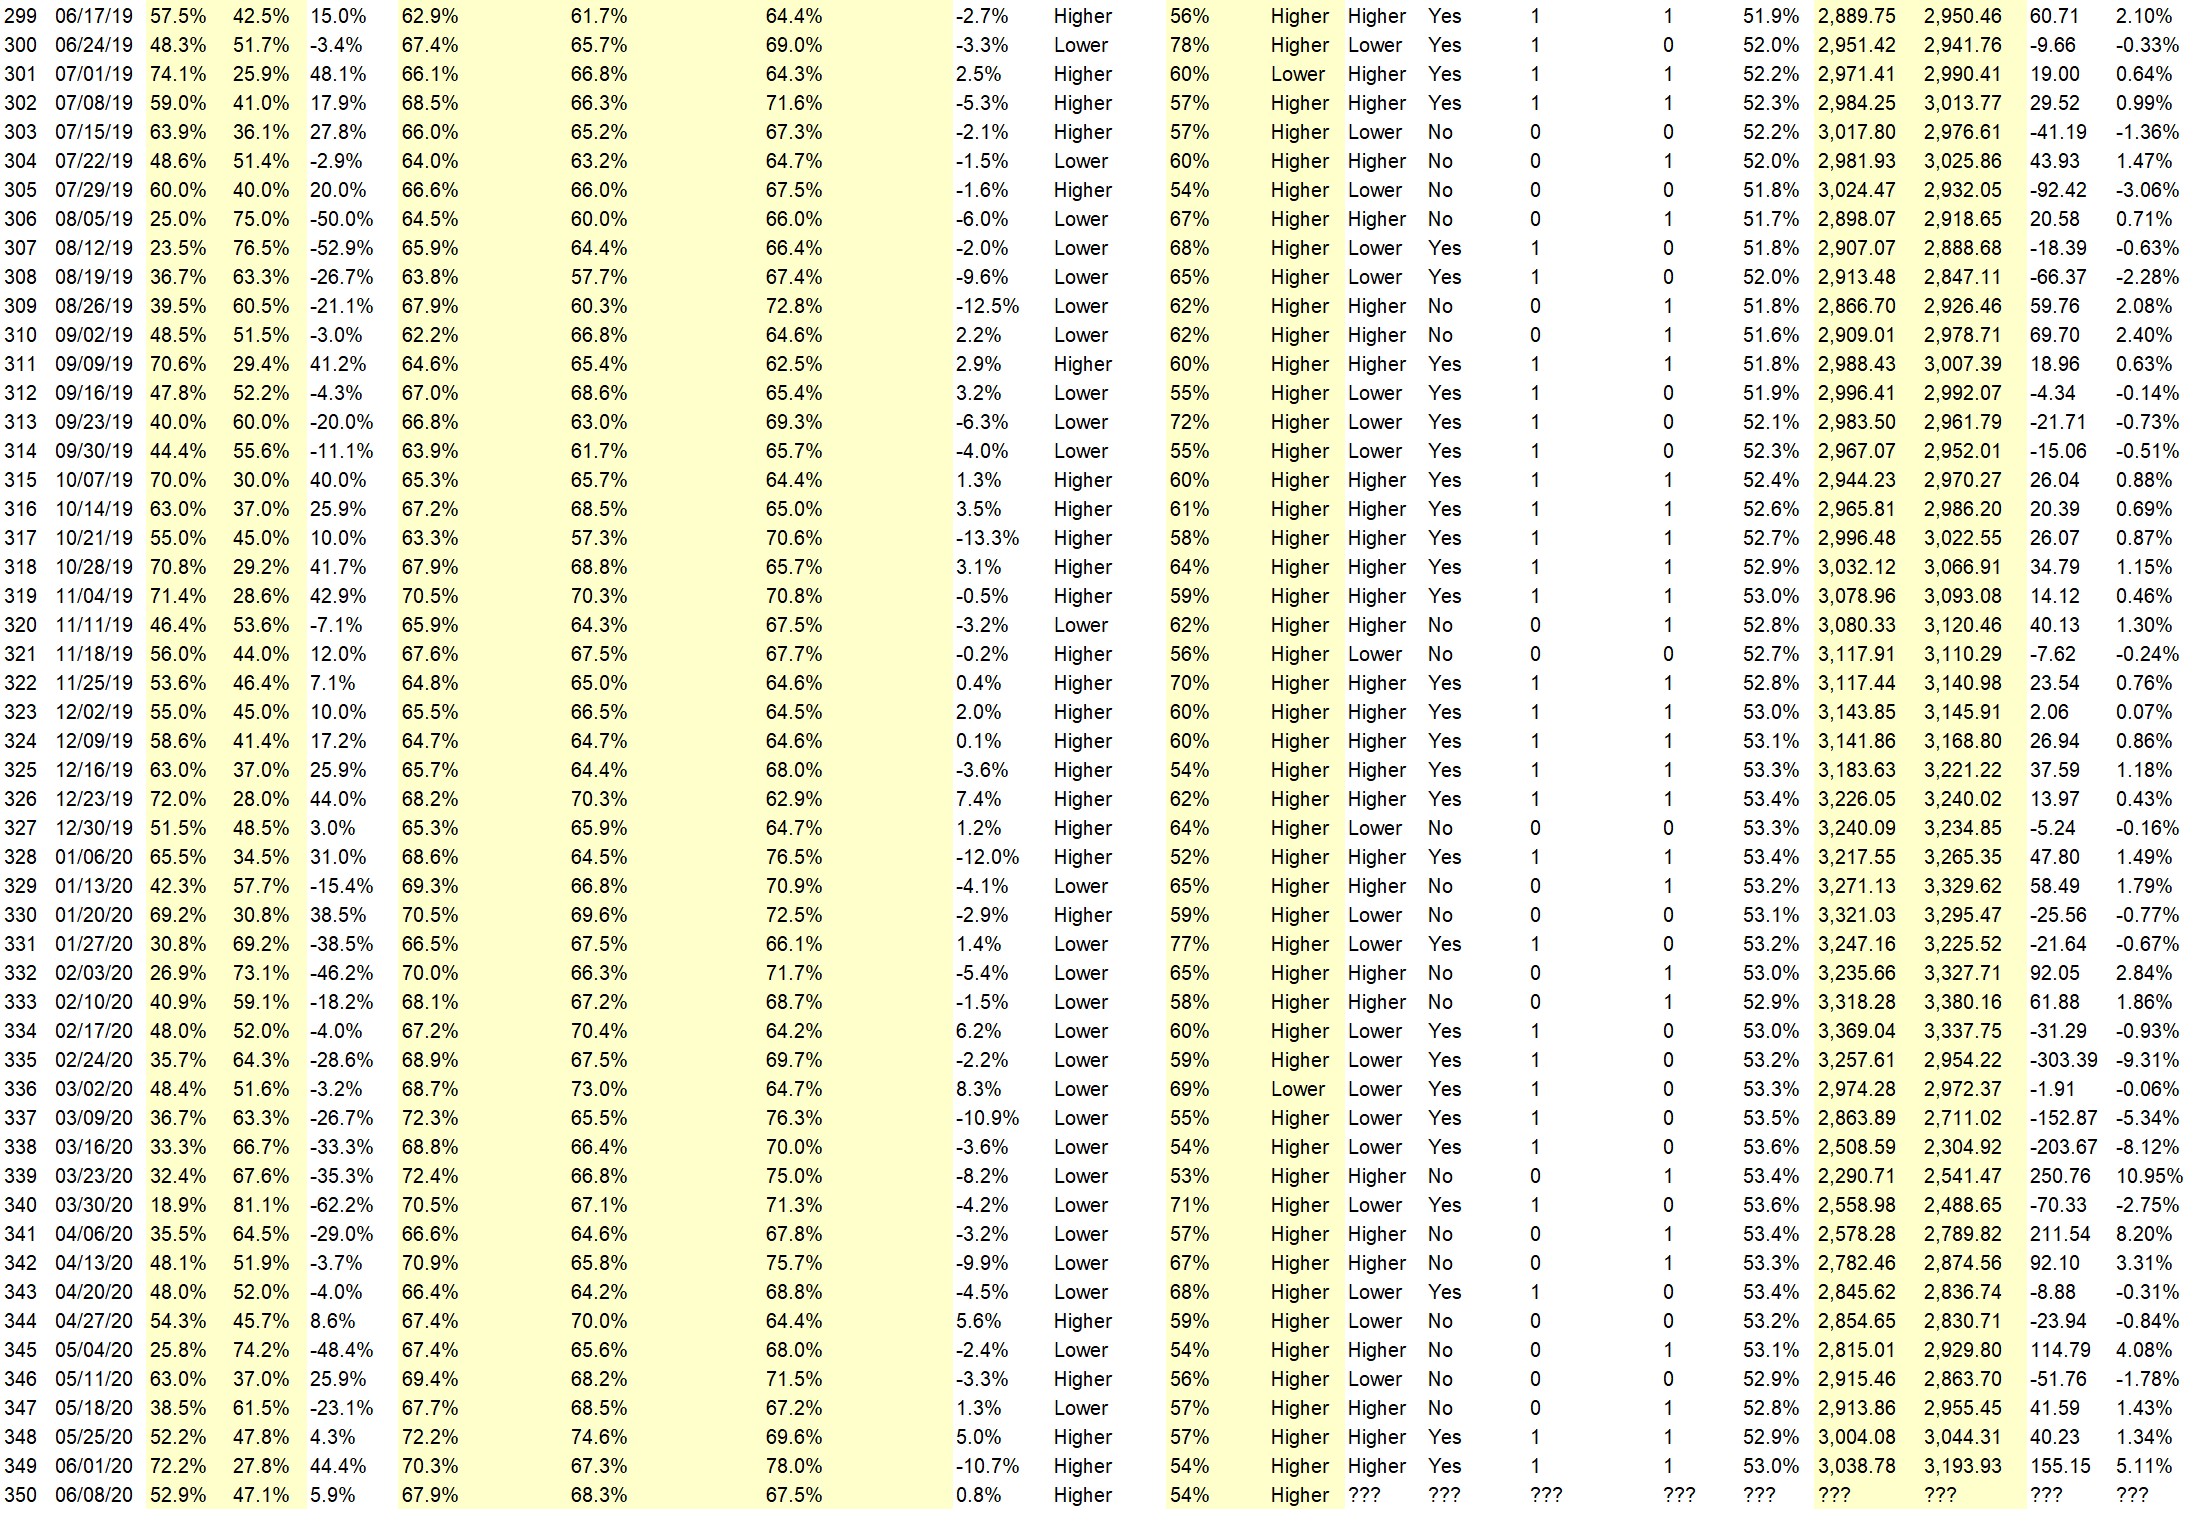
Full Weekly Results (full version of this chart available in the raw data spreadsheet for this week, “Date” field below lists the Monday of the week being predicted).
Overall Sentiment All-Time “Correct” Percentage: 53.0%
Overall Sentiment 52-Week “Correct” Percentage: 60.8%
Overall Sentiment 12-Week “Correct” Percentage: 36.4%
Only the previous 52 weeks of data are shown below, please download the raw data to see the full range of past data.
Weekly Reports Page: TimingResearch.com/reports
Raw Data Page: TimingResearch.com/rawdata
Current Survey Page: TimingResearch.com/currentsurvey
Any feedback: TimingResearch.com/contact
Email Alerts
Make sure you don’t miss all the future reports, show reminders, and bonus offers from TimingResearch, enter your best email here:
By signing up you agree to receive newsletter and marketing emails. You can unsubscribe at any time.
Privacy Policies
NOTE: The following open-ended answers are solely the opinions of the anonymous respondents to this survey. Responses are mostly unedited, but some have been reformatted slightly for to make them easier to read. Some irrelevant responses (e.g. “none”), or anything obviously fake, or copy and pasted responses have been omitted. All-caps responses have been changed to all lowercase. All responses for each week, unedited, are available in the raw data spreadsheets at TimingResearch.com/data.
Question #3. For your answer to Question #1, please share what specific reason(s) you think the S&P500 will be heading the direction you chose.
“Higher” Respondent Answers:
• momentum
• Technical: candle+trend, nfp release was positive
• Good unemployment report. It looks like a V shaped economic recovery.
• More of the economy opens giving greater confidence that we are on the upswing but could be impacted by the growing domestic unrest.
• Momentum is good, which suggests more follow through. Expecting for this week: rotation into lagging stocks, buying of dips, S&P holds up okay.
• Trend
“Lower” Respondent Answers:
• Still large number of people unemployed. Not enough jobs too fill the unemployment gap.
• more protests
• The rise has moved too fast. Bound to have some correction.
• Profit taking from last week
• Market has been overbought for a couple weeks. Last friday the rubberband stretched so far that it needs to correct for a little while. Revert to the average or lower before it continues to rocket higher as things continue to open up. Our Covid 19 numbers were the highest they have been last week but without drastic increase in hospitalizations or deaths so far. The virus might be mutating to a less lethal form while still causing herd immunity- hopefully.
• Volume flow
[AD] eBook: TSLA Options Trader (Complete Strategy Guide)
Question #4. What styles of trading or methodologies have you had the most success with?
• Long term. Buy and hold.
• Buying when marker crashes
• Analyze charts and trade accordingly.
• To many to share
• Swing trading
• Supply and demand
• Buying a stock tied to crypto. Selling puts for premium, and following leads and trending stocks from Tradesmith, Jeff Brown, Jeff Clark and Tika Tawari, Educated using Option Alpha etc.
Question #5. Additional Comments/Questions/Suggestions?
• none
[AD] eBook: TSLA Options Trader (Complete Strategy Guide)
Email Alerts
Make sure you don’t miss all the future reports, show reminders, and bonus offers from TimingResearch, enter your best email here:
By signing up you agree to receive newsletter and marketing emails. You can unsubscribe at any time.
Privacy Policies
Crowd Forecast News Report #349
[AD] eBook: TSLA Options Trader (Complete Strategy Guide)The new TimingResearch report for the week has been posted, you can download the full PDF report with the link below or you can read the full report in this post below.
Click here to download report in PDF format: TRReport053120.pdf
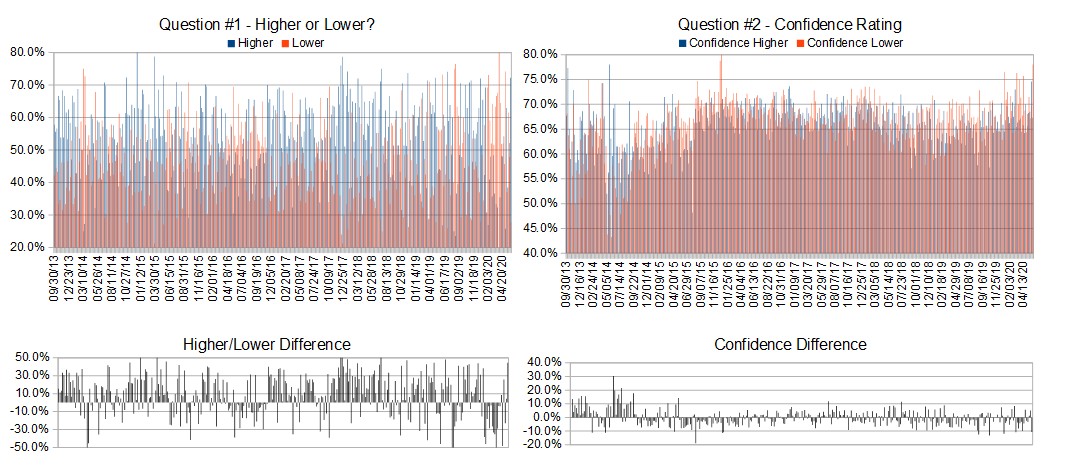
Question #1. Which direction do you think the S&P500 index will move from this coming Monday’s open to Friday’s close (June 1st-5th)?
Higher: 72.2%
Lower: 27.8%
Higher/Lower Difference: 44.4%
Question #2. Rate your confidence in your answer to Question #2 by estimating the probability you have correctly predicted next week’s market move.
Average of All Responses: 70.3%
Average For “Higher” Responses: 67.3%
Average For “Lower” Responses: 78.0%
Higher/Lower Difference: -10.7%
Responses Submitted This Week: 19
52-Week Average Number of Responses: 30.5
TimingResearch Crowd Forecast Prediction: 54% Chance Higher
This prediction is an attempt by the editor of this newsletter to use the full 6+ year history of data collected from this project to forecast a probability estimate for whether this week’s sentiment is going to be correct and ultimately what the markets will do this coming week.
Details: Last week’s majority sentiment from the survey was 52.2% predicting Higher, and the Crowd Forecast Indicator prediction was 57% chance Higher; the S&P500 closed 1.34% Higher for the week. This week’s majority sentiment from the survey is 72.2% predicting Higher (highest percentage in almost a year) but with a much greater average confidence from those who are predicting Lower. Similar conditions have occurred 41 times in the previous 348 weeks, with the majority sentiment (Higher) being correct 57% of the time but with an average S&P500 move of 0.24% Lower for the week. Based on that history, the TimingResearch Crowd Forecast Indicator is forecasting a 54% Chance that the S&P500 is going to move Higher this coming week.
Raw Data Page (raw data files include full history spreadsheet and the above charts):
TimingResearch.com/data.
[AD] eBook: TSLA Options Trader (Complete Strategy Guide)
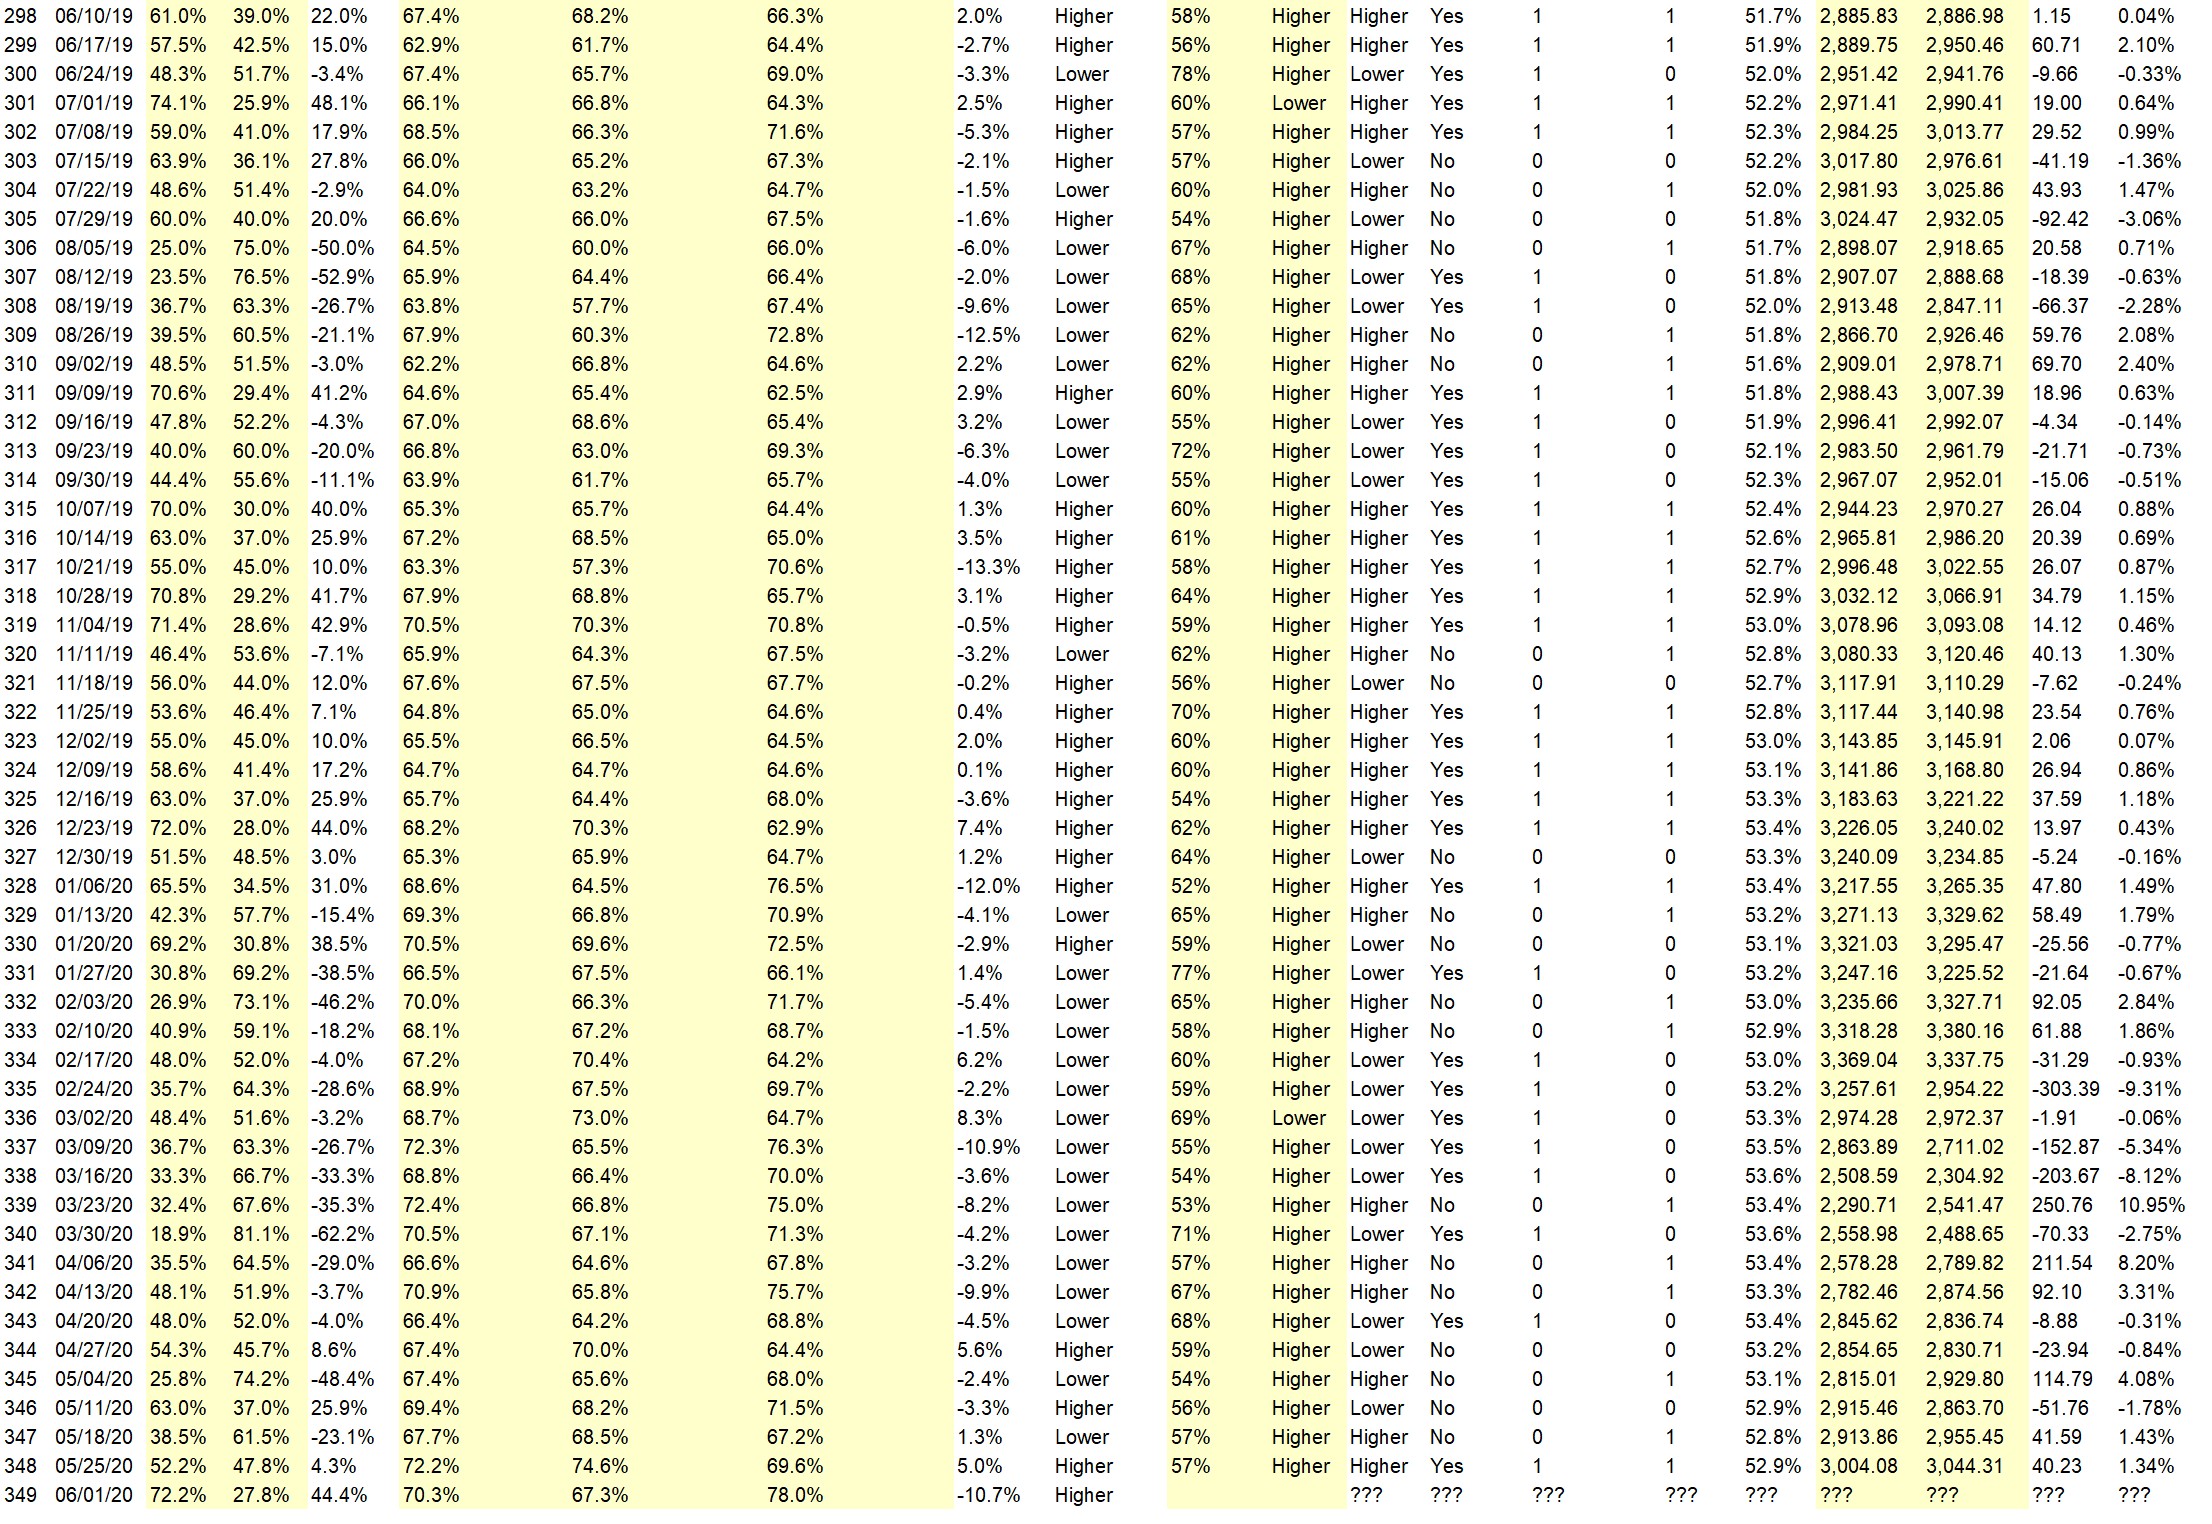
Full Weekly Results (full version of this chart available in the raw data spreadsheet for this week, “Date” field below lists the Monday of the week being predicted).
Overall Sentiment All-Time “Correct” Percentage: 52.9%
Overall Sentiment 52-Week “Correct” Percentage: 60.8%
Overall Sentiment 12-Week “Correct” Percentage: 36.4%
Only the previous 52 weeks of data are shown below, please download the raw data to see the full range of past data.
Weekly Reports Page: TimingResearch.com/reports
Raw Data Page: TimingResearch.com/rawdata
Current Survey Page: TimingResearch.com/currentsurvey
Any feedback: TimingResearch.com/contact
Email Alerts
Make sure you don’t miss all the future reports, show reminders, and bonus offers from TimingResearch, enter your best email here:
By signing up you agree to receive newsletter and marketing emails. You can unsubscribe at any time.
Privacy Policies
NOTE: The following open-ended answers are solely the opinions of the anonymous respondents to this survey. Responses are mostly unedited, but some have been reformatted slightly for to make them easier to read. Some irrelevant responses (e.g. “none”), or anything obviously fake, or copy and pasted responses have been omitted. All-caps responses have been changed to all lowercase. All responses for each week, unedited, are available in the raw data spreadsheets at TimingResearch.com/data.
Question #3. For your answer to Question #1, please share what specific reason(s) you think the S&P500 will be heading the direction you chose.
“Higher” Respondent Answers:
• Price action
• Trend
• Price is above 200 DMA. VIX go down.
• Things getting going in many states
• Well, we’ve came this far on stimulus, what’s the issue? With economy opening up and those provinces, states , countries 1st to do so will benefit most. Of course those countries who kept operating are already farther ahead!!
• increasing positive momentum
• Momentum
• business is re-opening
• next week will be up
“Lower” Respondent Answers:
• riots and more business closing
• The S&P hit it’s high last week on 5/28 a the top of a Bollinger band and at a resistance level. A dip from there should be probable. Also, the US-China trade uncertainty could discourage investors form buying equities.
• Unrest spreading, COVID-19 cases up due to not distance during memorial weekend, and market needs a breath.
• Cyclical reason
[AD] eBook: TSLA Options Trader (Complete Strategy Guide)
Question #4. What indicator influences your trading the most?
• trend
• RSI
• I’m simple Most time don’t have any indicators on charts. Just price Bar charts
• Support/resistance levels and Bollinger bands
• MACD
• macd
• MA, CCI
• Look to left; Price Action; volume action; CCI and Market Sediment
• MACD, weekly, daily, 30 minute chart.
Question #5. Additional Comments/Questions/Suggestions?
• none
[AD] eBook: TSLA Options Trader (Complete Strategy Guide)
Email Alerts
Make sure you don’t miss all the future reports, show reminders, and bonus offers from TimingResearch, enter your best email here:
By signing up you agree to receive newsletter and marketing emails. You can unsubscribe at any time.
Privacy Policies
Crowd Forecast News Report #348
[AD] eBook: TSLA Options Trader (Complete Strategy Guide)The new TimingResearch report for the week has been posted, you can download the full PDF report with the link below or you can read the full report in this post below.
Click here to download report in PDF format: TRReport052520.pdf
Question #1. Which direction do you think the S&P500 index will move from this coming Tuesday’s open to Friday’s close (May 26th to 29th)?
Higher: 52.2%
Lower: 47.8%
Higher/Lower Difference: 4.3%
Question #2. Rate your confidence in your answer to Question #2 by estimating the probability you have correctly predicted next week’s market move.
Average of All Responses: 72.2%
Average For “Higher” Responses: 74.6%
Average For “Lower” Responses: 69.6%
Higher/Lower Difference: 5.0%
Responses Submitted This Week: 24
52-Week Average Number of Responses: 31.1
TimingResearch Crowd Forecast Prediction: 57% Chance Higher
This prediction is an attempt by the editor of this newsletter to use the full 6+ year history of data collected from this project to forecast a probability estimate for whether this week’s sentiment is going to be correct and ultimately what the markets will do this coming week.
Details: Last week’s majority sentiment from the survey was 61.5% predicting Lower, and the Crowd Forecast Indicator prediction was 57% chance Higher; the S&P500 closed 1.43% Higher for the week. This week’s majority sentiment from the survey is 52.2% predicting Higher with a greater average confidence from those who are predicting Lower. Similar conditions have occurred 30 times in the previous 347 weeks, with the majority sentiment (Higher) being correct 57% of the time and with an average S&P500 move of 0.51% Lower for the week. Based on that history, the TimingResearch Crowd Forecast Indicator is forecasting a 57% Chance that the S&P500 is going to move Higher this coming week.
Raw Data Page (raw data files include full history spreadsheet and the above charts):
TimingResearch.com/data.
[AD] eBook: TSLA Options Trader (Complete Strategy Guide)
Full Weekly Results (full version of this chart available in the raw data spreadsheet for this week, “Date” field below lists the Monday of the week being predicted).
Overall Sentiment All-Time “Correct” Percentage: 52.8%
Overall Sentiment 52-Week “Correct” Percentage: 58.8%
Overall Sentiment 12-Week “Correct” Percentage: 36.4%
Only the previous 52 weeks of data are shown below, please download the raw data to see the full range of past data.
Weekly Reports Page: TimingResearch.com/reports
Raw Data Page: TimingResearch.com/rawdata
Current Survey Page: TimingResearch.com/currentsurvey
Any feedback: TimingResearch.com/contact
Email Alerts
Make sure you don’t miss all the future reports, show reminders, and bonus offers from TimingResearch, enter your best email here:
By signing up you agree to receive newsletter and marketing emails. You can unsubscribe at any time.
Privacy Policies
NOTE: The following open-ended answers are solely the opinions of the anonymous respondents to this survey. Responses are mostly unedited, but some have been reformatted slightly for to make them easier to read. Some irrelevant responses (e.g. “none”), or anything obviously fake, or copy and pasted responses have been omitted. All-caps responses have been changed to all lowercase. All responses for each week, unedited, are available in the raw data spreadsheets at TimingResearch.com/data.
Question #3. For your answer to Question #1, please share what specific reason(s) you think the S&P500 will be heading the direction you chose.
“Higher” Respondent Answers:
• Why not, American unemployment may reach over 30%, consumer spending super low, Fed printing money, so why wouldn’t the market go higher? Either way, were gonna be alright!!
• FED loosening Don’t fight the FED
• More states opening
• Current trend still up, but depending on certain resistance levels, we could go up, then down – also if “the idiot” ratchets up the fight with China…etc.
• S&P weekly chart points up and MACD Histogram turned positive.
• The S&P reached a new May high this past week; and is holding up well near that level. This suggests that the S&P will probably reach higher, maybe to 3060 before it turns down.
• Everything is starting to open up again
“Lower” Respondent Answers:
• I’m expecting some sort of bad COVID news soon
• We are range bound now so been up last week and down now.
• I think is a resistant level is reaching around 3000 s&p it will bound back lower at some point. Will see,,,,,,,,
• Earnings season over, reality kicks in.
• gdp’s announcment.
• FOMC Kaplan is talking of remedies economivally maybe i think i guess some maybe
[AD] eBook: TSLA Options Trader (Complete Strategy Guide)
Question #4. On May 19-21 TimingResearch and TradeOutLoud hosted 3 days of presentations with each day covering a different topic; STOCKS/OPTIONS on Tuesday, FOREX on Wednesday, FUTURES on Thursday. What other specific financial-related topics would you like to see covered in an all-day series of lectures like this? (btw The CFN show is off this coming week for the market holiday but back on June 1st)
• Talk about mechanical systems that work 90% of the time, is there such a system for stocks?
• FUTURES Options on Futures
• Market inside info. Like, who’s doing most of the pre & post market buying? Why do options have such a hard time going up, versus how EASY they can and do go down? Just this past week, a couple of my Netflix positions that don’t expire until June 19 & May 29th respectively, went down substantially (20%) with only a $1.61 move lower in the stock price. At the time that was a small fraction of 1%, since it was trading at $445 or so Why are earnings numbers all over the place? I’ve seen various “consensus” numbers on the same security, so obviously it’s not always a consensus. Further, after earnings report, I can look at Yahoo finance or TD Ameritrade and find one article saying the company beat earnings or rev, and another saying the opposite. What gives? And WHO decides that, in some cases, no matter how good the numbers (earnings, revenues, and outlook), the stock price is going down, even with a low PE stock, even without a recent run up in price, etc. I would like to know WHO is manipulating the market. I can guess, and I can surely guess why, but I’d like details. Unusual option activity – WHO are the players making some of these huge bets? Hedge funds? Billionaires? The JP Morgan’s of the world? Foreign players? It would be nice to know “what is really going on” in regards to all of these scenarios and more.
• I was looking forward to FUTURES, but disappointed. Jack gave a very good presentation, but won’t be able to use. I would like to see more FUTURES presentation tailored to small investors and teaching how to trade micros, more hands on type.
• profits using stop loss sell orders
Question #5. Additional Comments/Questions/Suggestions?
• Thank you for this platform, this is a great area to exchange ideas and thoughts, so thank you again! Mr. Donald Trump is the Best President since JFK!! Heaven and Earth support Mr. Trump 😇. Thank you Mr. President for the light you bring to the planet!! God Bless America and God Bless Mr. Trump!!
[AD] eBook: TSLA Options Trader (Complete Strategy Guide)
Email Alerts
Make sure you don’t miss all the future reports, show reminders, and bonus offers from TimingResearch, enter your best email here:
By signing up you agree to receive newsletter and marketing emails. You can unsubscribe at any time.
Privacy Policies
Crowd Forecast News Report #347
[AD] eBook: TSLA Options Trader (Complete Strategy Guide)The new TimingResearch report for the week has been posted, you can download the full PDF report with the link below or you can read the full report in this post below.
Click here to download report in PDF format: TRReport051720.pdf
Question #1. Which direction do you think the S&P500 index will move from this coming Monday’s open to Friday’s close (May 18th to 22nd)?
Higher: 38.5%
Lower: 61.5%
Higher/Lower Difference: -23.1%
Question #2. Rate your confidence in your answer to Question #2 by estimating the probability you have correctly predicted next week’s market move.
Average of All Responses: 67.7%
Average For “Higher” Responses: 68.5%
Average For “Lower” Responses: 67.2%
Higher/Lower Difference: 1.3%
Responses Submitted This Week: 27
52-Week Average Number of Responses: 31.2
TimingResearch Crowd Forecast Prediction: 57% Chance Higher
This prediction is an attempt by the editor of this newsletter to use the full 6+ year history of data collected from this project to forecast a probability estimate for whether this week’s sentiment is going to be correct and ultimately what the markets will do this coming week.
Details: Last week’s majority sentiment from the survey was 63.0% predicting Higher, and the Crowd Forecast Indicator prediction was 56% chance Higher; the S&P500 closed 1.78% Lower for the week. This week’s majority sentiment from the survey is 63.0% predicting Higher with a greater average confidence from those who are predicting Lower. Similar conditions have occurred 44 times in the previous 346 weeks, with the majority sentiment (Lower) being correct 43% of the time and with an average S&P500 move of 0.002% Lower for the week. Based on that history, the TimingResearch Crowd Forecast Indicator is forecasting a 57% Chance that the S&P500 is going to move Higher this coming week.
Raw Data Page (raw data files include full history spreadsheet and the above charts):
TimingResearch.com/data.
[AD] eBook: TSLA Options Trader (Complete Strategy Guide)
Full Weekly Results (full version of this chart available in the raw data spreadsheet for this week, “Date” field below lists the Monday of the week being predicted).
Overall Sentiment All-Time “Correct” Percentage: 52.9%
Overall Sentiment 52-Week “Correct” Percentage: 60.8%
Overall Sentiment 12-Week “Correct” Percentage: 45.5%
Only the previous 52 weeks of data are shown below, please download the raw data to see the full range of past data.
Weekly Reports Page: TimingResearch.com/reports
Raw Data Page: TimingResearch.com/rawdata
Current Survey Page: TimingResearch.com/currentsurvey
Any feedback: TimingResearch.com/contact
Email Alerts
Make sure you don’t miss all the future reports, show reminders, and bonus offers from TimingResearch, enter your best email here:
By signing up you agree to receive newsletter and marketing emails. You can unsubscribe at any time.
Privacy Policies
NOTE: The following open-ended answers are solely the opinions of the anonymous respondents to this survey. Responses are mostly unedited, but some have been reformatted slightly for to make them easier to read. Some irrelevant responses (e.g. “none”), or anything obviously fake, or copy and pasted responses have been omitted. All-caps responses have been changed to all lowercase. All responses for each week, unedited, are available in the raw data spreadsheets at TimingResearch.com/data.
Question #3. For your answer to Question #1, please share what specific reason(s) you think the S&P500 will be heading the direction you chose.
“Higher” Respondent Answers:
• Hello so thenks for all person I am okay and I am care one I am always thinking world the peoples good life coming everyday. All the best
• With the Feds throwing another 3 trillion to everyone, it has to go up.
• irrational exuberance
• Positive Governance opens up states fir business!
• People are starting back to work
• The herd is running
“Lower” Respondent Answers:
• Actually the market should flatten here
• Bearish engulfing on SPX daily.
• We are range bound now
• MGI
• In the daily chart we can see a Head and Shoulders pattern that just breakout the neck line with a negative divergence in MACD and high voloume
• China tension.
• The S&P has been in a trading range the last few weeks with momentum retreating. Financials & retail doing poorly. It’s about time for the S&P to roll over.
• candles formed a chart-pattern that signals the market wants to go down
• Technical analysis
• 1. Correction of recent rally is at serious low.
• Last big week of earnings and no really good news expected. Market beginning to pullback.
• news on the virus, bank failures due to non-payment of rent and mortgages
[AD] eBook: TSLA Options Trader (Complete Strategy Guide)
Question #4. What procedures do you use to monitor and evaluate your trading results and progress over time?
• I watch the financial news daily
• If I hit my targets.
• P&L
• Market profile
• Hey so thenks for you I am going to my conditions Is good no problem.
• Daily charting and advisory services.
• Portfolio value.
• chart-analytics & guidance from analysts
• Excel spreadsheet
• I have backdate testing
• Plots
• Basic resistence and support charting. Evaluate a consensus of TV “talking heads” experts dialogue.
• %winning trades and $balance
Question #5. Additional Comments/Questions/Suggestions?
• Hello so thenks for everyone all the best
• The markets should be in the dumper, but the Fed and and govt orgs are running the show. Kind of weird though-every time another 3-4 million people are laid off, the markets spike up!
• President Donald Trump Best President since JFK!!
[AD] eBook: TSLA Options Trader (Complete Strategy Guide)
Email Alerts
Make sure you don’t miss all the future reports, show reminders, and bonus offers from TimingResearch, enter your best email here:
By signing up you agree to receive newsletter and marketing emails. You can unsubscribe at any time.
Privacy Policies
Crowd Forecast News Report #346
[AD] eBook: TSLA Options Trader (Complete Strategy Guide)The new TimingResearch report for the week has been posted, you can download the full PDF report with the link below or you can read the full report in this post below.
Click here to download report in PDF format: TRReport051020.pdf
Question #1. Which direction do you think the S&P500 index will move from this coming Monday’s open to Friday’s close (May 4th to 8th)?
Higher: 63.0%
Lower: 37.0%
Higher/Lower Difference: 25.9%
Question #2. Rate your confidence in your answer to Question #2 by estimating the probability you have correctly predicted next week’s market move.
Average of All Responses: 69.4%
Average For “Higher” Responses: 68.2%
Average For “Lower” Responses: 71.5%
Higher/Lower Difference: -3.3%
Responses Submitted This Week: 30
52-Week Average Number of Responses: 31.6
TimingResearch Crowd Forecast Prediction: 56% Chance Higher
This prediction is an attempt by the editor of this newsletter to use the full 6+ year history of data collected from this project to forecast a probability estimate for whether this week’s sentiment is going to be correct and ultimately what the markets will do this coming week.
Details: Last week’s majority sentiment from the survey was 74.2% predicting Lower, and the Crowd Forecast Indicator prediction was 59% chance Higher; the S&P500 closed 0.84% Lower for the week. This week’s majority sentiment from the survey is 63.0% predicting Higher with a greater average confidence from those who are predicting Lower. Similar conditions have occurred 70 times in the previous 345 weeks, with the majority sentiment (Lower) being correct 56% of the time and with an average S&P500 move of 0.04% Lower for the week. Based on that history, the TimingResearch Crowd Forecast Indicator is forecasting a 56% Chance that the S&P500 is going to move Higher this coming week.
Raw Data Page (raw data files include full history spreadsheet and the above charts):
TimingResearch.com/data.
[AD] eBook: TSLA Options Trader (Complete Strategy Guide)
Full Weekly Results (full version of this chart available in the raw data spreadsheet for this week, “Date” field below lists the Monday of the week being predicted).
Overall Sentiment All-Time “Correct” Percentage: 53.1%
Overall Sentiment 52-Week “Correct” Percentage: 62.7%
Overall Sentiment 12-Week “Correct” Percentage: 54.5%
Only the previous 52 weeks of data are shown below, please download the raw data to see the full range of past data.
Weekly Reports Page: TimingResearch.com/reports
Raw Data Page: TimingResearch.com/rawdata
Current Survey Page: TimingResearch.com/currentsurvey
Any feedback: TimingResearch.com/contact
Email Alerts
Make sure you don’t miss all the future reports, show reminders, and bonus offers from TimingResearch, enter your best email here:
By signing up you agree to receive newsletter and marketing emails. You can unsubscribe at any time.
Privacy Policies
NOTE: The following open-ended answers are solely the opinions of the anonymous respondents to this survey. Responses are mostly unedited, but some have been reformatted slightly for to make them easier to read. Some irrelevant responses (e.g. “none”), or anything obviously fake, or copy and pasted responses have been omitted. All-caps responses have been changed to all lowercase. All responses for each week, unedited, are available in the raw data spreadsheets at TimingResearch.com/data.
Question #3. For your answer to Question #1, please share what specific reason(s) you think the S&P500 will be heading the direction you chose.
“Higher” Respondent Answers:
• Money Flowing in with nowhere else to go.
• People will be going back to work
• Why not? Nothing makes any sense so why shouldn’t it go higher?
• Because I’m short
• party on Garth deal with the reality of detiorating fundamentals
• momentum
• The FED’s manipulation
• Investors are still putting their money into the Fed-will-boost-the-economy game, lifting the S&P toward its next resistance at about 3000. At this time, the market is ignoring reality, which is that the Fed can’t cause the full-economy volume of people to book vacations or dine in restaurants when people are justifiably concerned about contracting the virus.
• governmemt putting money into the system. the spy now with attach the old highs.
• Lockdown to be lifted
“Lower” Respondent Answers:
• Markets having difficulty breaking Fibs 61.8% retracement from March 23rd bottom, and nearing top of Elliott Wave 5 from same bottom. In addition, there’s divergence from price with declining volume and momentum.
• all signs show red flags!
• Too many states reopening too soon causing a spike in COVID-19 cases
• Unemployment numbers
• Run up last week at end of week, and more bad economic news than good.
• I’m stupid
• The market is ignoring the real world. The Fed has pushed the market up. Is there still any more Fed money to continue the charade? The world will be lucky to be at 80% capacity 6 months from now, but the market says we’ll be at 100%+. Oh, and costs will have risen dramatically so earnings will be slower to recover than sales. Maybe the market will hold together until Q2 earnings arrive. But the Election year cycle is against it.
• it might go lower, because a lot of people are out of work, however it might go higher, for the gov is buying into the market, and they need money to pay for all these people who are now put on welfare, and business loans, which they ran out of money.
[AD] eBook: TSLA Options Trader (Complete Strategy Guide)
Question #4. What procedures do you use to monitor and evaluate your trading results and progress over time?
• review my account statements
• charts
• Look to the left.
• Day trading and following financials.
• techinical
• I do not do a great job with this. Would love some ideas. I mostly have ignored the FED at my own peril
• Profits and I need the bank statements
• Returns
• news, real news, not fake new, or news that talk bad about the president.
Question #5. Additional Comments/Questions/Suggestions?
• Hello Summer.. Very grateful I am for this platform to share ideas and thoughts, thank you!!
• false hope in the market.
[AD] eBook: TSLA Options Trader (Complete Strategy Guide)
Email Alerts
Make sure you don’t miss all the future reports, show reminders, and bonus offers from TimingResearch, enter your best email here:
By signing up you agree to receive newsletter and marketing emails. You can unsubscribe at any time.
Privacy Policies
Crowd Forecast News Report #345
[AD] eBook: TSLA Options Trader (Complete Strategy Guide)The new TimingResearch report for the week has been posted, you can download the full PDF report with the link below or you can read the full report in this post below.
Click here to download report in PDF format: TRReport050320.pdf
Question #1. Which direction do you think the S&P500 index will move from this coming Monday’s open to Friday’s close (May 4th to 8th)?
Higher: 25.8%
Lower: 74.2%
Higher/Lower Difference: -48.4%
Question #2. Rate your confidence in your answer to Question #2 by estimating the probability you have correctly predicted next week’s market move.
Average of All Responses: 67.4%
Average For “Higher” Responses: 65.6%
Average For “Lower” Responses: 68.0%
Higher/Lower Difference: -2.4%
Responses Submitted This Week: 31
52-Week Average Number of Responses: 31.7
TimingResearch Crowd Forecast Prediction: 54% Chance Higher
This prediction is an attempt by the editor of this newsletter to use the full 6+ year history of data collected from this project to forecast a probability estimate for whether this week’s sentiment is going to be correct and ultimately what the markets will do this coming week.
Details: Last week’s majority sentiment from the survey was 54.3% predicting Higher, and the Crowd Forecast Indicator prediction was 59% chance Higher; the S&P500 closed 0.84% Lower for the week. This week’s majority sentiment from the survey is 74.2% predicting Lower with a greater average confidence from those who are predicting Lower. Similar conditions have occurred 52 times in the previous 344 weeks, with the majority sentiment (Lower) being correct 46% of the time and with an average S&P500 move of 0.28% Higher for the week. Based on that history, the TimingResearch Crowd Forecast Indicator is forecasting a 54% Chance that the S&P500 is going to move Higher this coming week.
Raw Data Page (raw data files include full history spreadsheet and the above charts):
TimingResearch.com/data.
[AD] eBook: TSLA Options Trader (Complete Strategy Guide)
Full Weekly Results (full version of this chart available in the raw data spreadsheet for this week, “Date” field below lists the Monday of the week being predicted).
Overall Sentiment All-Time “Correct” Percentage: 53.2%
Overall Sentiment 52-Week “Correct” Percentage: 62.7%
Overall Sentiment 12-Week “Correct” Percentage: 63.6%
Only the previous 52 weeks of data are shown below, please download the raw data to see the full range of past data.
Weekly Reports Page: TimingResearch.com/reports
Raw Data Page: TimingResearch.com/rawdata
Current Survey Page: TimingResearch.com/currentsurvey
Any feedback: TimingResearch.com/contact
Email Alerts
Make sure you don’t miss all the future reports, show reminders, and bonus offers from TimingResearch, enter your best email here:
By signing up you agree to receive newsletter and marketing emails. You can unsubscribe at any time.
Privacy Policies
NOTE: The following open-ended answers are solely the opinions of the anonymous respondents to this survey. Responses are mostly unedited, but some have been reformatted slightly for to make them easier to read. Some irrelevant responses (e.g. “none”), or anything obviously fake, or copy and pasted responses have been omitted. All-caps responses have been changed to all lowercase. All responses for each week, unedited, are available in the raw data spreadsheets at TimingResearch.com/data.
Question #3. For your answer to Question #1, please share what specific reason(s) you think the S&P500 will be heading the direction you chose.
“Higher” Respondent Answers:
• Pull back in the short term up trend
• Mkt very low now.
• low interest rates accomodative Fed
• Holding their noses and buying?
• Earnings will not be as bad as expected but companies are better not forecasting future earnings
“Lower” Respondent Answers:
• Market consolidating and beginning mean reversion move
• Risk off sentiment, profit taking and a key reversal on the chart.
• Fed stimulus tsunami slowing. Reality of covid-19 slow recovery setting in.
• The rally over the past weeks did not have much volume, far less than the volume on the way down before that. The stock market has to be wary of the continued effect of the virus on many businesses; too soon to look past that.
• The downturn will be the next part of the “W” for our charts.
• Economic slowdown
• For the month of April jobs number
• Market over stretched, consolidation, trend down….
• if the coronavirus drug works s&p will go higher if not it will go lower
• I just believe it is time for a pause of the recent move and for the “reality” of the economic situation to kind of kick in.
• Real economic data be reported will continue to deteriorate. Companies will refrain from buying their own stock, withdrawing a major support to markets. Seasonal “Sell in May”. Lower earnings and guidance or no guidance. Continued confusion/chaos in Washington.
• The Spys are starting to break downCharting
• Next week is a terrible week historically for the stock market. In addition, Friday was terrible and the potential for a trade war with China is not good.
• $sox which has been the leader is now rolling over.
• The stock market was expensive and overbought. The stock market started to weaken last week.
• Ugly coronavirus will force the market to follow up on Thursday and Friday’s sale
[AD] eBook: TSLA Options Trader (Complete Strategy Guide)
Question #4. What methods or techniques do you use to overcome the emotional aspects of trading?
• Charting
• I set stops
• What emotion ? This is a business.
• Don’t listen to noise
• Fixed rules for each portfolio
• rules proven by back tested statistics
• Stay calm and don’t jump to conclusions.
• Meditation, get grounded..
• I always go according to the CCI, volume indicators, if I have doubts I turn off the PC.
• Rule 1 When investing,remember Rome was not built in a day. Rule 2 When trading, remember Hiroshima/ Nagasaki were destroyed in a day. Trade the market that is, not the one you think should be.
• Take time off the computer screen. Have other hobbies.
• I use profits whether I set a dollar amount or a percentage gain.
• I try to keep the ups and downs in perspective and watch the trends.
• Indicators
Question #5. Additional Comments/Questions/Suggestions?
• People tired of hearing about China Flue. People know flue stage has run its course. On with the POSITIVE show now, let’s go team!!
• New here, looking forward to seeing your platform.
• Follow the crowd until it’s time not to follow the crowd.
[AD] eBook: TSLA Options Trader (Complete Strategy Guide)
Email Alerts
Make sure you don’t miss all the future reports, show reminders, and bonus offers from TimingResearch, enter your best email here:
By signing up you agree to receive newsletter and marketing emails. You can unsubscribe at any time.
Privacy Policies
Crowd Forecast News Report #344
[AD] eBook: TSLA Options Trader (Complete Strategy Guide)The new TimingResearch report for the week has been posted, you can download the full PDF report with the link below or you can read the full report in this post below.
Click here to download report in PDF format: TRReport042620.pdf
Question #1. Which direction do you think the S&P500 index will move from this coming Monday’s open to Friday’s close (April 20th to 24th)?
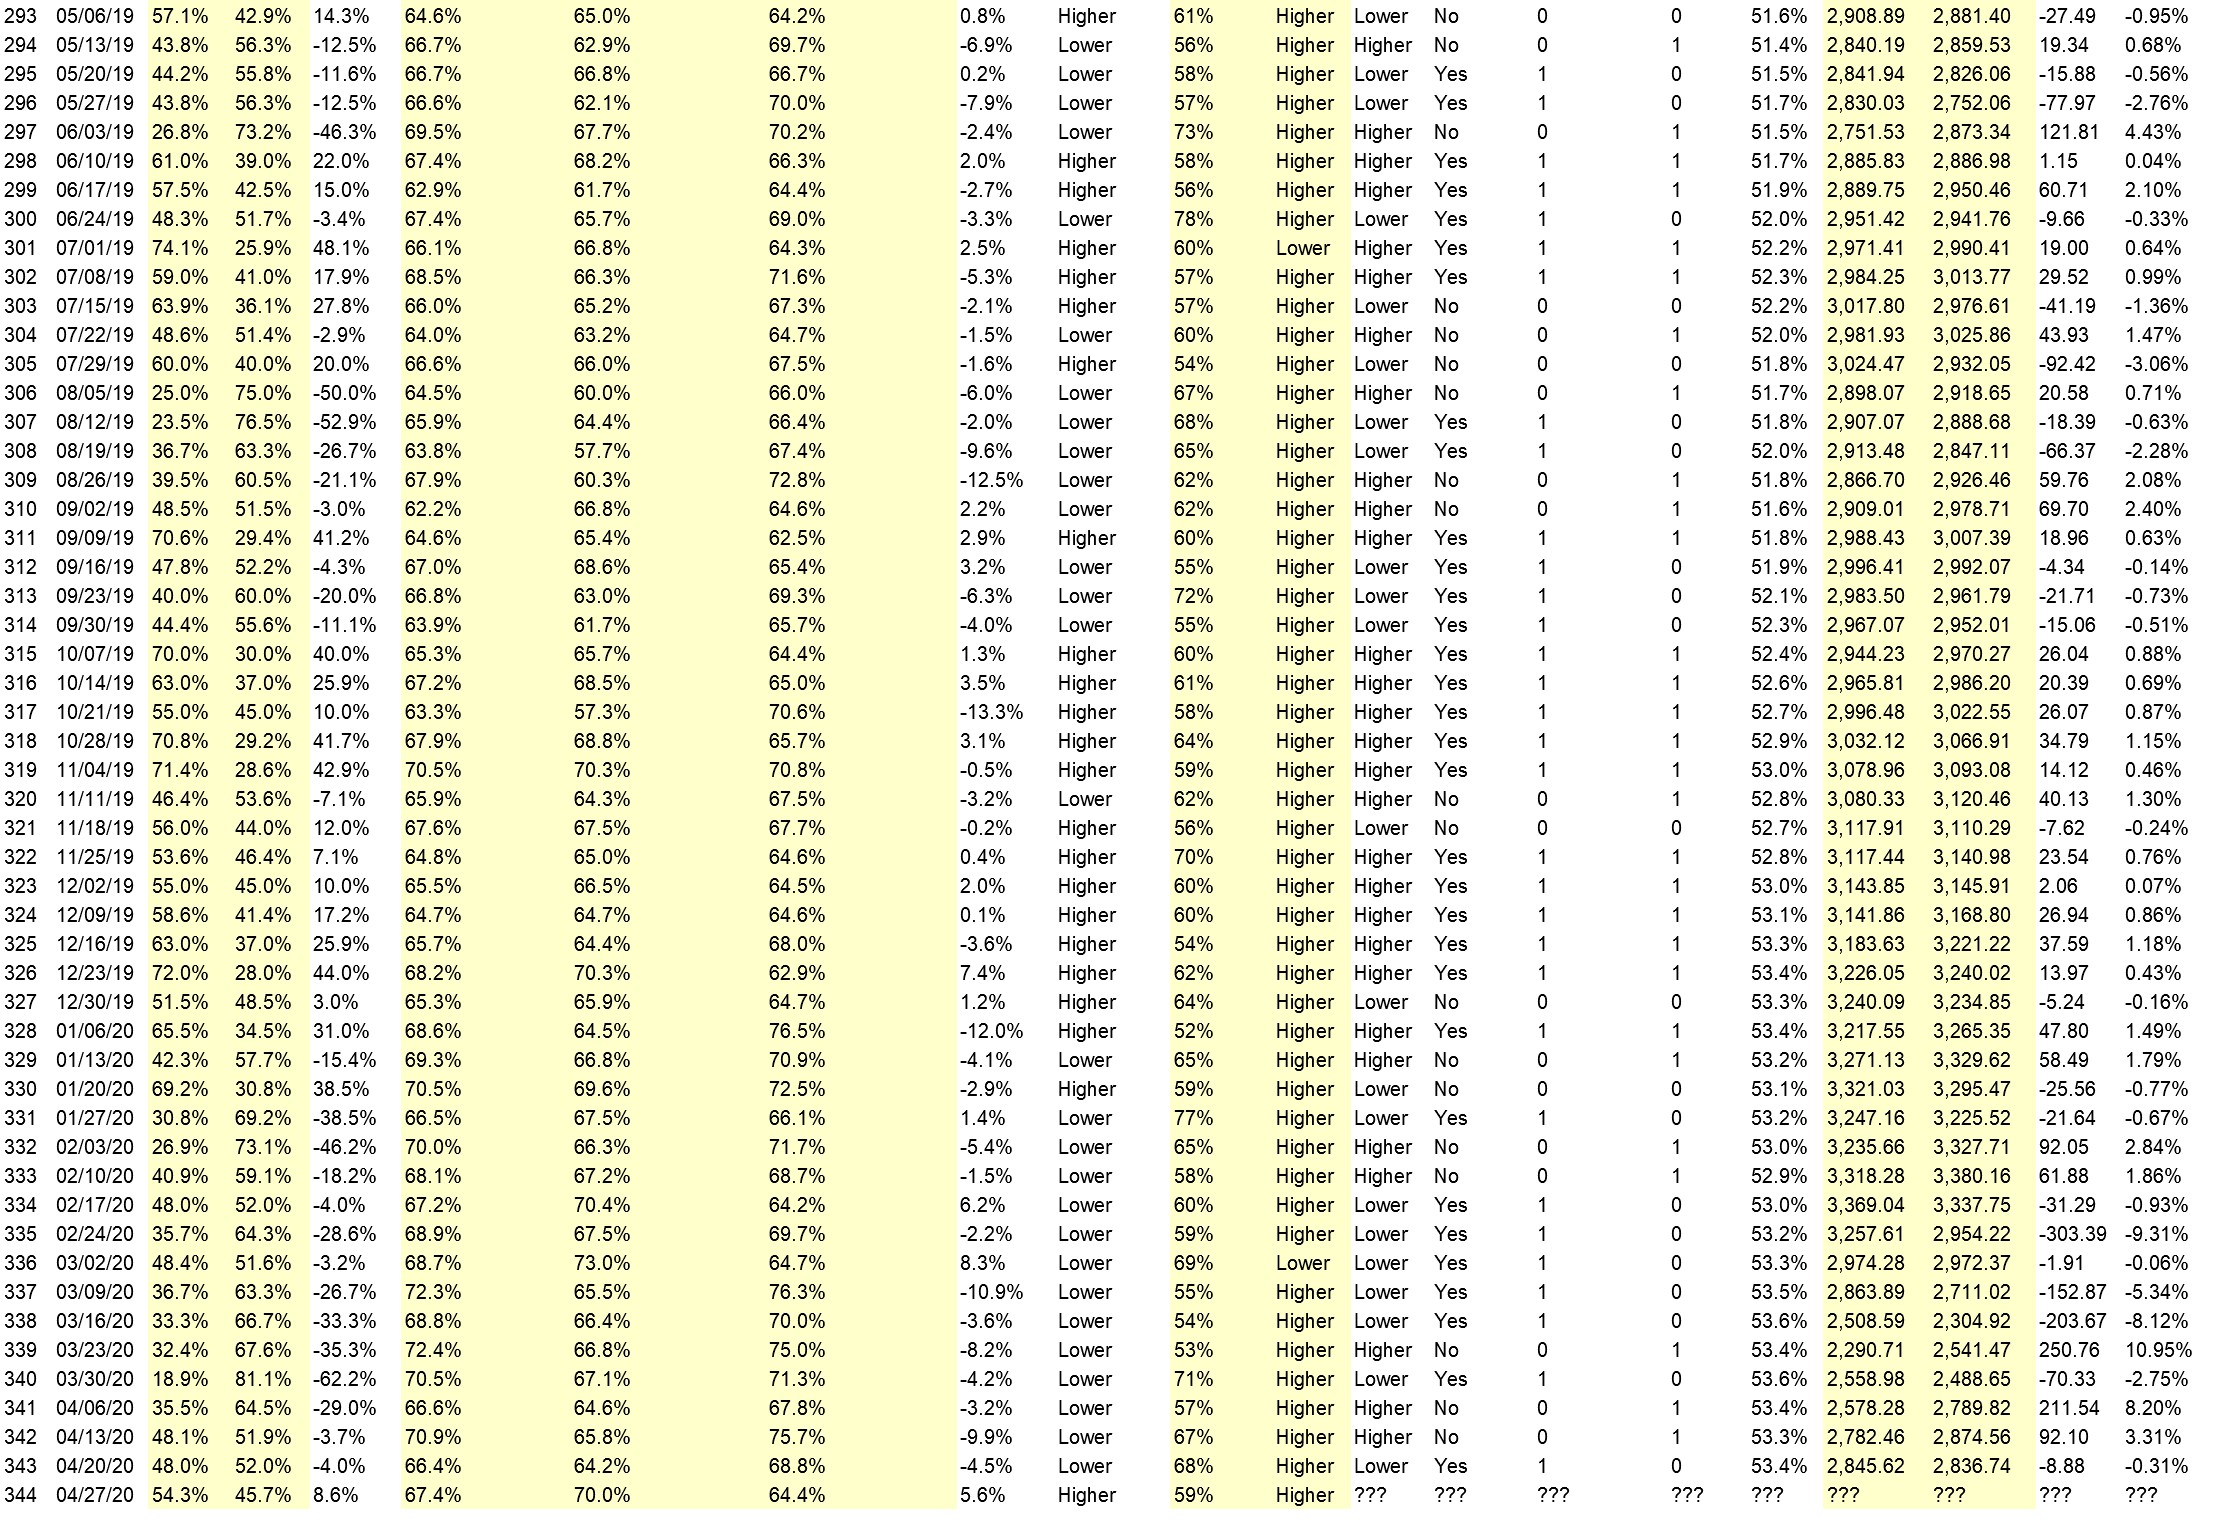
Higher: 54.3%
Lower: 45.7%
Higher/Lower Difference: 8.6%
Question #2. Rate your confidence in your answer to Question #2 by estimating the probability you have correctly predicted next week’s market move.
Average of All Responses: 67.4%
Average For “Higher” Responses: 70.0%
Average For “Lower” Responses: 64.4%
Higher/Lower Difference: 5.6%
Responses Submitted This Week: 36
52-Week Average Number of Responses: 31.6
TimingResearch Crowd Forecast Prediction: 59% Chance Higher
This prediction is an attempt by the editor of this newsletter to use the full 6+ year history of data collected from this project to forecast a probability estimate for whether this week’s sentiment is going to be correct and ultimately what the markets will do this coming week.
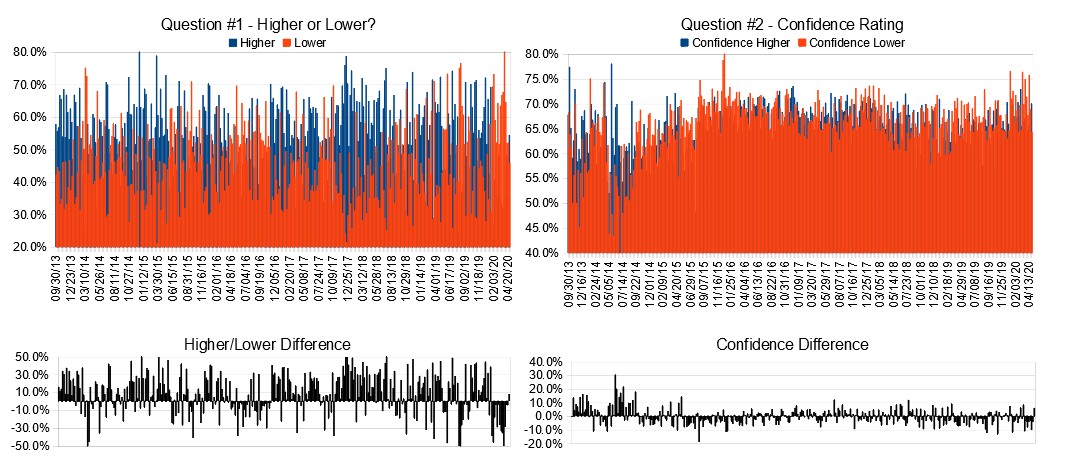
Details: Last week’s majority sentiment from the survey was 52.0% predicting Lower, and the Crowd Forecast Indicator prediction was 68% chance Higher; the S&P500 closed 0.31% Lower for the week. This week’s majority sentiment from the survey is 54.3% predicting Higher (the first week of majority Higher sentiment since mid-January) with a greater average confidence from those who are predicting Higher. Similar conditions have occurred 29 times in the previous 343 weeks, with the majority sentiment (Higher) being correct 59% of the time and with an average S&P500 move of 0.56% Higher for the week. Based on that history, the TimingResearch Crowd Forecast Indicator is forecasting a 59% Chance that the S&P500 is going to move Higher this coming week.
Raw Data Page (raw data files include full history spreadsheet and the above charts):
TimingResearch.com/data.
[AD] eBook: TSLA Options Trader (Complete Strategy Guide)
Full Weekly Results (full version of this chart available in the raw data spreadsheet for this week, “Date” field below lists the Monday of the week being predicted).
Overall Sentiment All-Time “Correct” Percentage: 53.4%
Overall Sentiment 52-Week “Correct” Percentage: 62.7%
Overall Sentiment 12-Week “Correct” Percentage: 63.6%
Only the previous 52 weeks of data are shown below, please download the raw data to see the full range of past data.
Weekly Reports Page: TimingResearch.com/reports
Raw Data Page: TimingResearch.com/rawdata
Current Survey Page: TimingResearch.com/currentsurvey
Any feedback: TimingResearch.com/contact
Email Alerts
Make sure you don’t miss all the future reports, show reminders, and bonus offers from TimingResearch, enter your best email here:
By signing up you agree to receive newsletter and marketing emails. You can unsubscribe at any time.
Privacy Policies
NOTE: The following open-ended answers are solely the opinions of the anonymous respondents to this survey. Responses are mostly unedited, but some have been reformatted slightly for to make them easier to read. Some irrelevant responses (e.g. “none”), or anything obviously fake, or copy and pasted responses have been omitted. All-caps responses have been changed to all lowercase. All responses for each week, unedited, are available in the raw data spreadsheets at TimingResearch.com/data.
Question #3. For your answer to Question #1, please share what specific reason(s) you think the S&P500 will be heading the direction you chose.
“Higher” Respondent Answers:
• Markets are opening positive feed from around the world.
• the bullish action from yesterday
• Price on day chart is above 50SMA
• Earnings and people going back to work again
• I cannot understand why it will go higher.
• Bullish market
• Market manipulation
• Things getting better, protests for getting back to work !
• mkt is very low.
• Technical reason.
• short term trend is up
“Lower” Respondent Answers:
• I think the 2nd leg DOWN of the swing that started Feb 19 2020 will start very soon
• …..debt, morgage, VC, coruption, OIL=XsaudisXrusiaXusa, gold+++++, deadly bags………
• Virus
• Both damage to economy and Health are uncertain to underestimated at this time.
• Disappointing earnings
• there is no fundamental reason for the s&p to go up
• slight bias to the downside
• Corona
• because of the economy is not great.
• moon cycle
• The S&P is down only 13% in 2020. This is despite high unemployment, low economic output, earnings guidance lower or being pulled, and worrying mortgage debt.
• Bad earnings number for the big tech stocks that are keeping up the bull market.
• because the economy is getting worse due to corona virus lock down and due to the economy dropping and we are heading into a world wide repression.
[AD] eBook: TSLA Options Trader (Complete Strategy Guide)
Question #4a. What has been most profitable for you to trade over the last couple months?
• Stocks/ETFs – 37%
• Options – 30%
• Other/None – 22%
• Forex/Cryptos – 4%
• Futures – 7%
Question #4b. Why do you think that was most profitable for you?
• Futures – because it is the only thing I trade :)
• Futures – Big volatility
• Options – Leverage
• Options – limited risk
• Options – Options are the only ones that I can afford to trade.
• Options – Selling puts works
• Options – Volatility
• Other/None – all lost money looking at adding futures to sell short I papertraded my way to 1,000,000 Saw the oil collapse
• Other/None – because the market is too volatile at the current time
• Stocks/ETFs – Blood in the streets
• Stocks/ETFs – Buy low sell high intraday.
• Stocks/ETFs – Confidence that markets will come back.
• Stocks/ETFs – Experience
• Stocks/ETFs – It’s the only category that I trade. I’ve been on the right side of the moves most of the time.
• Stocks/ETFs – Scalping pre market and early market hours
• Stocks/ETFs – stocks are all I trade
Question #5. Additional Comments/Questions/Suggestions?
• With 28 million+ outta work in USA, airlines, auto manufactures, Containers, cruise ships, hotels, all at bottom and still the market moves higher???
• whO are you?
[AD] eBook: TSLA Options Trader (Complete Strategy Guide)
Email Alerts
Make sure you don’t miss all the future reports, show reminders, and bonus offers from TimingResearch, enter your best email here:
By signing up you agree to receive newsletter and marketing emails. You can unsubscribe at any time.
Privacy Policies
Crowd Forecast News Report #343
[AD] eBook: TSLA Options Trader (Complete Strategy Guide)The new TimingResearch report for the week has been posted, you can download the full PDF report with the link below or you can read the full report in this post below.
Click here to download report in PDF format: TRReport041920.pdf
Question #1. Which direction do you think the S&P500 index will move from this coming Monday’s open to Friday’s close (April 20th to 24th)?
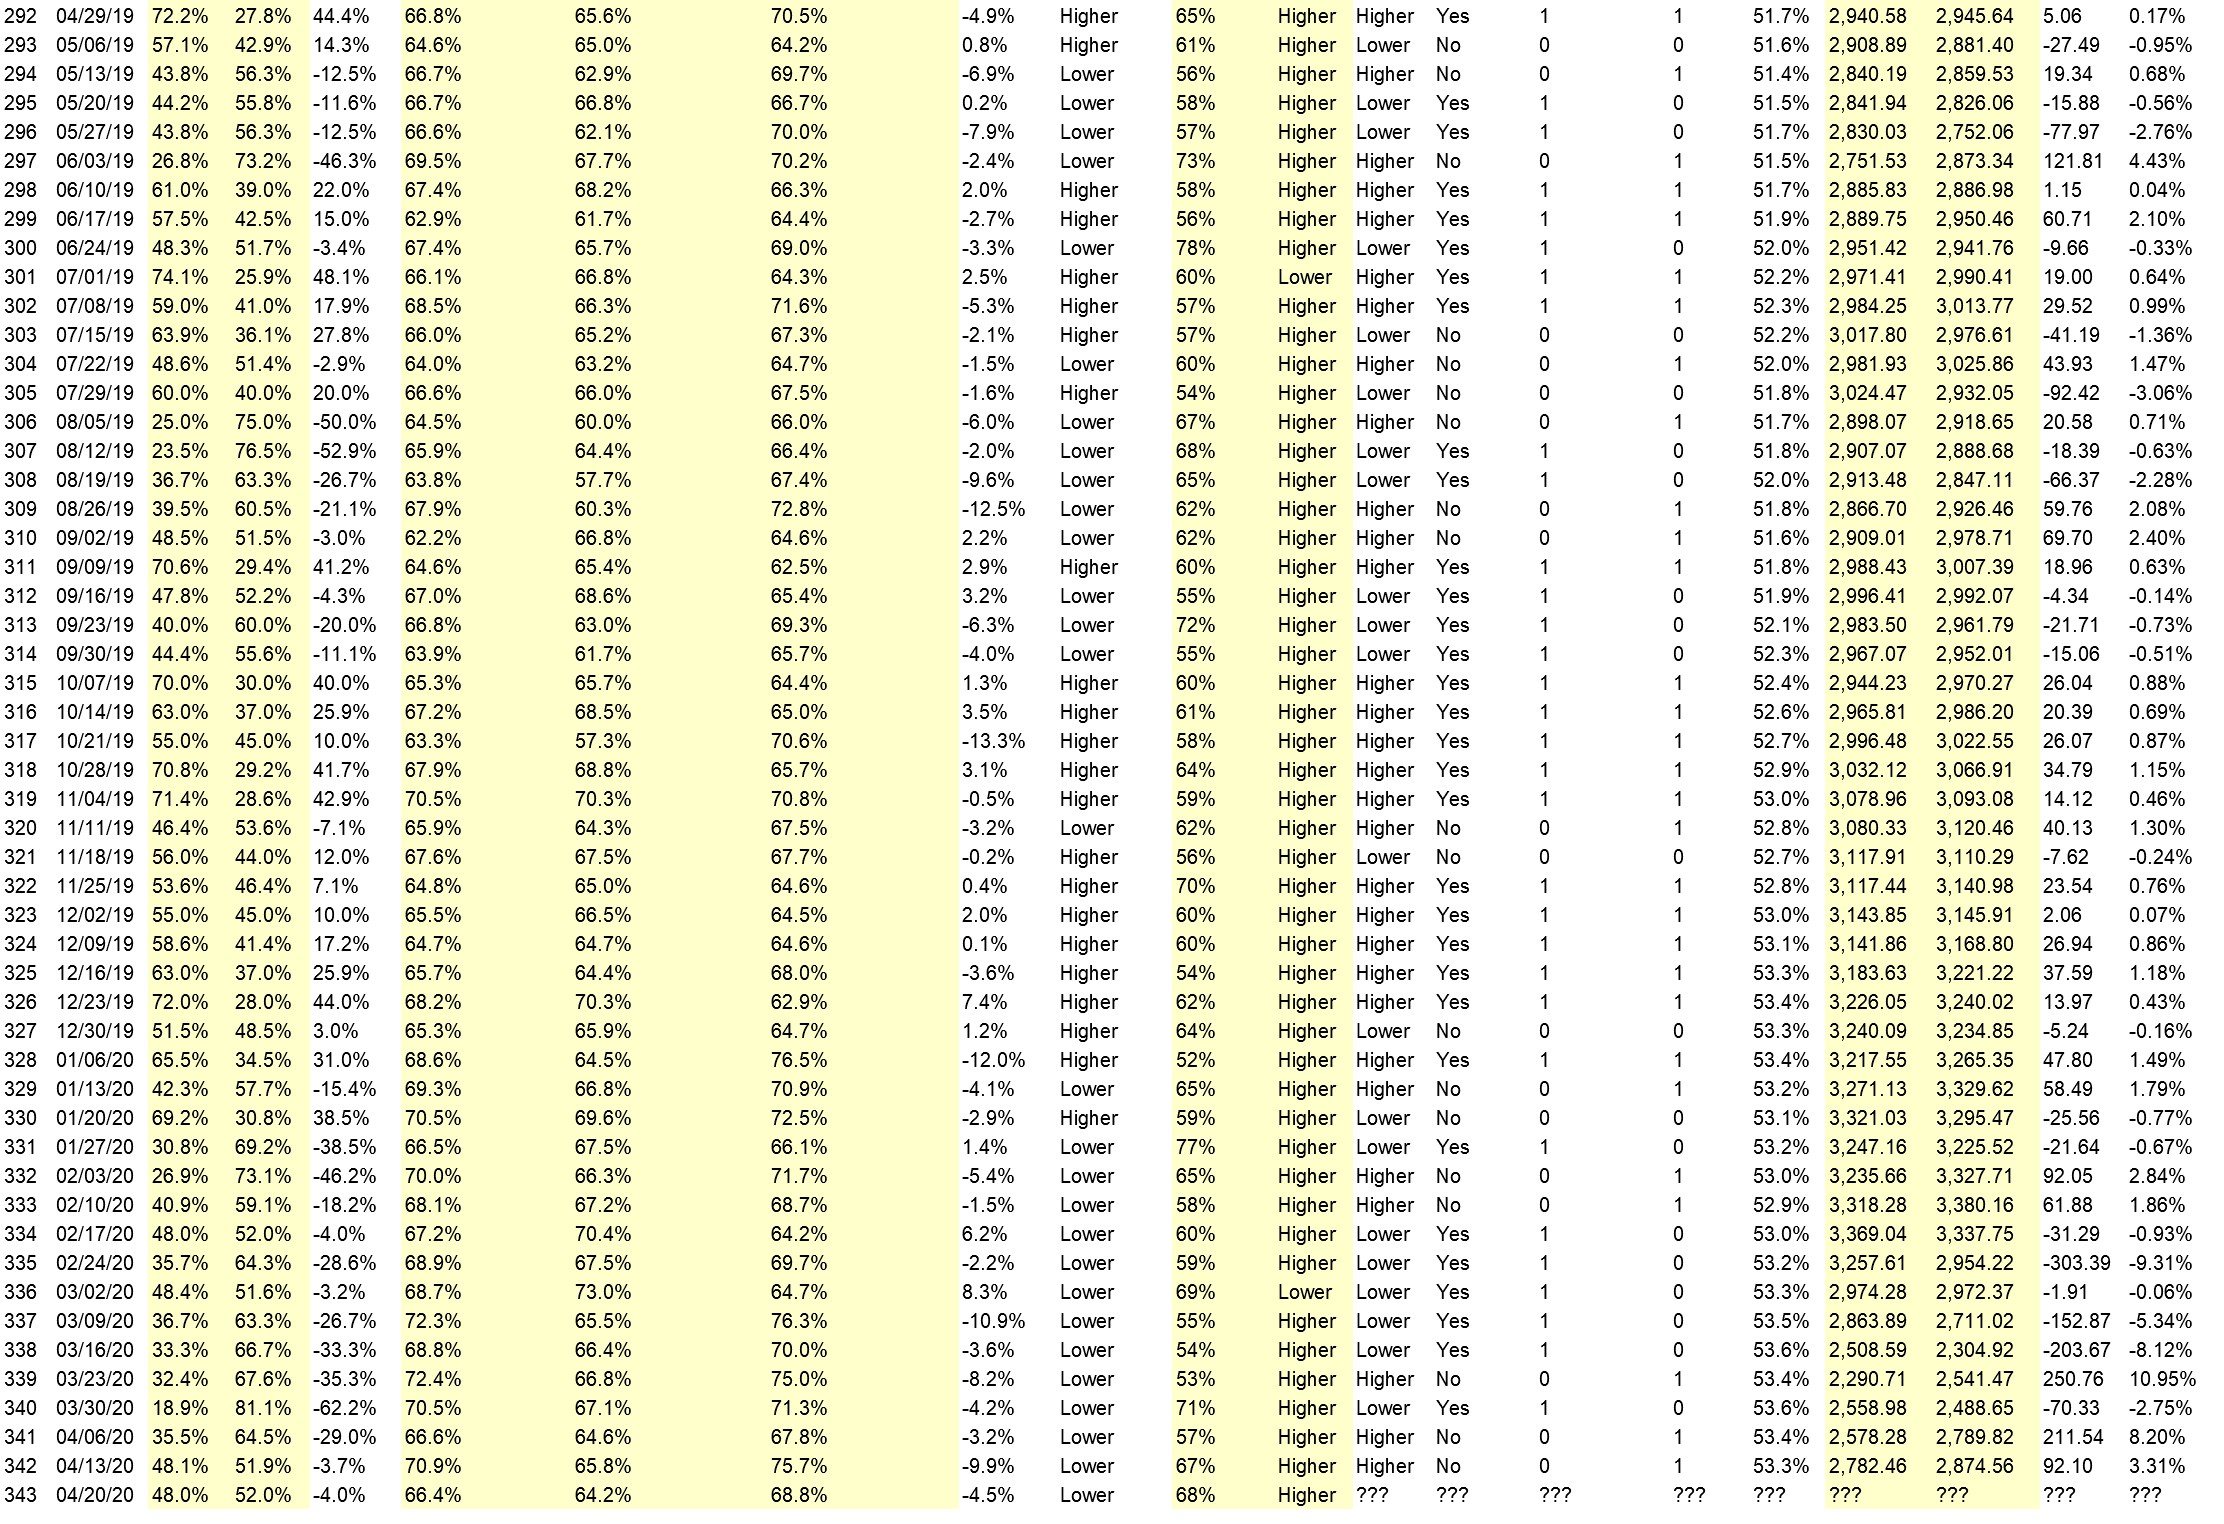
Higher: 48.0%
Lower: 52.0%
Higher/Lower Difference: -4.0%
Question #2. Rate your confidence in your answer to Question #2 by estimating the probability you have correctly predicted next week’s market move.
Average of All Responses: 66.4%
Average For “Higher” Responses: 64.2%
Average For “Lower” Responses: 68.8%
Higher/Lower Difference: -4.5%
Responses Submitted This Week: 28
52-Week Average Number of Responses: 31.7
TimingResearch Crowd Forecast Prediction: 68% Chance Higher
This prediction is an attempt by the editor of this newsletter to use the full 6+ year history of data collected from this project to forecast a probability estimate for whether this week’s sentiment is going to be correct and ultimately what the markets will do this coming week.
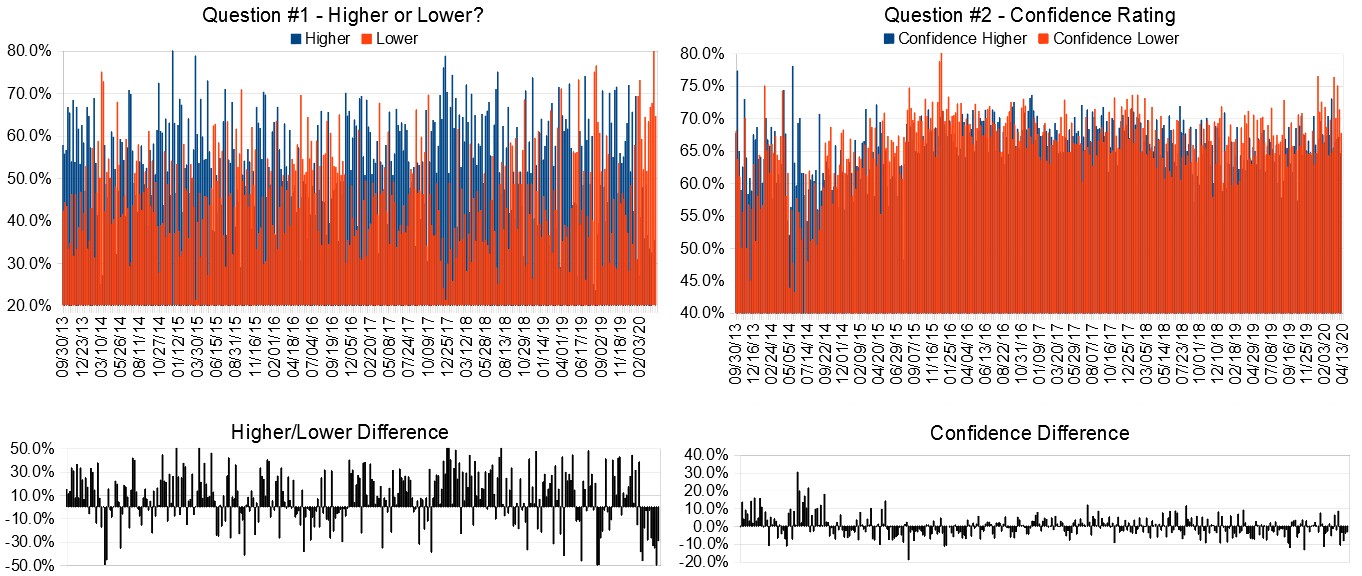
Details: Last week’s majority sentiment from the survey was 51.9% predicting Lower, and the Crowd Forecast Indicator prediction was 67% chance Higher; the S&P500 closed 3.31% Higher for the week. This week’s majority sentiment from the survey is 52.0% predicting Lower with a greater average confidence from those who are predicting Lower. Similar conditions have occurred 22 times in the previous 342 weeks, with the majority sentiment (Lower) being correct 32% of the time and with an average S&P500 move of 0.46% Higher for the week. Based on that history, the TimingResearch Crowd Forecast Indicator is forecasting a 68% Chance that the S&P500 is going to move Higher this coming week.
Raw Data Page (raw data files include full history spreadsheet and the above charts):
TimingResearch.com/data.
[AD] eBook: TSLA Options Trader (Complete Strategy Guide)
Full Weekly Results (full version of this chart available in the raw data spreadsheet for this week, “Date” field below lists the Monday of the week being predicted).
Overall Sentiment All-Time “Correct” Percentage: 53.3%
Overall Sentiment 52-Week “Correct” Percentage: 62.7%
Overall Sentiment 12-Week “Correct” Percentage: 54.5%
Only the previous 52 weeks of data are shown below, please download the raw data to see the full range of past data.
Weekly Reports Page: TimingResearch.com/reports
Raw Data Page: TimingResearch.com/rawdata
Current Survey Page: TimingResearch.com/currentsurvey
Any feedback: TimingResearch.com/contact
Email Alerts
Make sure you don’t miss all the future reports, show reminders, and bonus offers from TimingResearch, enter your best email here:
By signing up you agree to receive newsletter and marketing emails. You can unsubscribe at any time.
Privacy Policies
NOTE: The following open-ended answers are solely the opinions of the anonymous respondents to this survey. Responses are mostly unedited, but some have been reformatted slightly for to make them easier to read. Some irrelevant responses (e.g. “none”), or anything obviously fake, or copy and pasted responses have been omitted. All-caps responses have been changed to all lowercase. All responses for each week, unedited, are available in the raw data spreadsheets at TimingResearch.com/data.
Question #3. For your answer to Question #1, please share what specific reason(s) you think the S&P500 will be heading the direction you chose.
“Higher” Respondent Answers:
• Bull Open Range
• FED buying the market indirectly.
• Markets will open partially
• Market will inch higher anticipating some positive news coming from stabilization of virus pandemic
• Why not go higher. I think people are tired of the china HK flue… The Greatest President since JFK, President of The United States Donald Trump will ensure Governor’s get workers back to work NOW!
• On track to recovery, especially since there are protests against lockdowns,
• We broke above 50% retracement. If that holds on the 3 major indexes, we are going higher.
• Mkt is very low now
“Lower” Respondent Answers:
• rise of this week will profit take by end of week as people realize opening U S is too early
• selloff early then rebound may close slightly higher but so what Market to seesaw until further notice
• I’ve got to be right at sometime :)
• got to be right sometime.
• market temporarily overbought
• the markets took a big dive down then went up for no apparent reason
• Too far, too fast
• It looks like the next S&P Fibonacci level is about 2930 (1.9% up from now), likely the next major resistance. That could occur soon. Consider the negativity of these: 2nd quarter GDP could drop 38% (Morgan Stanley), unemployment could rise to 32% (St L Fed), and retail sales down 8.7% in March.
• Many overbought indicators need a breather. Oil is not going to get better anytime soon and they might have to stop pumping or risk not having anywhere to put barrels. Still lots of slow down economy out there for a while.
[AD] eBook: TSLA Options Trader (Complete Strategy Guide)
Question #4. What trading-related questions or topics would you like the experts to discuss on future episodes of the weekly Crowd Forecast News show and/or which experts would you like to see on the show who haven’t been guests yet? (The show is off this coming week for Wealth365, but back on April 27th.)
• up to date news- hedges using Puts ans Calls
• buying in tranches?
• Financial institutes Master card visa
• How can the governments in the world pay for the stimulus plans
• N/A
Question #5. Additional Comments/Questions/Suggestions?
• What oil stocks or pharmacy stocks will be good.
• Are we heading for chaos in world economy
• Let’s get workers back to work this week!!!
The TimingResearch shows are off this week so you can attend Wealth365 instead!
Wealth365 is the largest free online trading and investment conference in the world. Join us and discover the best tips & strategies, directly from celebrity personalities, financial advisers, champion traders, and business thought leaders. You’ll increase your knowledge, grow your skills, and be prepared to take the next step in your financial future.
[AD] eBook: TSLA Options Trader (Complete Strategy Guide)
Email Alerts
Make sure you don’t miss all the future reports, show reminders, and bonus offers from TimingResearch, enter your best email here:
By signing up you agree to receive newsletter and marketing emails. You can unsubscribe at any time.
Privacy Policies

