
- Home
- Crowd Forecast News Reports
Crowd Forecast News Report #273
The new TimingResearch report for the week has been posted, you can download the full PDF report with the link below or you can read the full report in this post below.
Click here to download report in PDF format: TRReport121618.pdf
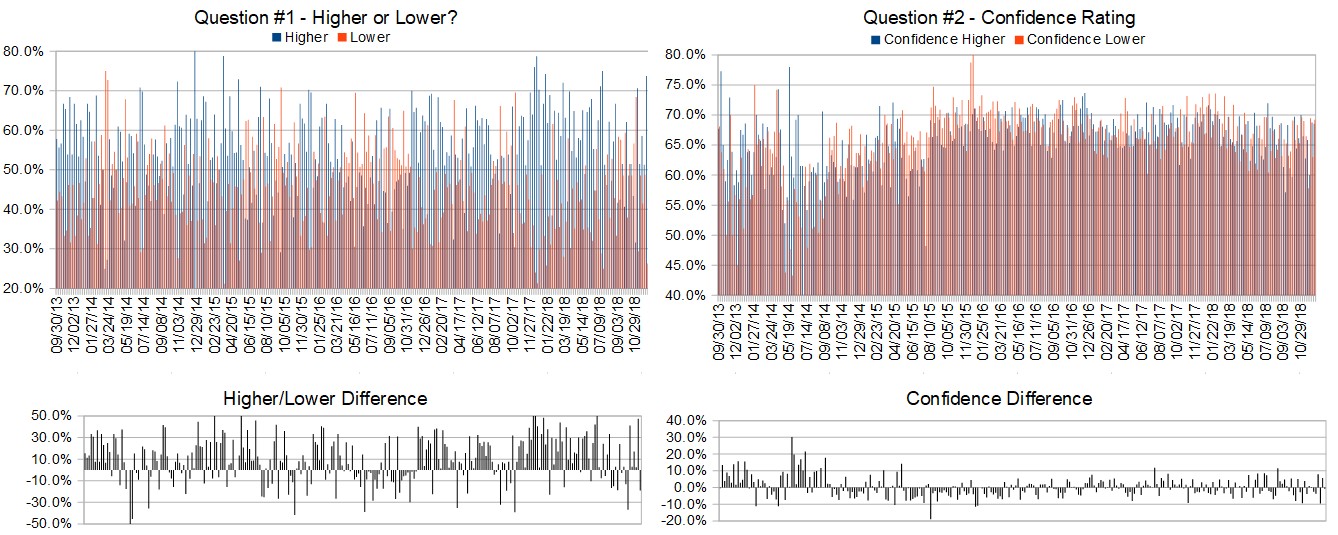
Question #1. Which direction do you think the S&P500 index will move from this coming Monday’s open to Friday’s close (December 17th to 21st)?
The order of possible responses to this question on the survey were randomized for each viewer.)
Higher: 53.1%
Lower: 46.9%
Higher/Lower Difference: 6.3%
Question #2. Rate your confidence in your answer to Question #2 by estimating the probability you have correctly predicted next week’s market move.
Average of All Responses: 68.4%
Average For “Higher” Responses: 67.1%
Average For “Lower” Responses: 70.0%
Higher/Lower Difference: -2.9%
Responses Submitted This Week: 34
52-Week Average Number of Responses: 44.4
TimingResearch Crowd Forecast Prediction: 55% Chance Higher
This prediction is an attempt by the editor of this newsletter to use the full 5 year history of data collected from this project to forecast a probability estimate for whether this week’s sentiment is going to be correct and ultimately what the markets will do this coming week.
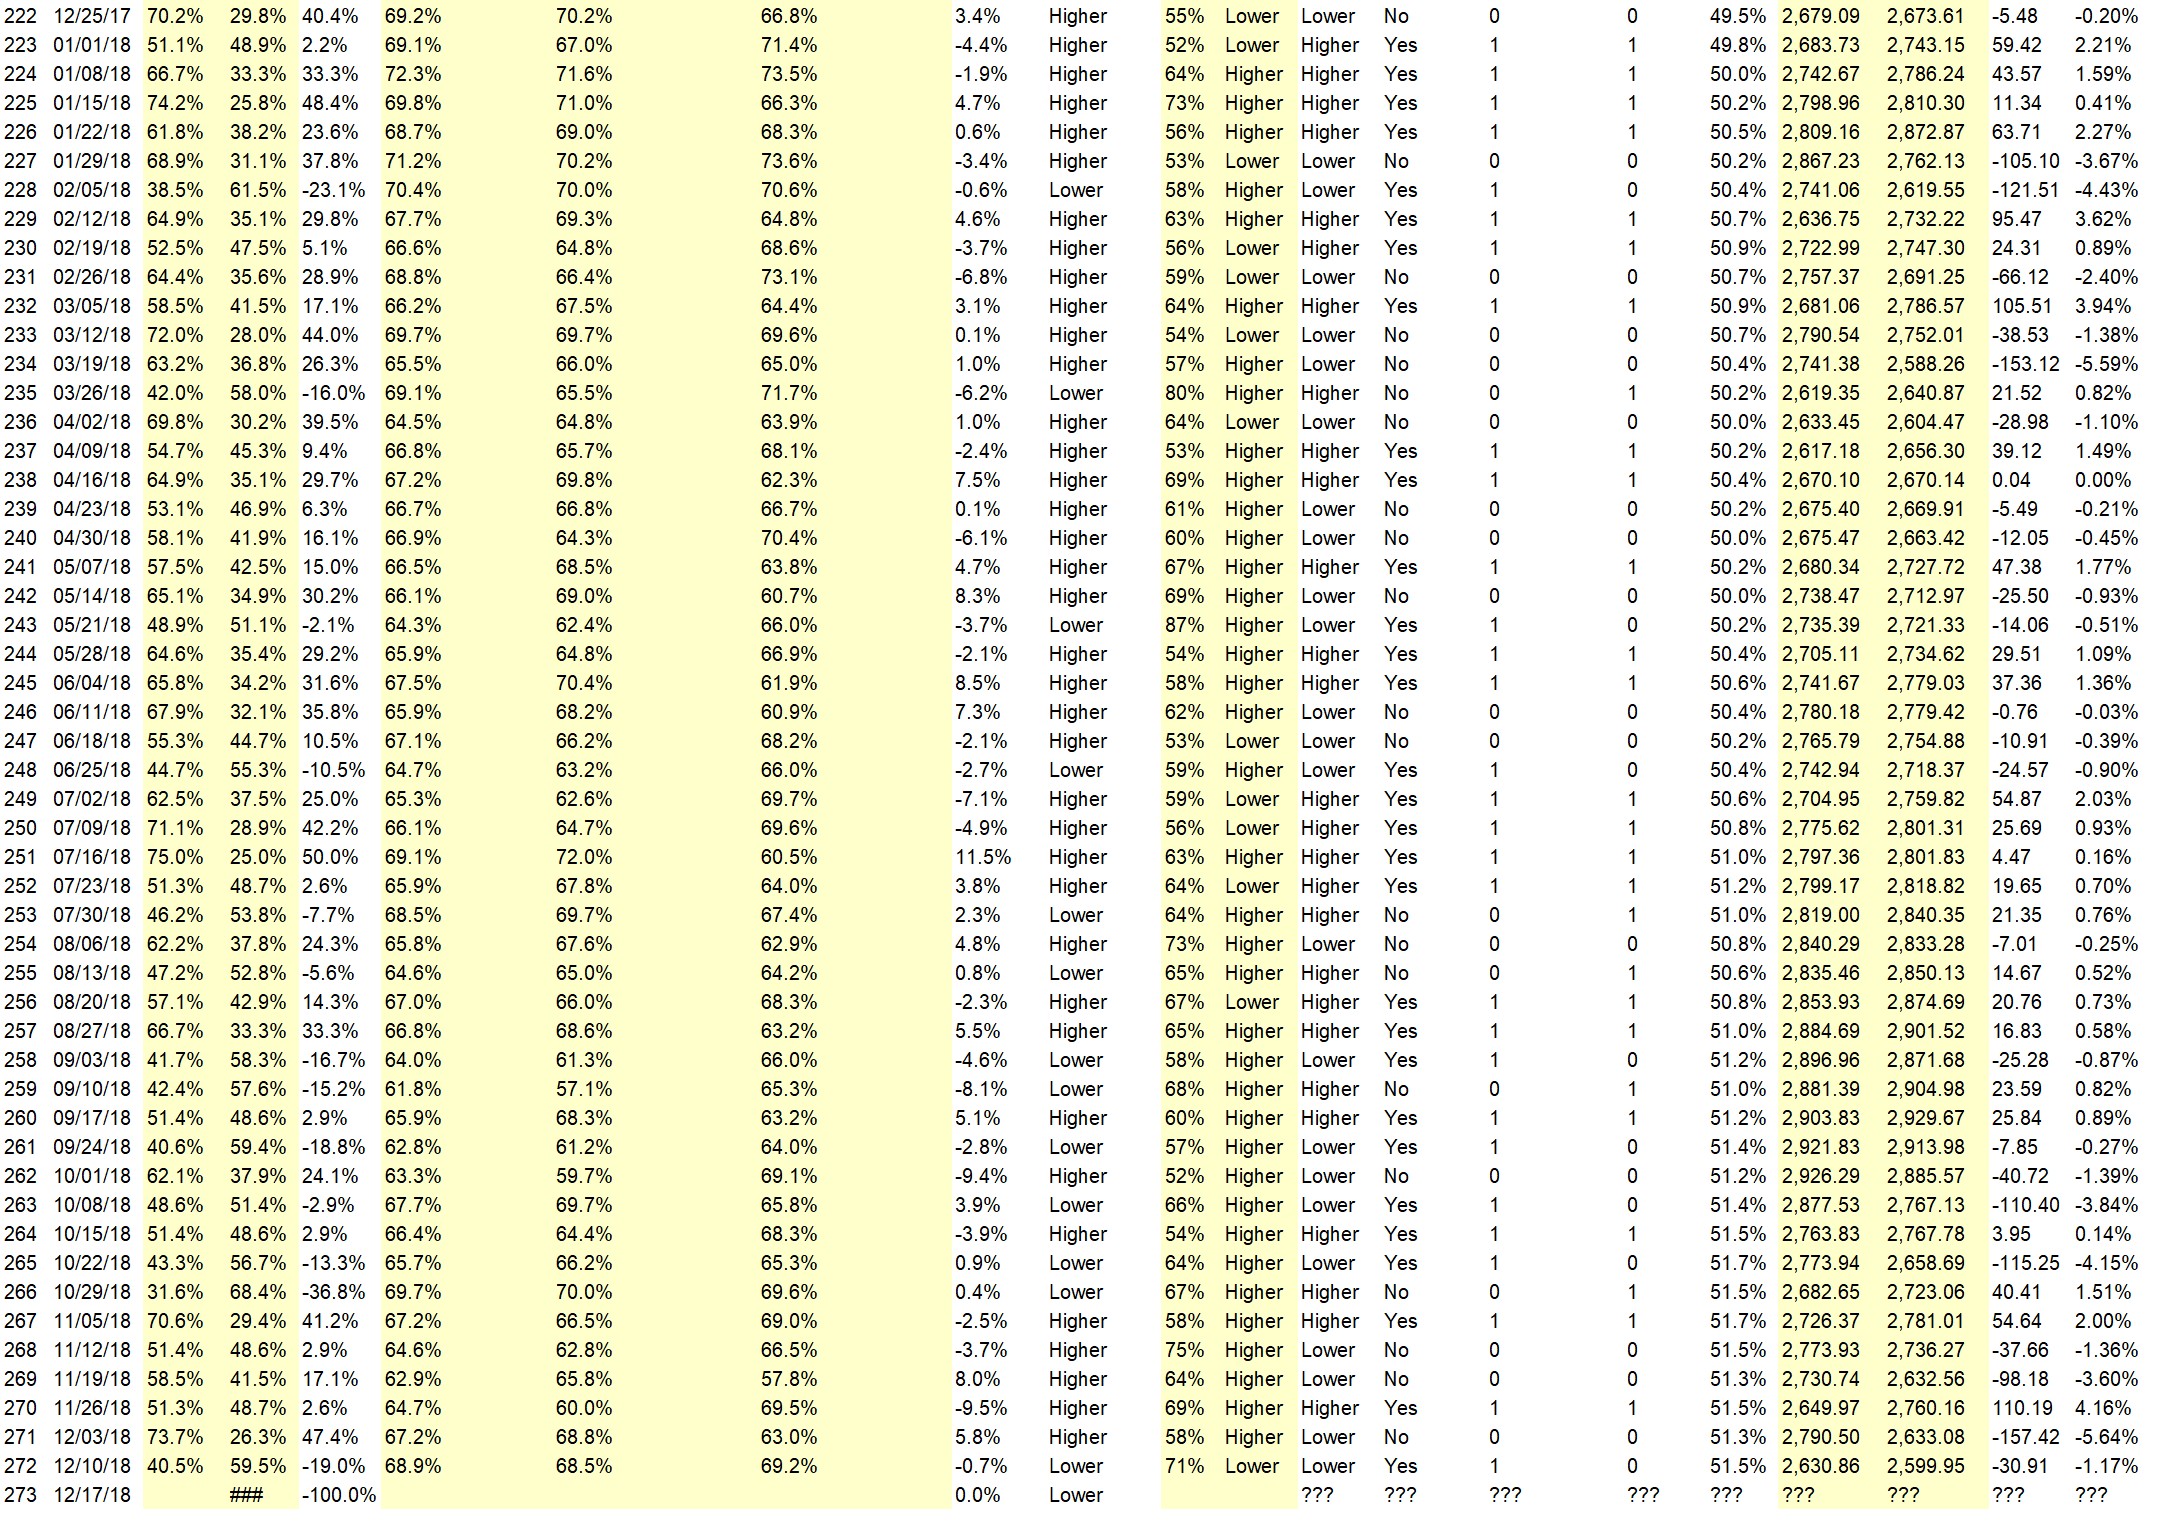
Details: Last week’s majority sentiment from the survey was 59.5% Lower, and the Crowd Forecast Indicator prediction was 71% Chance Lower; the S&P500 closed 1.17% Lower for the week. This week’s majority sentiment from the survey is 53.1% Higher with a greater average confidence from those who responded Lower. Similar conditions have occurred 29 times in the previous 272 weeks, with the majority sentiment being correct 55% of the time and with an average S&P500 move of 0.16% Higher for the week. Based on that history, the TimingResearch Crowd Forecast Indicator is forecasting a 55% Chance that the S&P500 is going to move Higher this coming week.

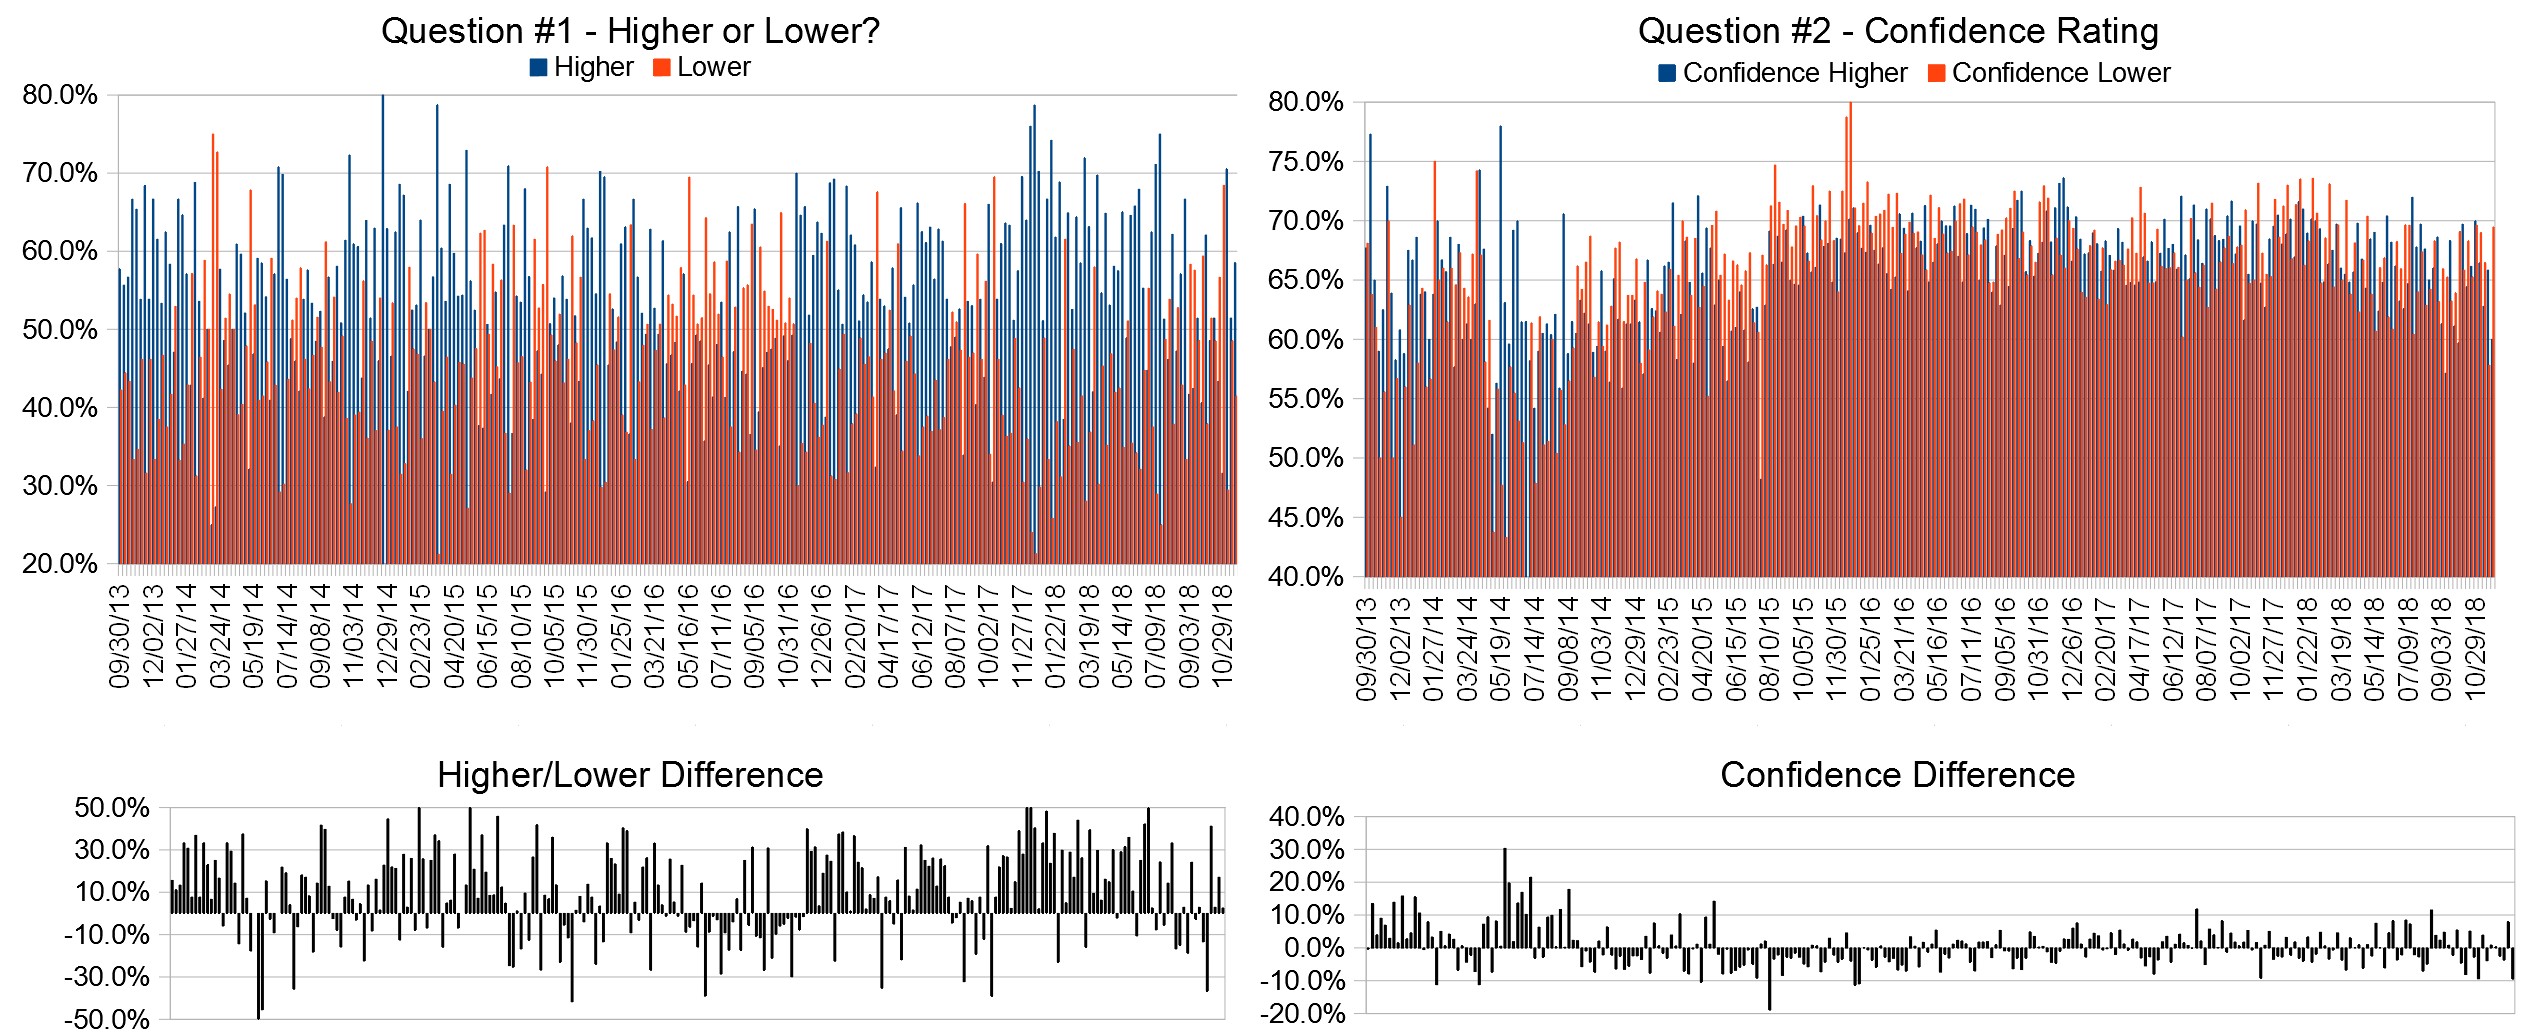
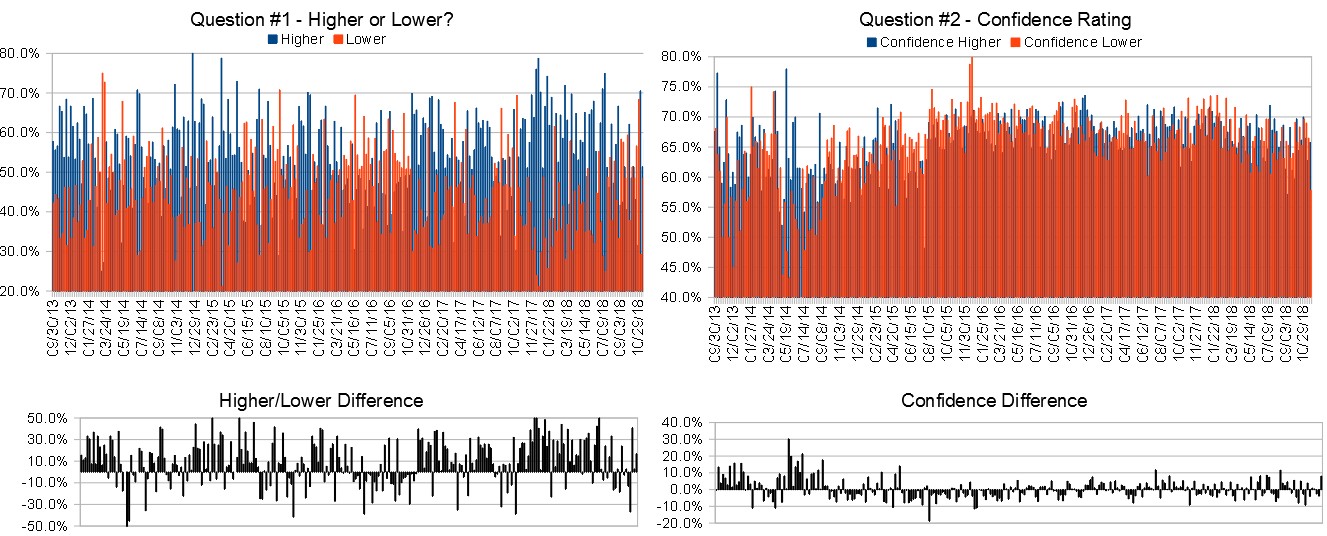
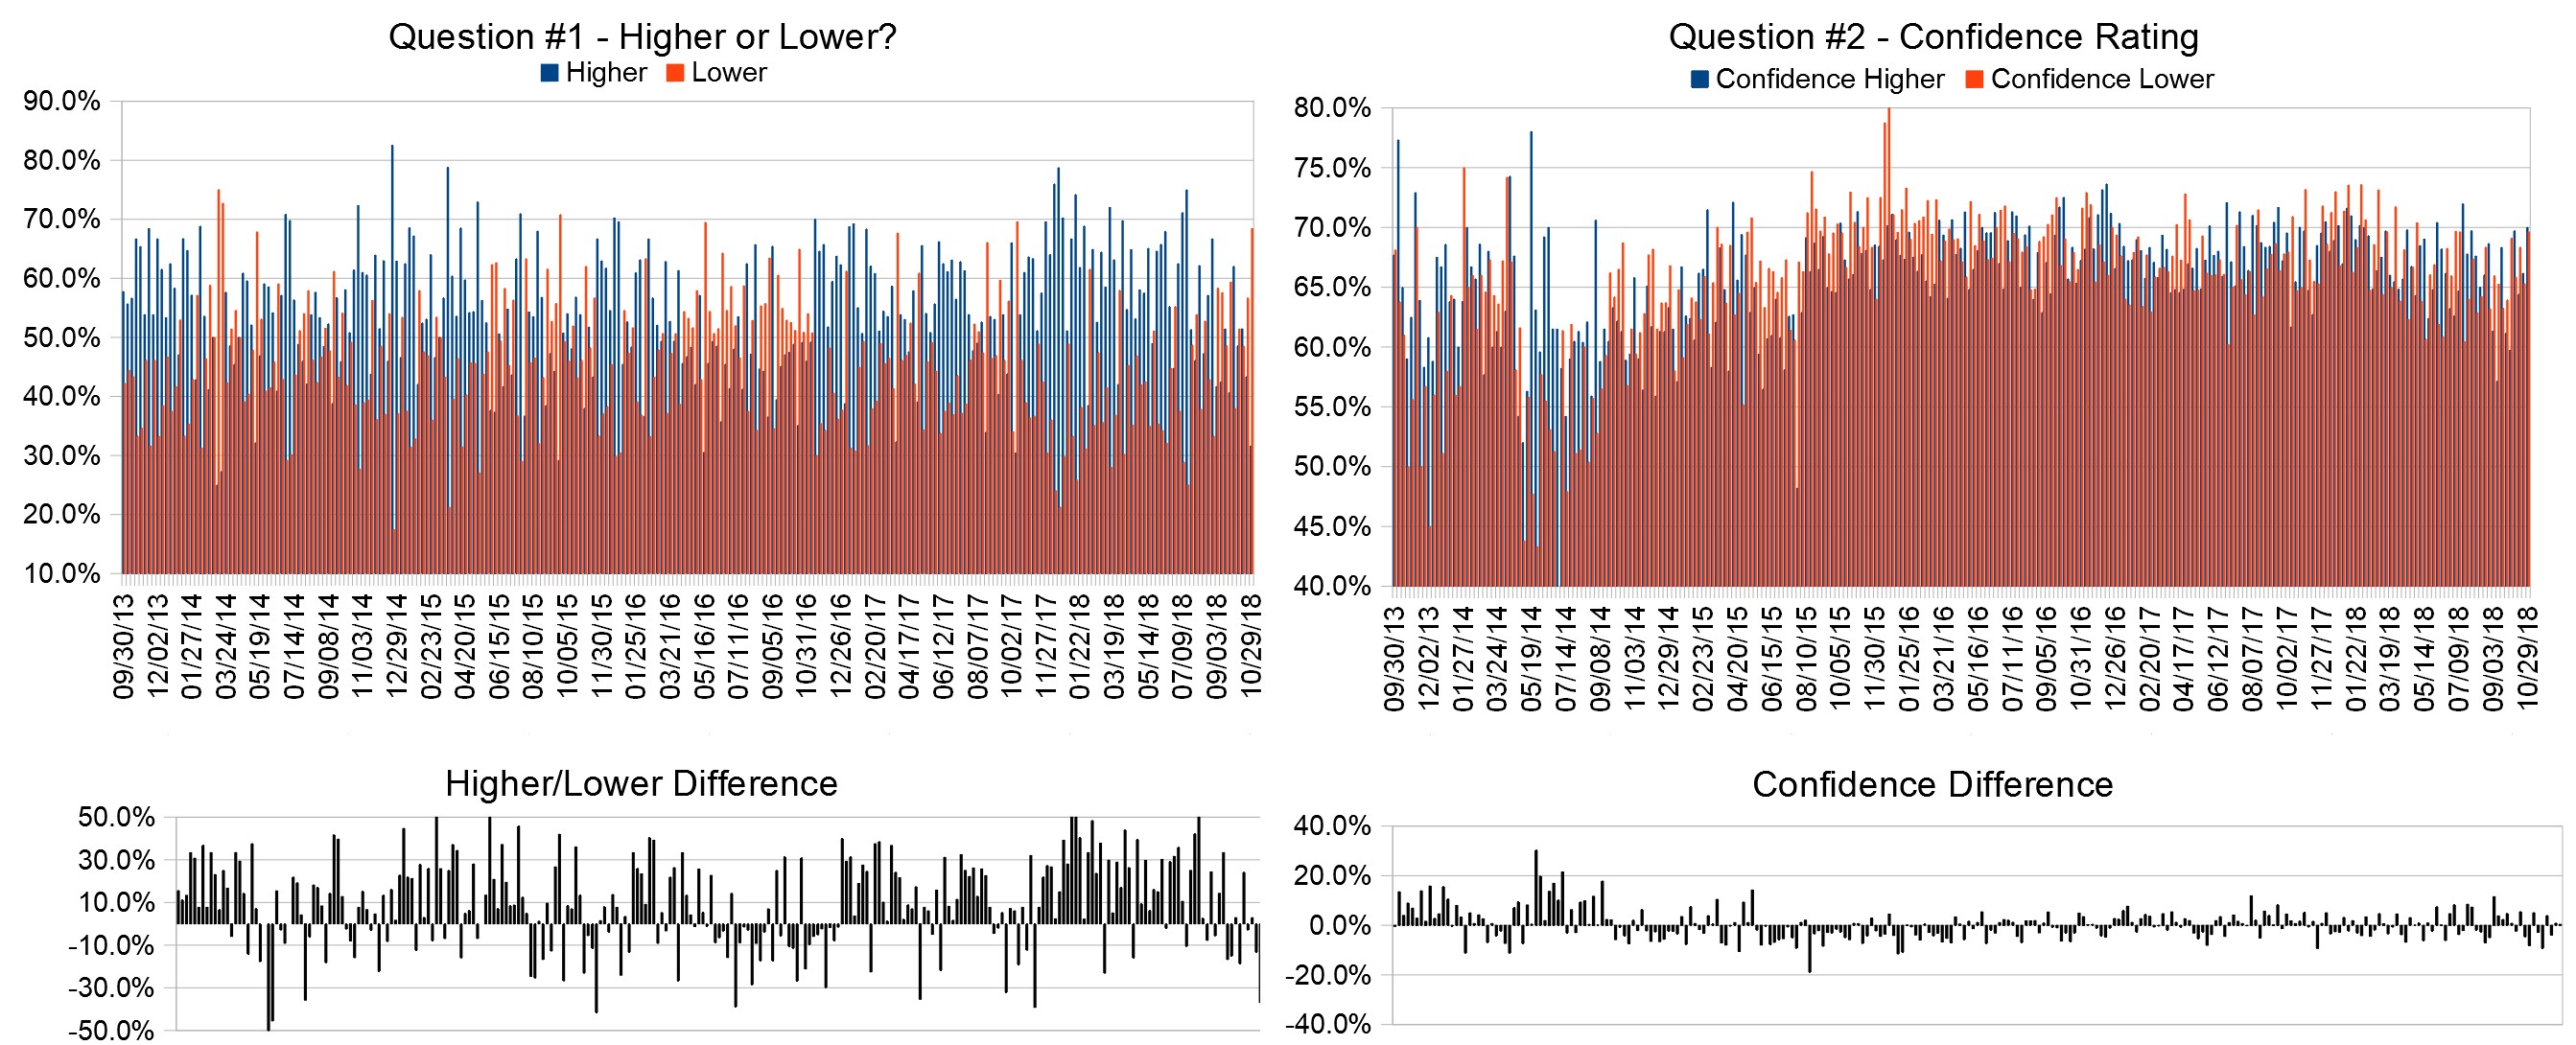
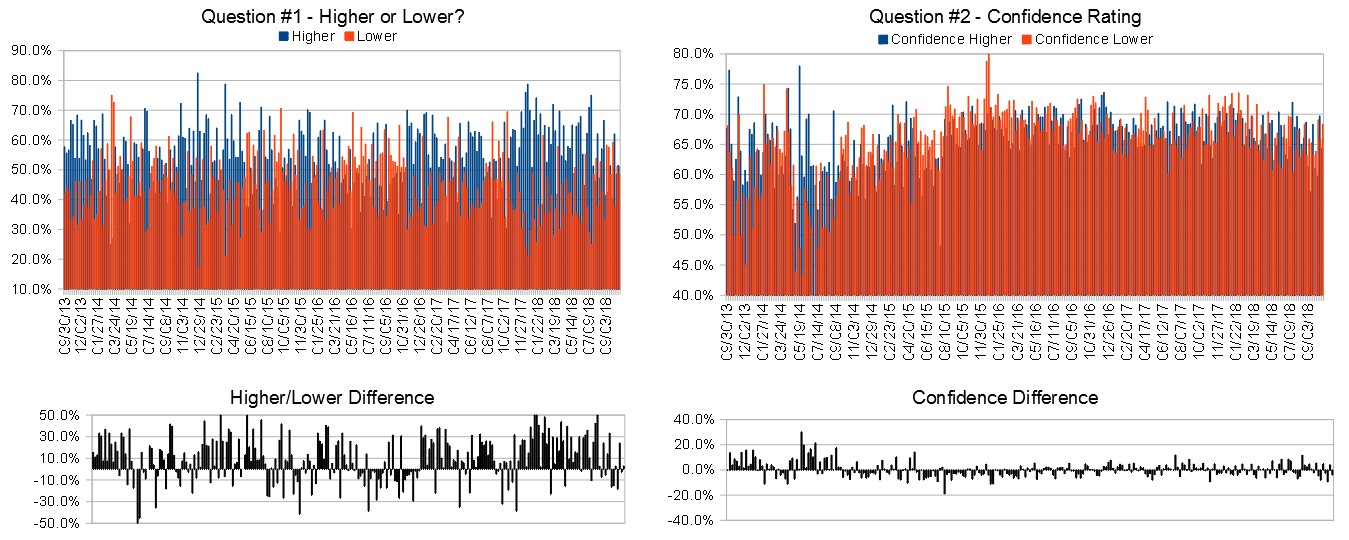
Raw Data Page (raw data files include full history spreadsheet and the above charts):
TimingResearch.com/data.
Partner Offer:
The Beauty of Options: In this free training, world renowned options trader, Jeff Bishop, will walk you through this ONE KEY SETUP that he uses daily to take advantage of crashing stocks. A small move in stock price can yield astronomical returns with options. Learn how here!

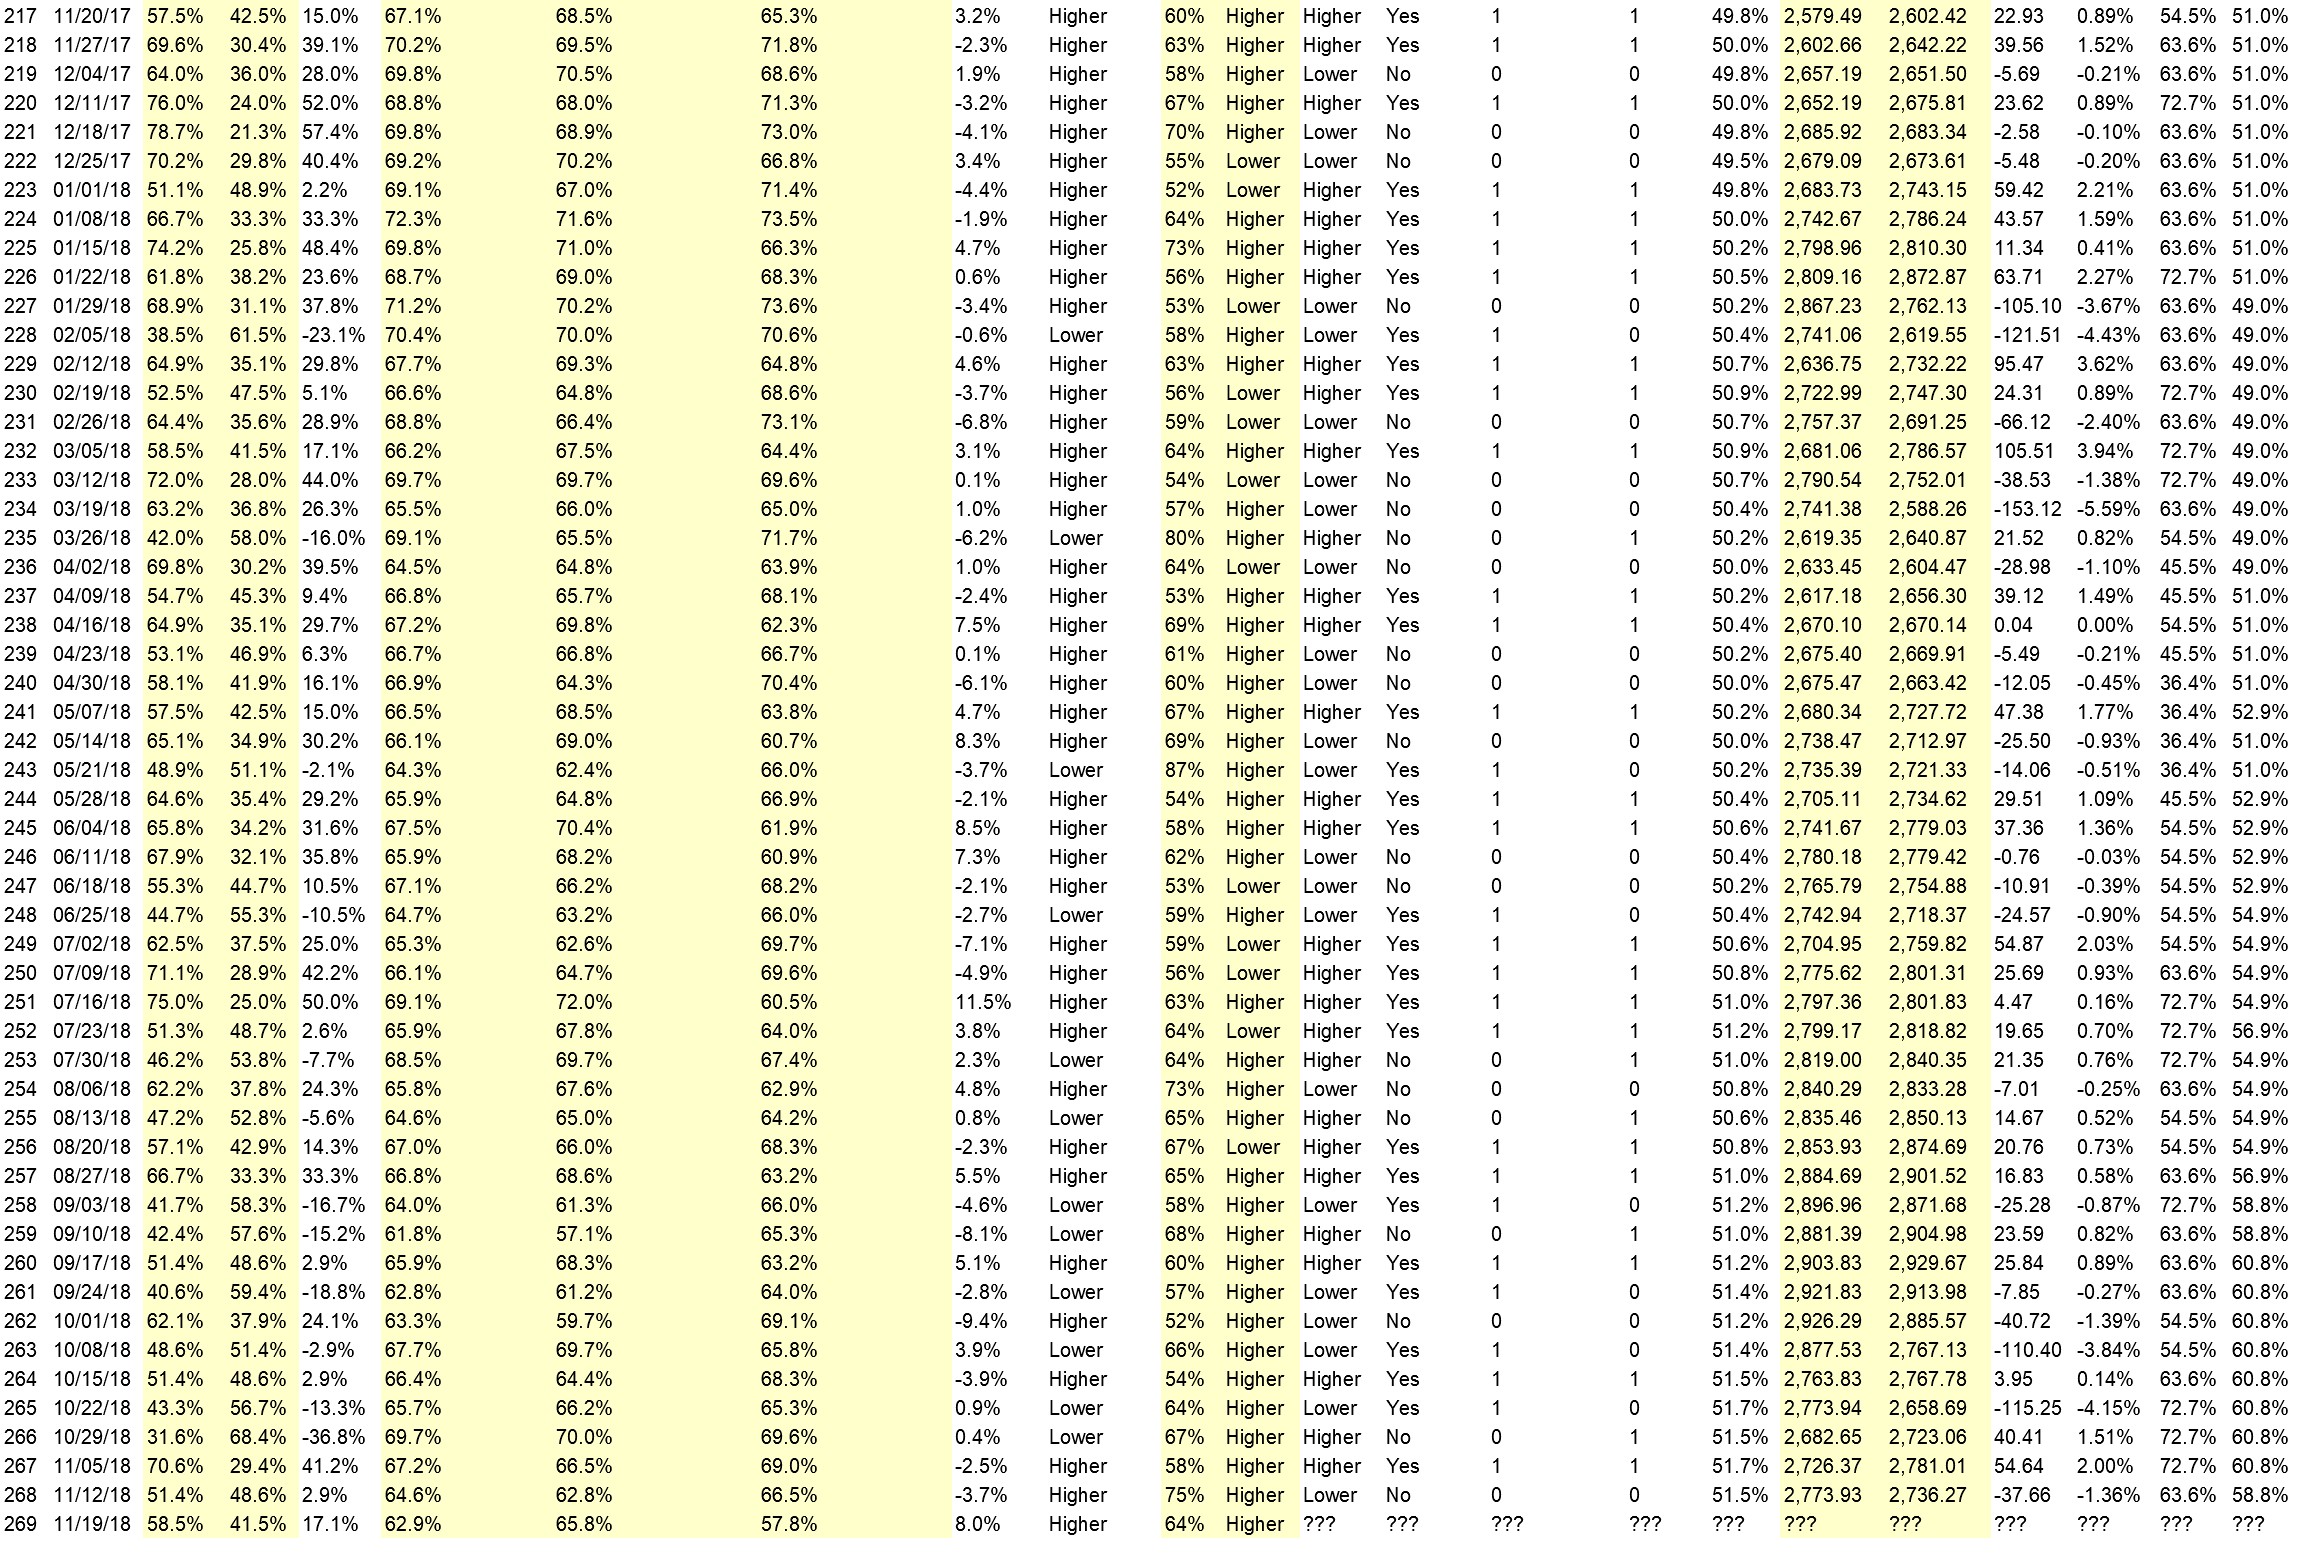
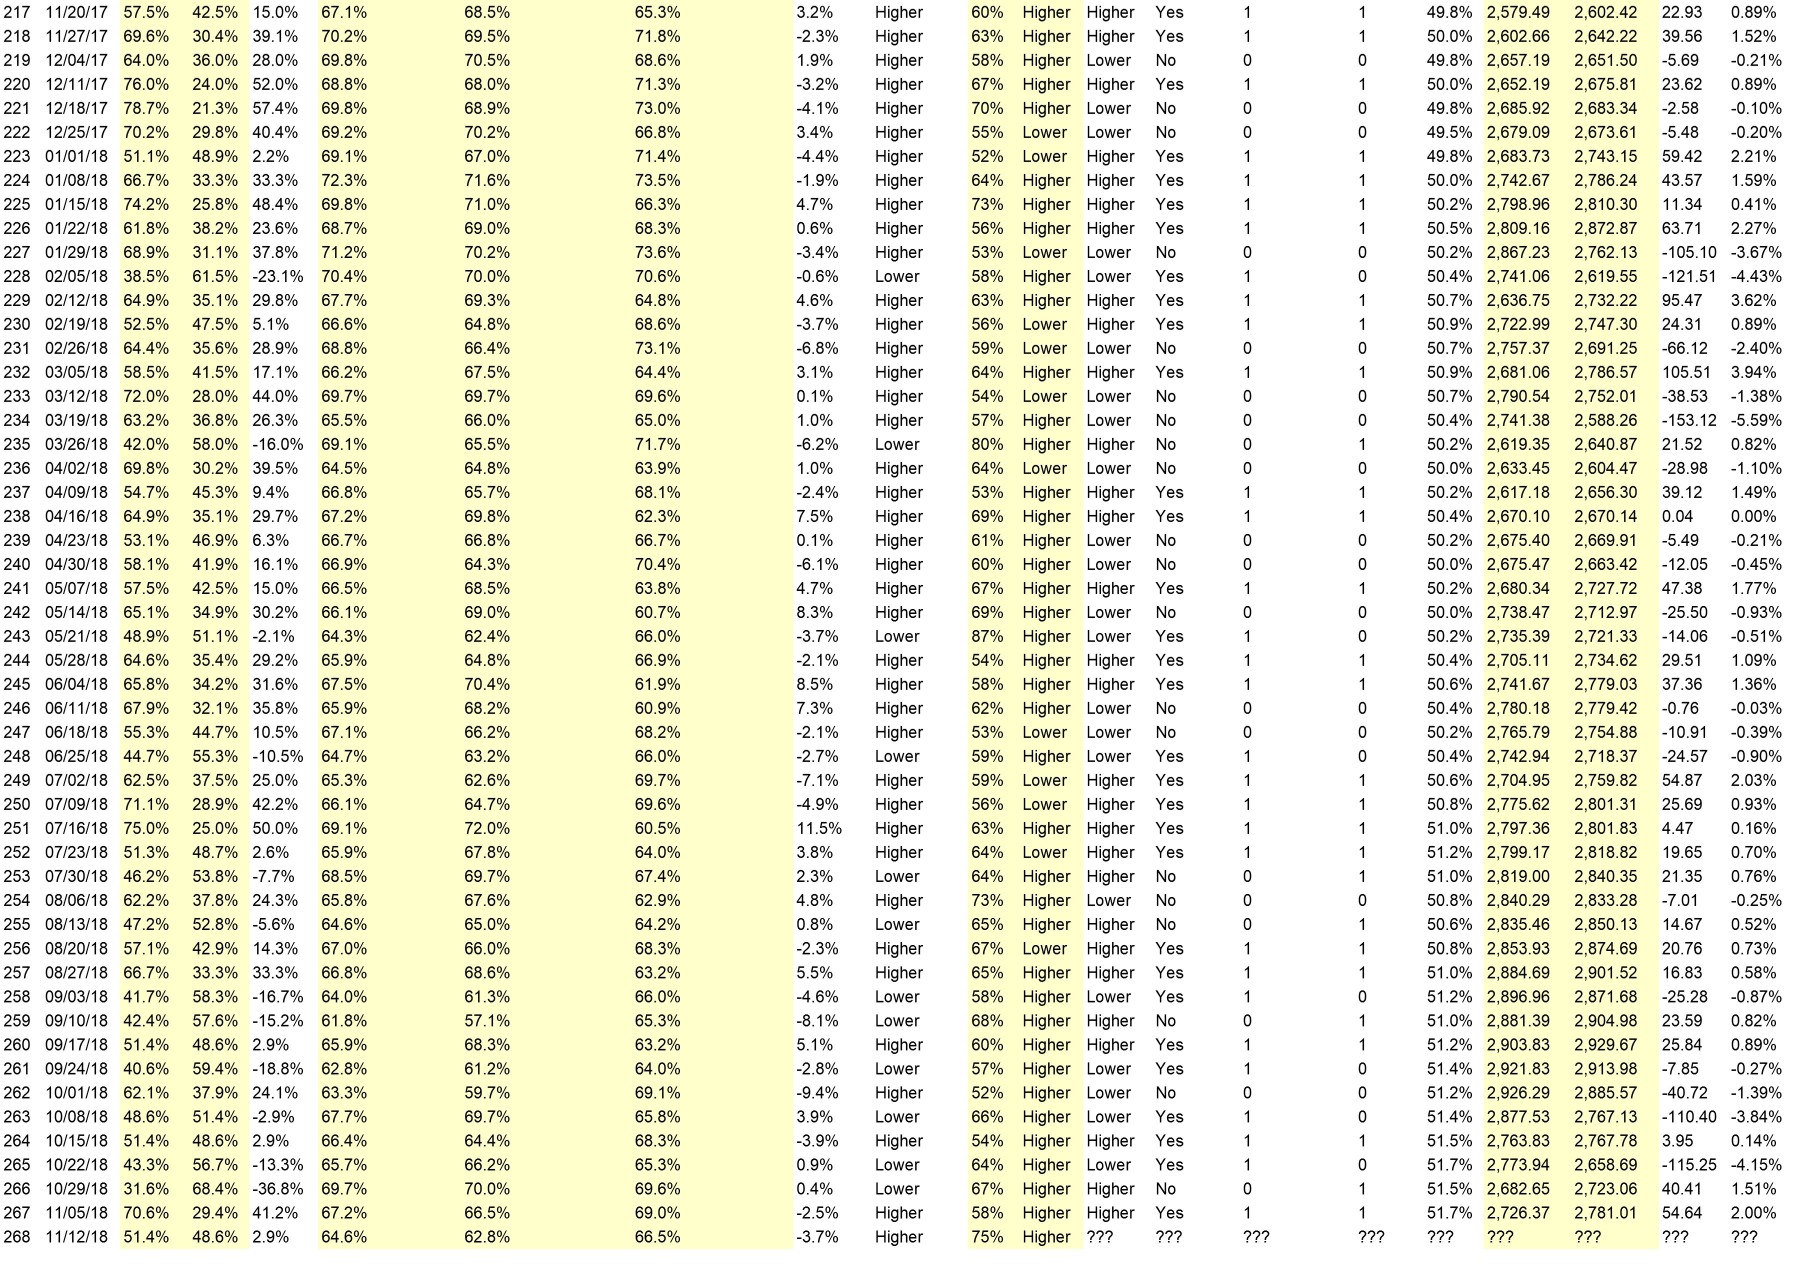
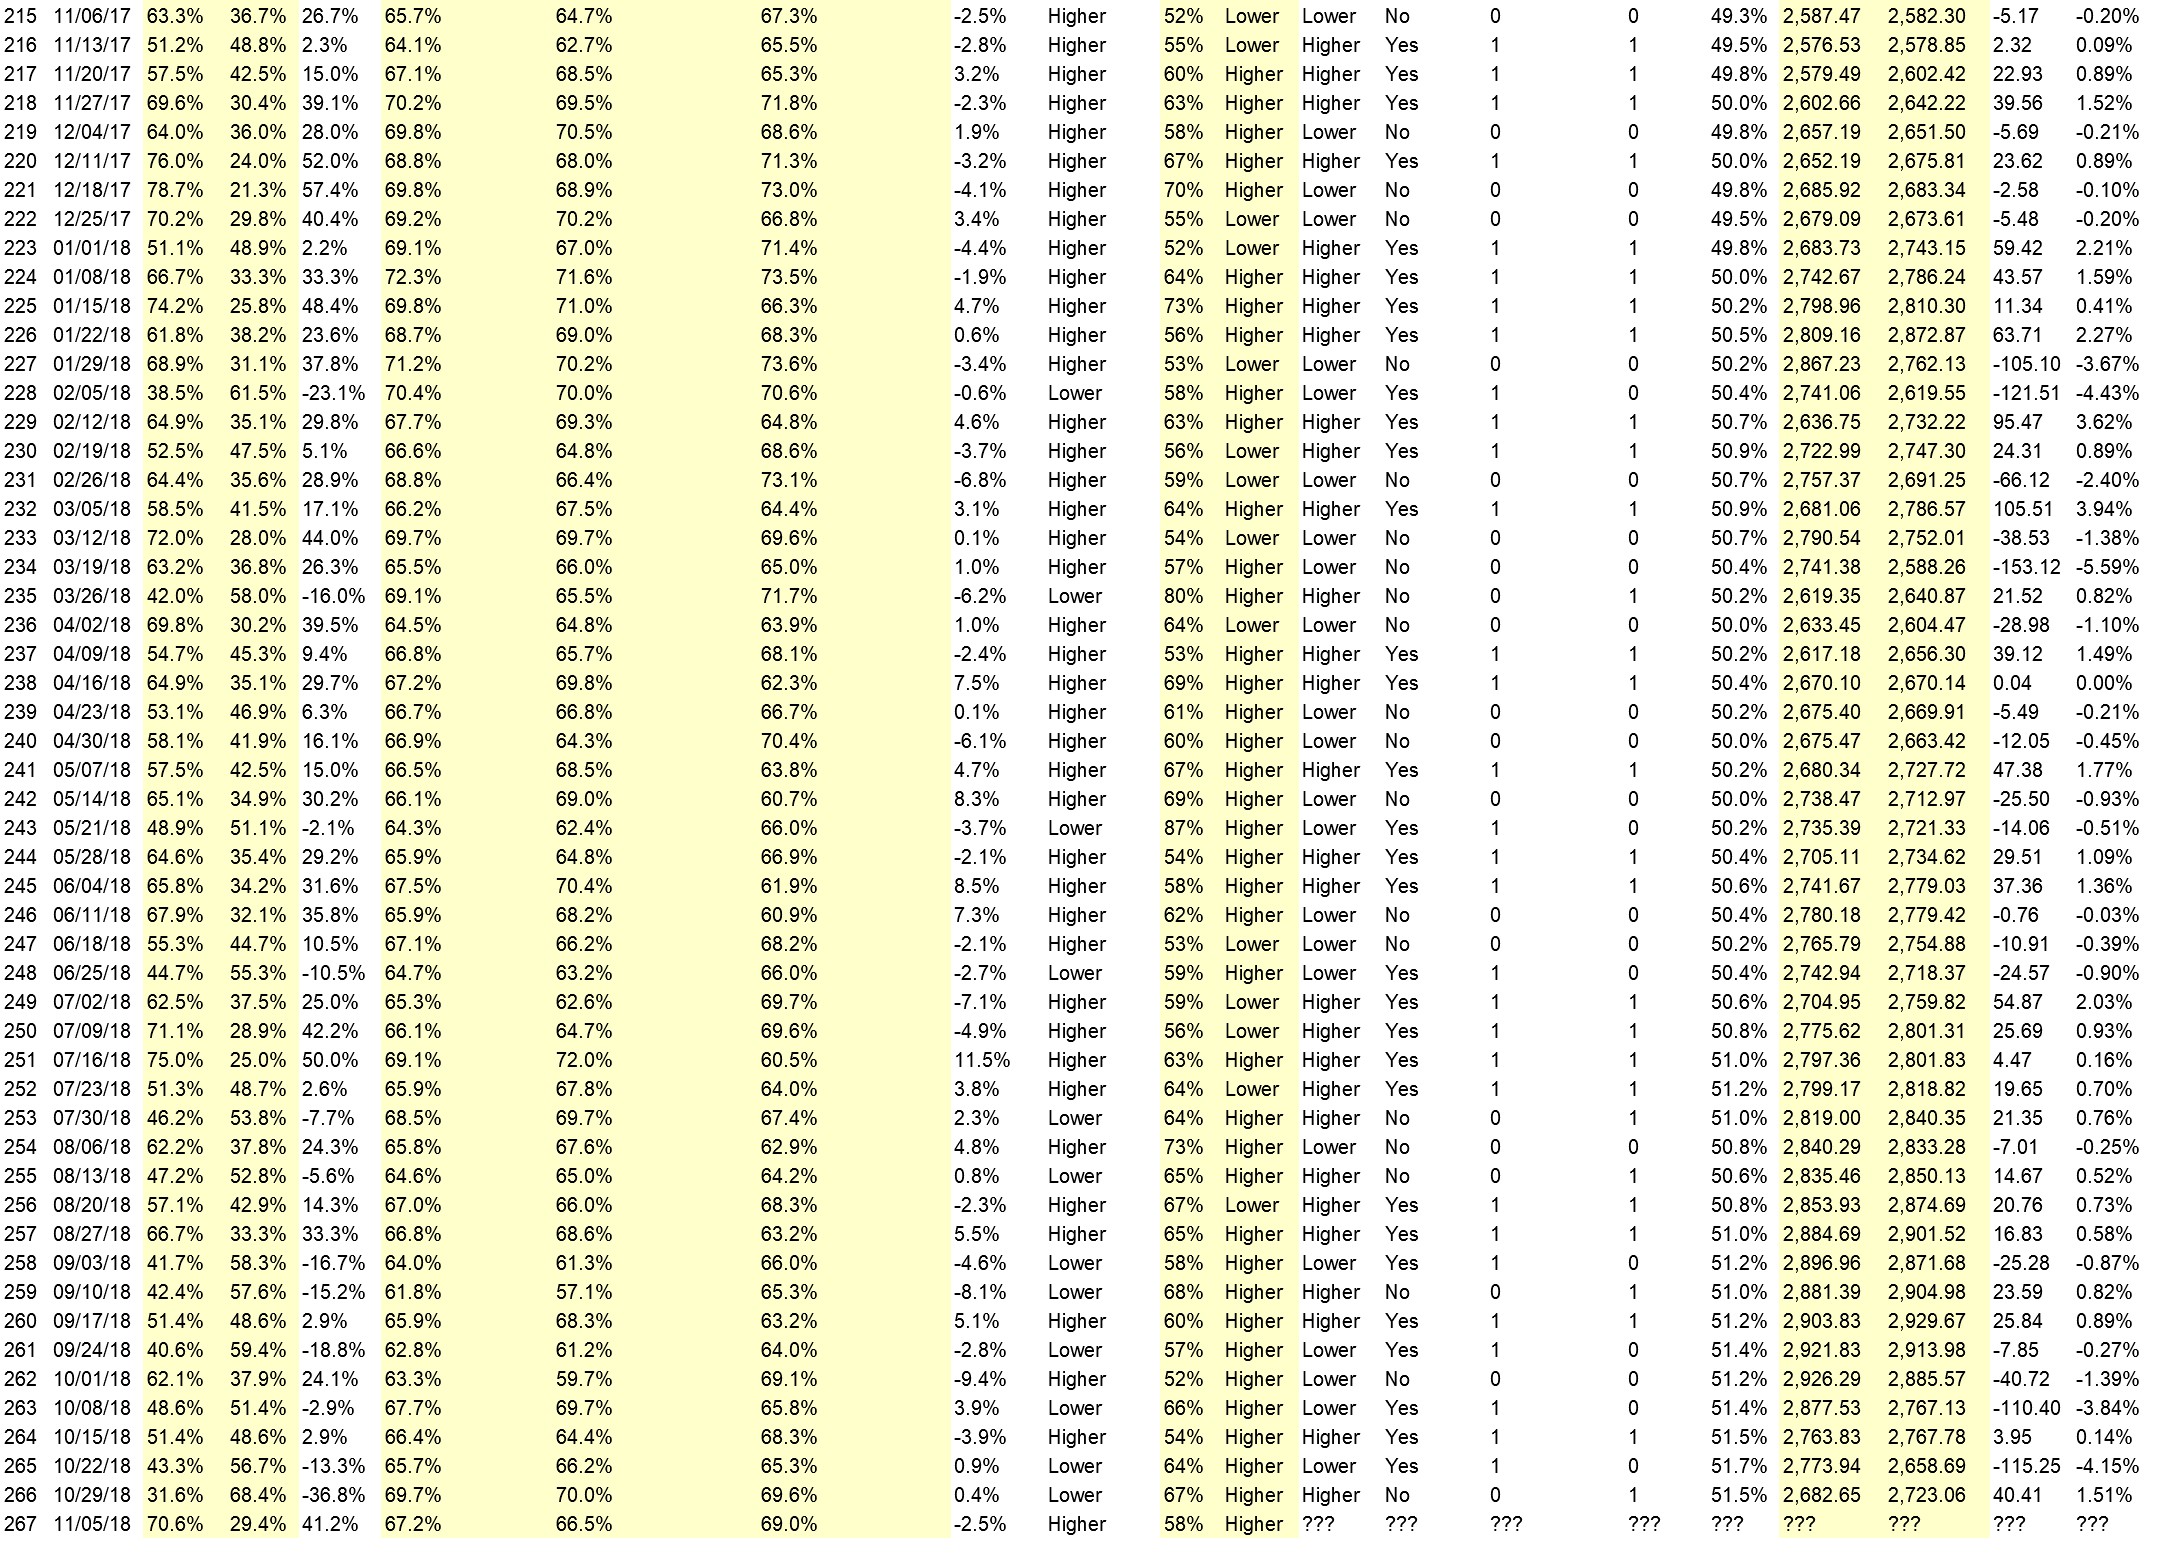
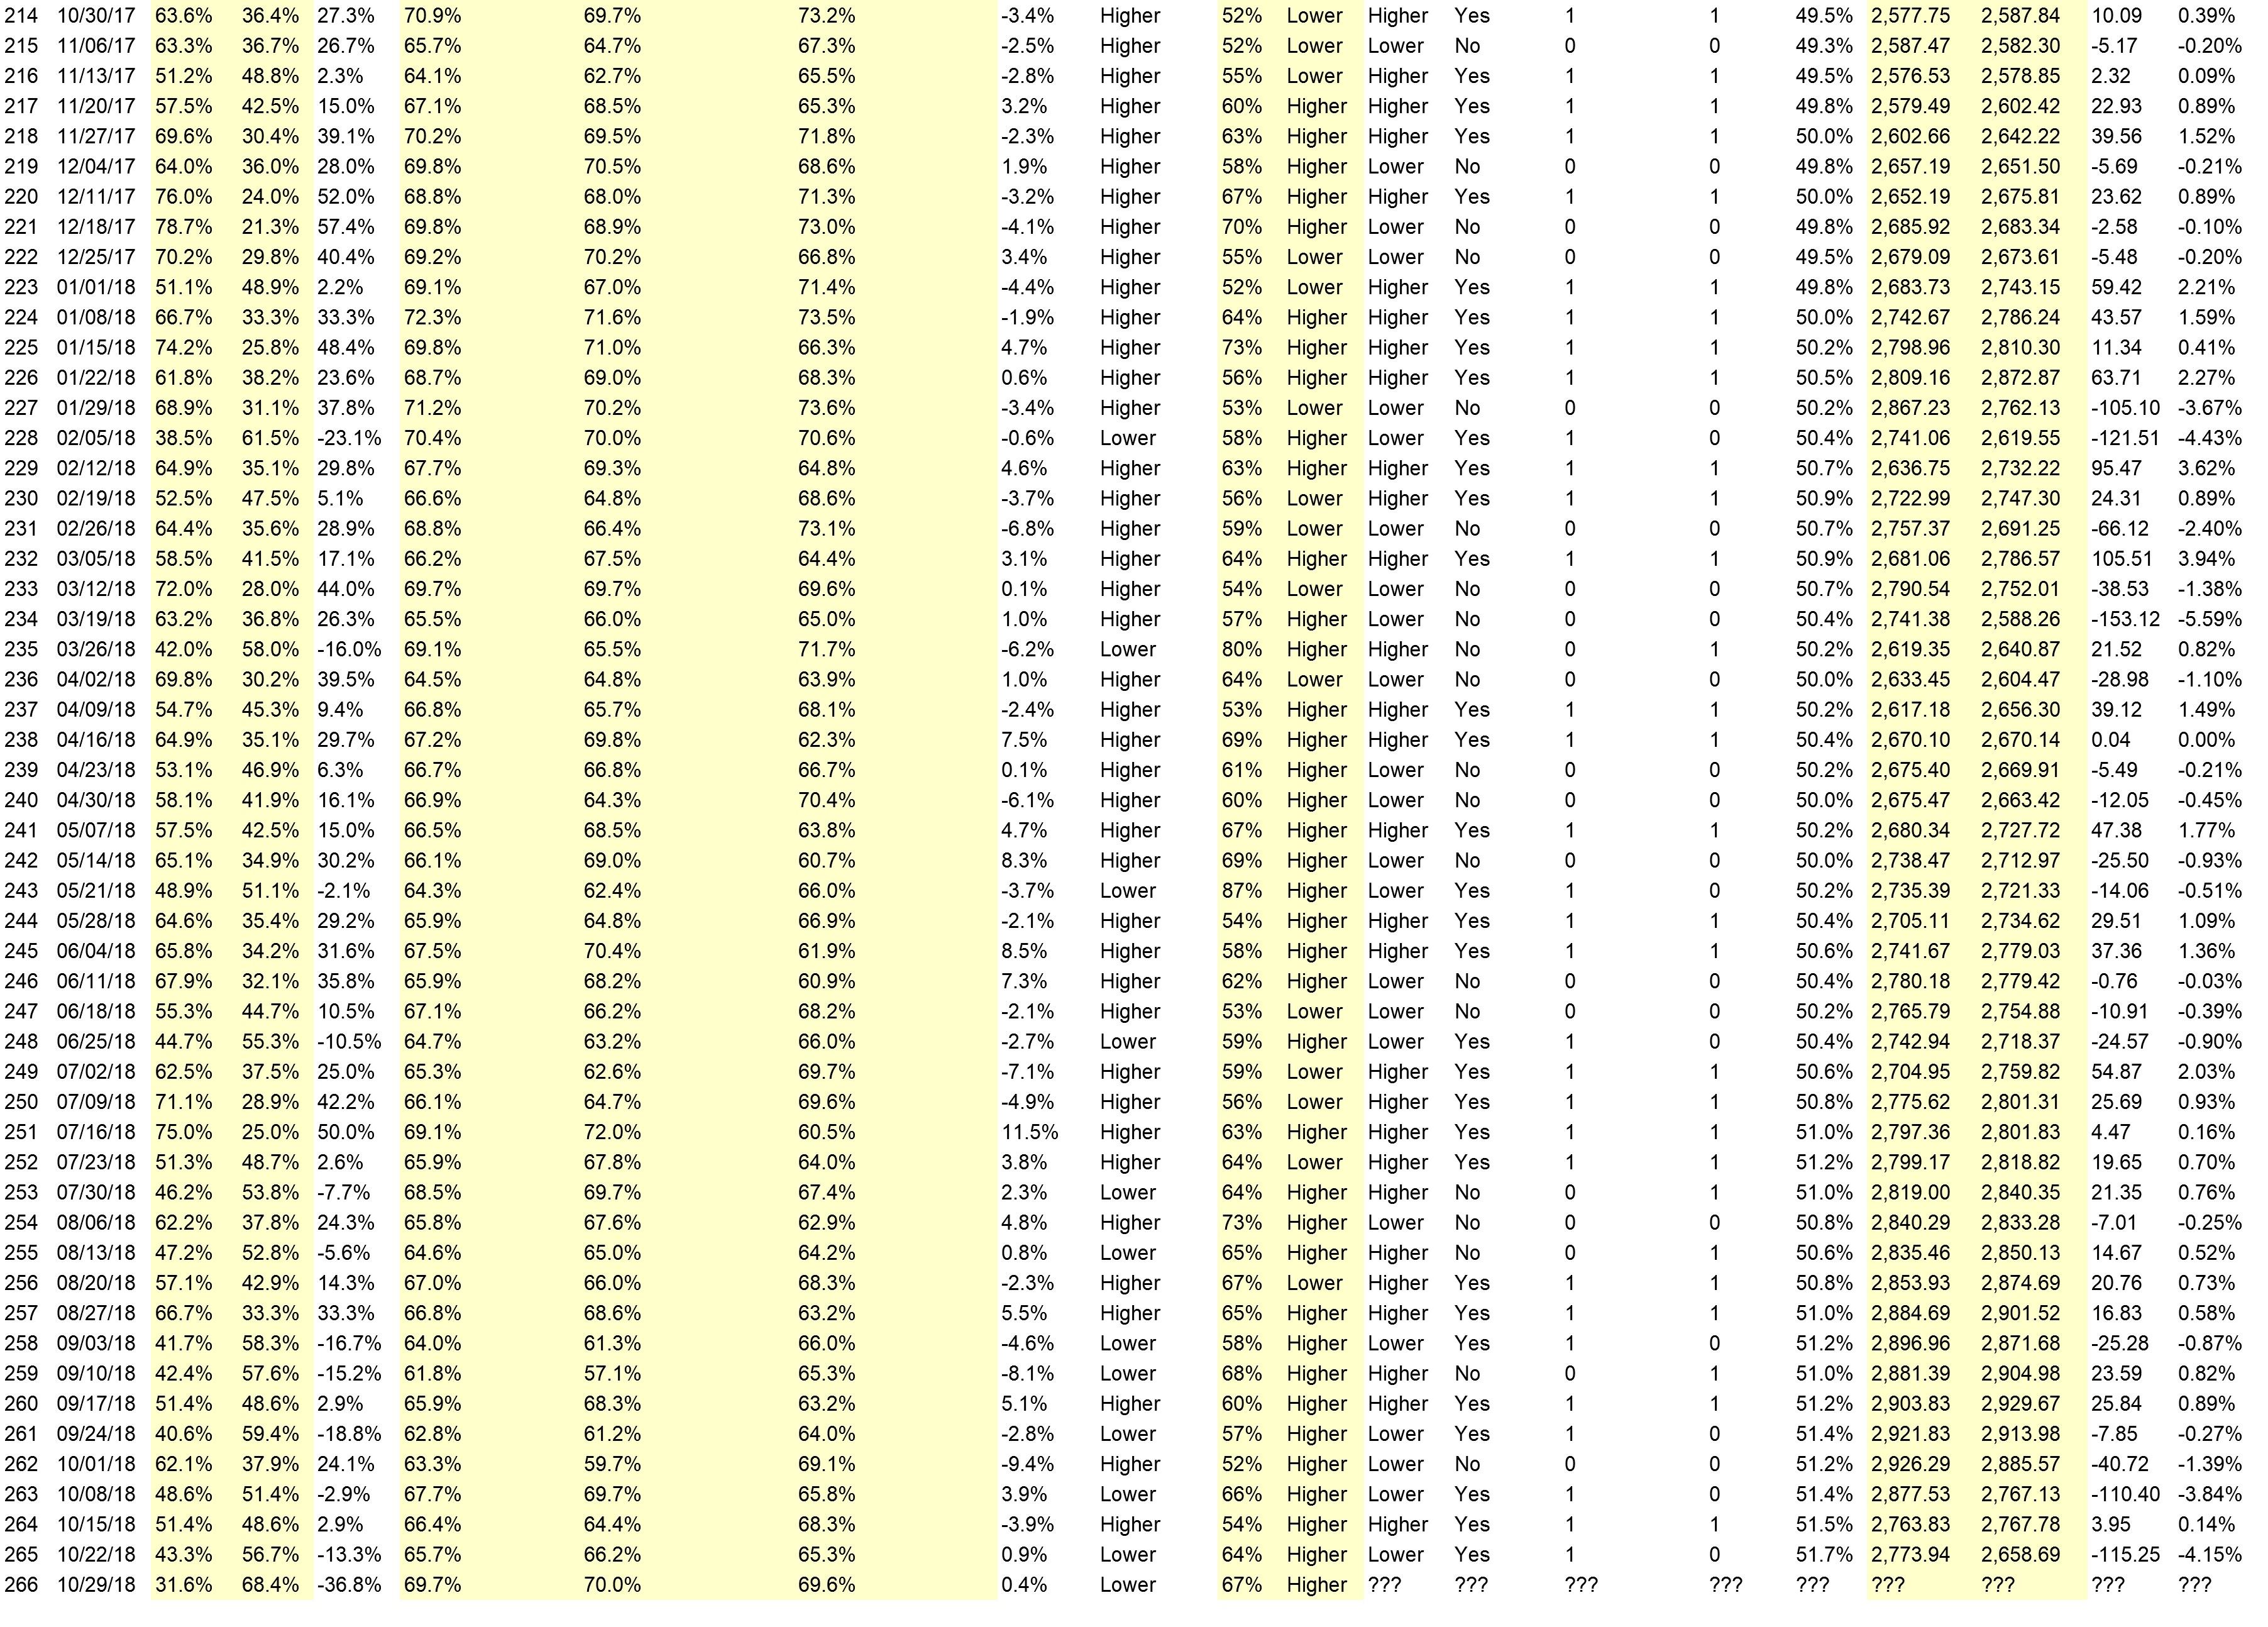
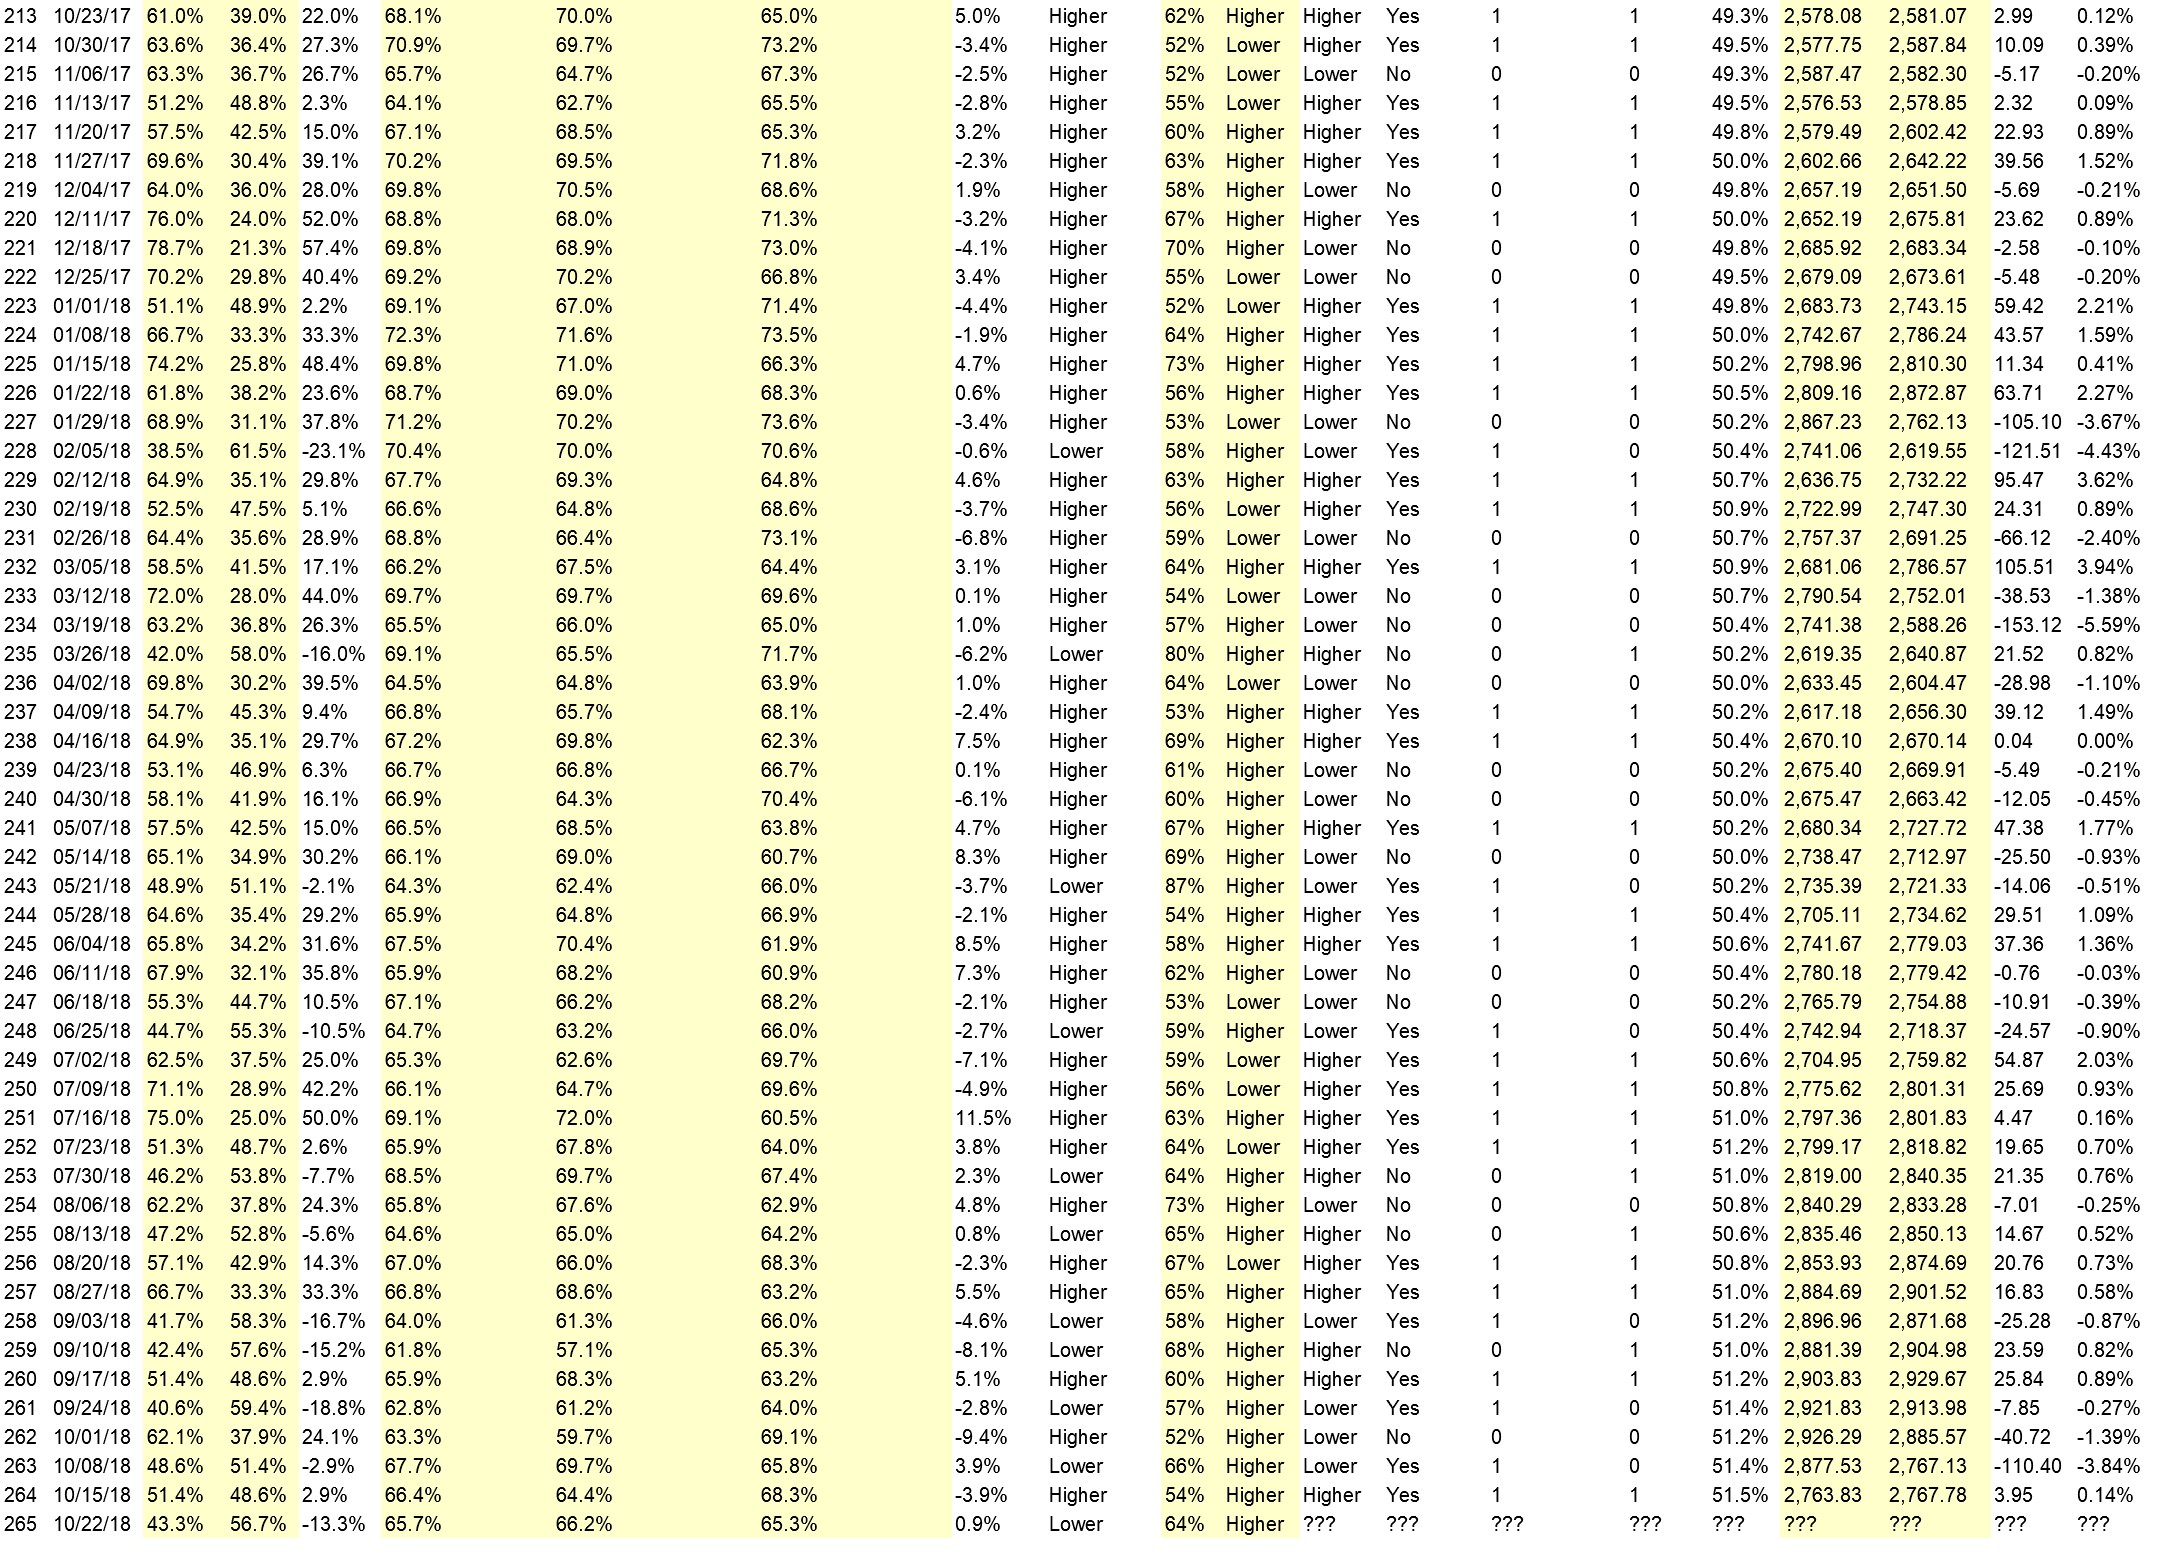
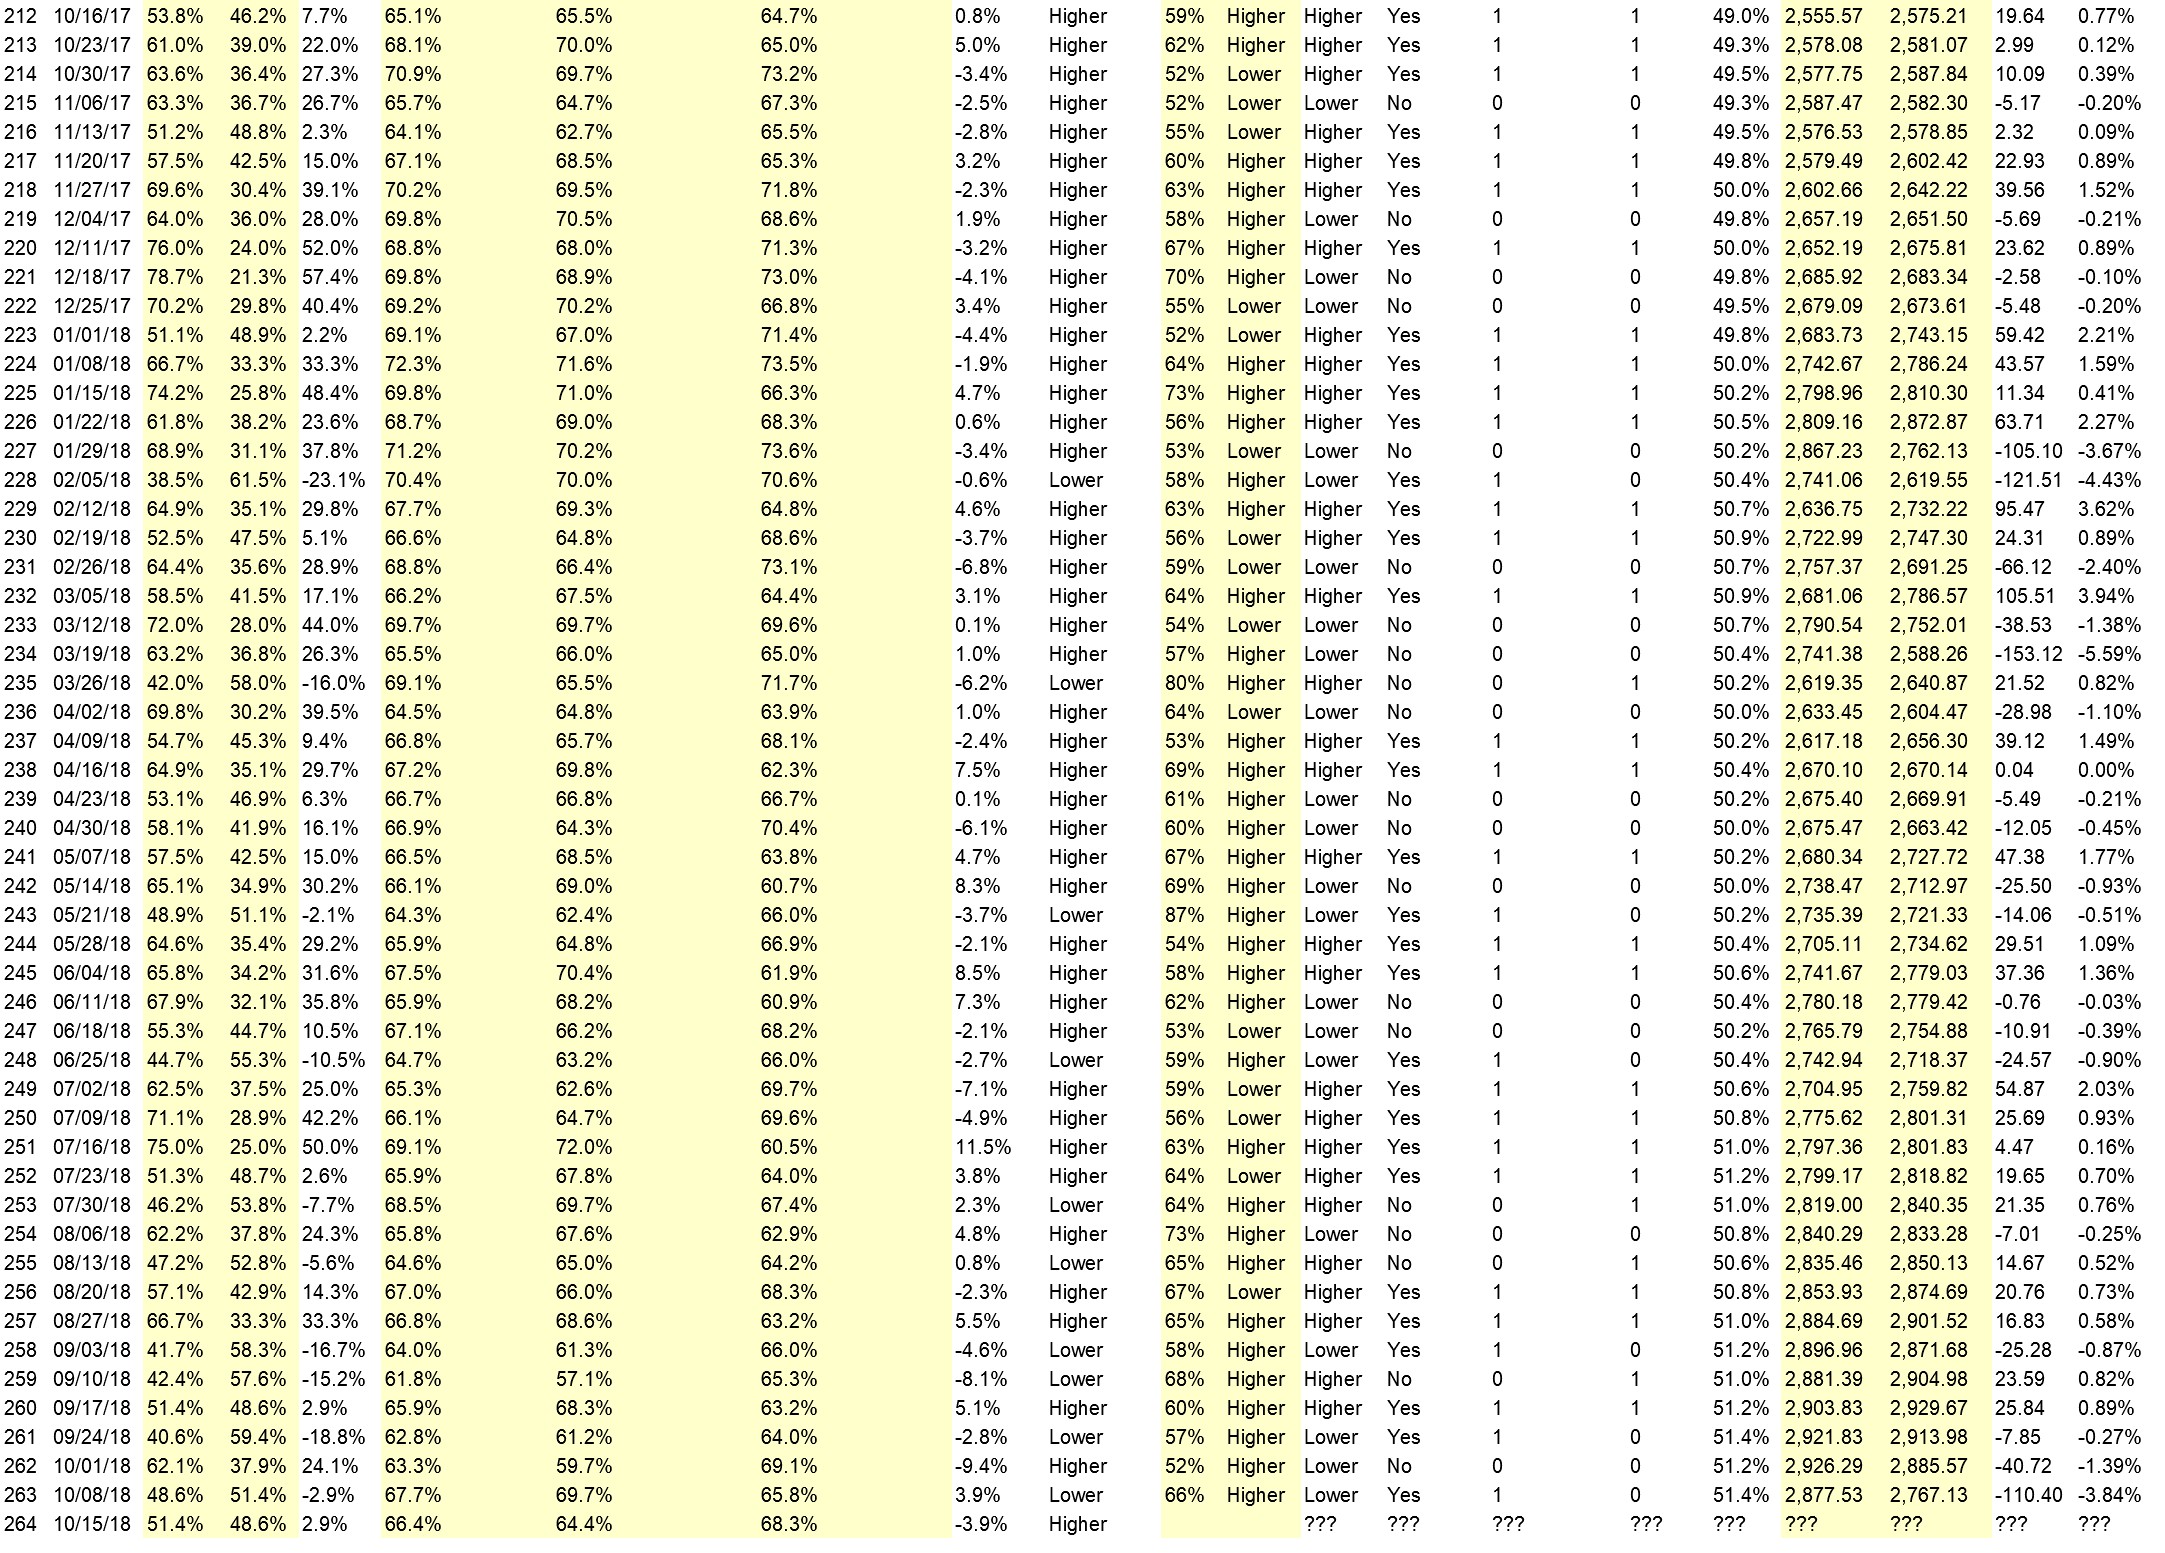
Full Weekly Results (full version of this chart available in the raw data spreadsheet for this week, “Date” field below lists the Monday of the week being predicted).
Overall Sentiment All-Time “Correct” Percentage: 51.5%
Overall Sentiment 52-Week “Correct” Percentage: 58.8%
Overall Sentiment 12-Week “Correct” Percentage: 54.5%
Only the previous 52 weeks of data are shown below, please download the raw data to see the full range of past data.
Weekly Reports Page: TimingResearch.com/reports
Raw Data Page: TimingResearch.com/rawdata
Current Survey Page: TimingResearch.com/currentsurvey
Any feedback: TimingResearch.com/contact
Email Alerts
Make sure you don’t miss all the future reports, show reminders, and bonus offers from TimingResearch, enter your email here:
By signing up you agree to receive newsletter and alert emails. You can unsubscribe at any time. Privacy Policies
NOTE: The following open-ended answers are solely the opinions of the anonymous respondents to this survey. Responses are mostly unedited, but some have been reformatted slightly for to make them easier to read. Some irrelevant responses (e.g. “none”), or anything obviously fake, or copy and pasted responses have been omitted. All-caps responses have been changed to all lowercase. All responses for each week, unedited, are available in the raw data spreadsheets at TimingResearch.com/data.
Question #3. For your answer to Question #1, please share what specific reason(s) you think the S&P500 will be heading the direction you chose.
“Higher” Respondent Answers:
• Santa Rally
• sentiment
• Counter-trend rally due to”Santa Claus” seasonal effect
• Santa Claus rally
• still buying
• oversold large short positions will be squeezed, SC rally
• Various factors including Fed and opex
• Oversold
• Last weeks high and low will be the range. I expect a bit lower on the first day or two and then a slow rise higher.
“Lower” Respondent Answers:
• Global uncertainty abounds with Brexit, French unrest, China’s faltering economy, etc.
• Elliott wave pattern suggests the selling may intensify as the “point of recognition ” takes hold.
• Bears are in control. Positive news has negative reaction. Decent earnings reports are not well received. Rising interest rates.
• below the 20,50,200 ma,slong tza—
• The downside correction is intensifying. The move will not be over under the public says “Just let me out”.
• The weekly chart has the S&P well above its 200-week moving average. The S&P hit this in early 2016; and figures to fall to it again in the coming months. Mutual funds have low levels of cash available for buying.
• Told ya so since August
• support broken
• major support broken
• 50dma about to death cross 200dma?
Partner Offer:
The Beauty of Options: In this free training, world renowned options trader, Jeff Bishop, will walk you through this ONE KEY SETUP that he uses daily to take advantage of crashing stocks. A small move in stock price can yield astronomical returns with options. Learn how here!
Question #4. What sort of hedging or portfolio protection strategies do you implement in your trading or investing?
• Closed my positions today and am in cash.
• Rebalancing switch to defensive preferred shares
• Dynamic stops
• stop losses
• No hedging, straightforward trading. Sink or swim.
• Stop Loss Orders
• Long spy puts and spreads
• Using options to assist in controlling risk exposure in core positions.
• long tza—-30%-cash to 50% cash
• puts
Question #5. Additional Comments/Questions/Suggestions?
• Want to trade – not just remain in cash – but want to make a plan – so currently in very limited positions.
• All RSI’s are dropping at this time – month, week, Day, H4, H1. It will be news driven this week.
• If it looks like a bear & growls like a bear…..
• need to see a reversal candle and then 3-higher hi-s and higher lo,s to re-enter long on the 1yr daily chart
Join us for this week’s shows:
Crowd Forecast News Episode #208
This week’s show will feature a discussion with the trading experts listed below about the most recent TimingResearch Crowd Forecast Newsletter report, where they think the S&P500 is headed, what they are watching for in the markets currently, and their best trading idea.
Date and Time:
– Monday, October 17th, 2018
– 1PM ET (10AM PT)
Moderator and Guests:
– Simon Klein of TradeSmart4x.com
– Norman Hallett of TheDisciplinedTrader.com
– Fausto Pugliese of CyberTradingUniversity.com
– Bennett McDowell of TradersCoach.com
– Dave Landry of DaveLandry.com (moderator)
Analyze Your Trade Episode #60
When you register, you will be prompted to list the top 5 stocks that you are interested in trading. We will list the top 5 from all registrants and our experts will be prepared to offer their opinions on these trades.
Date and Time:
– Tuesday, December 18th, 2018
– 4:30PM ET (1:30PM PT)
Moderator and Guests:
– Larry Gaines of PowerCycleTrading.com
– Jim Kenney of OptionProfessor.com
Partner Offer:
The Beauty of Options: In this free training, world renowned options trader, Jeff Bishop, will walk you through this ONE KEY SETUP that he uses daily to take advantage of crashing stocks. A small move in stock price can yield astronomical returns with options. Learn how here!
Crowd Forecast News Report #272
The new TimingResearch report for the week has been posted, you can download the full PDF report with the link below or you can read the full report in this post.
Click here to download report in PDF format: TRReport120918.pdf
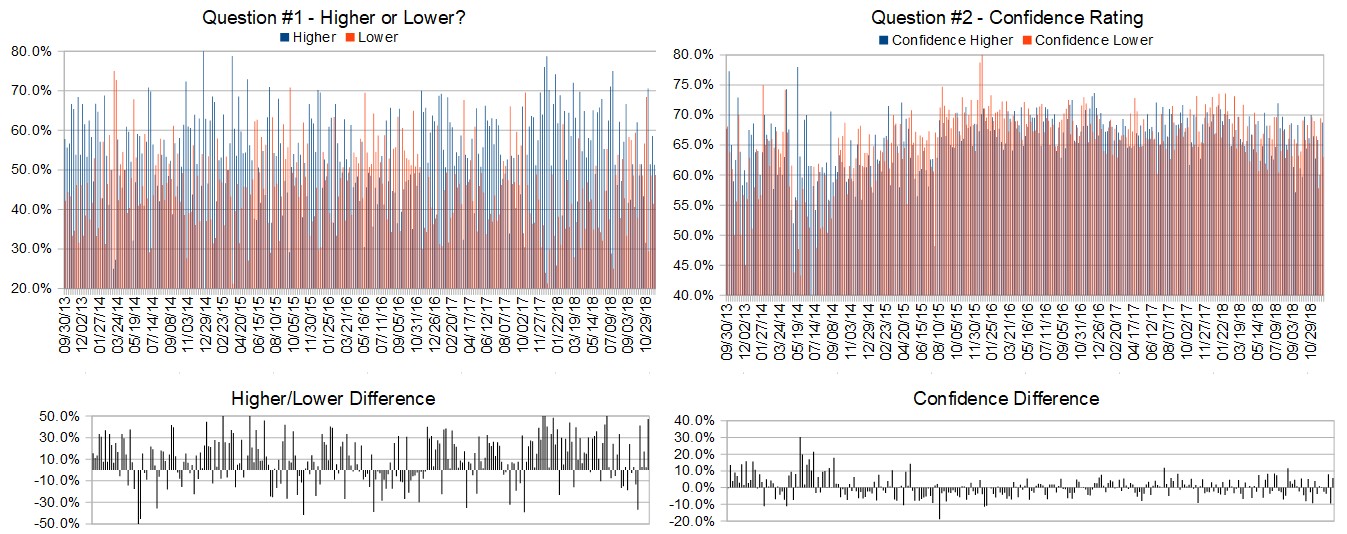
Question #Question #1. Which direction do you think the S&P500 index will move from this coming Monday’s open to Friday’s close (December 10th to 14th)?
The order of possible responses to this question on the survey were randomized for each viewer.)
Higher: 40.5%
Lower: 59.5%
Higher/Lower Difference: -19.0%
Question #2. Rate your confidence in your answer to Question #2 by estimating the probability you have correctly predicted next week’s market move.
Average of All Responses: 68.9%
Average For “Higher” Responses: 68.5%
Average For “Lower” Responses: 69.2%
Higher/Lower Difference: -0.7%
Responses Submitted This Week: 44
52-Week Average Number of Responses: 44.6
TimingResearch Crowd Forecast Prediction: 71% Chance Lower
This prediction is an attempt by the editor of this newsletter to use the full 5 year history of data collected from this project to forecast a probability estimate for whether this week’s sentiment is going to be correct and ultimately what the markets will do this coming week.
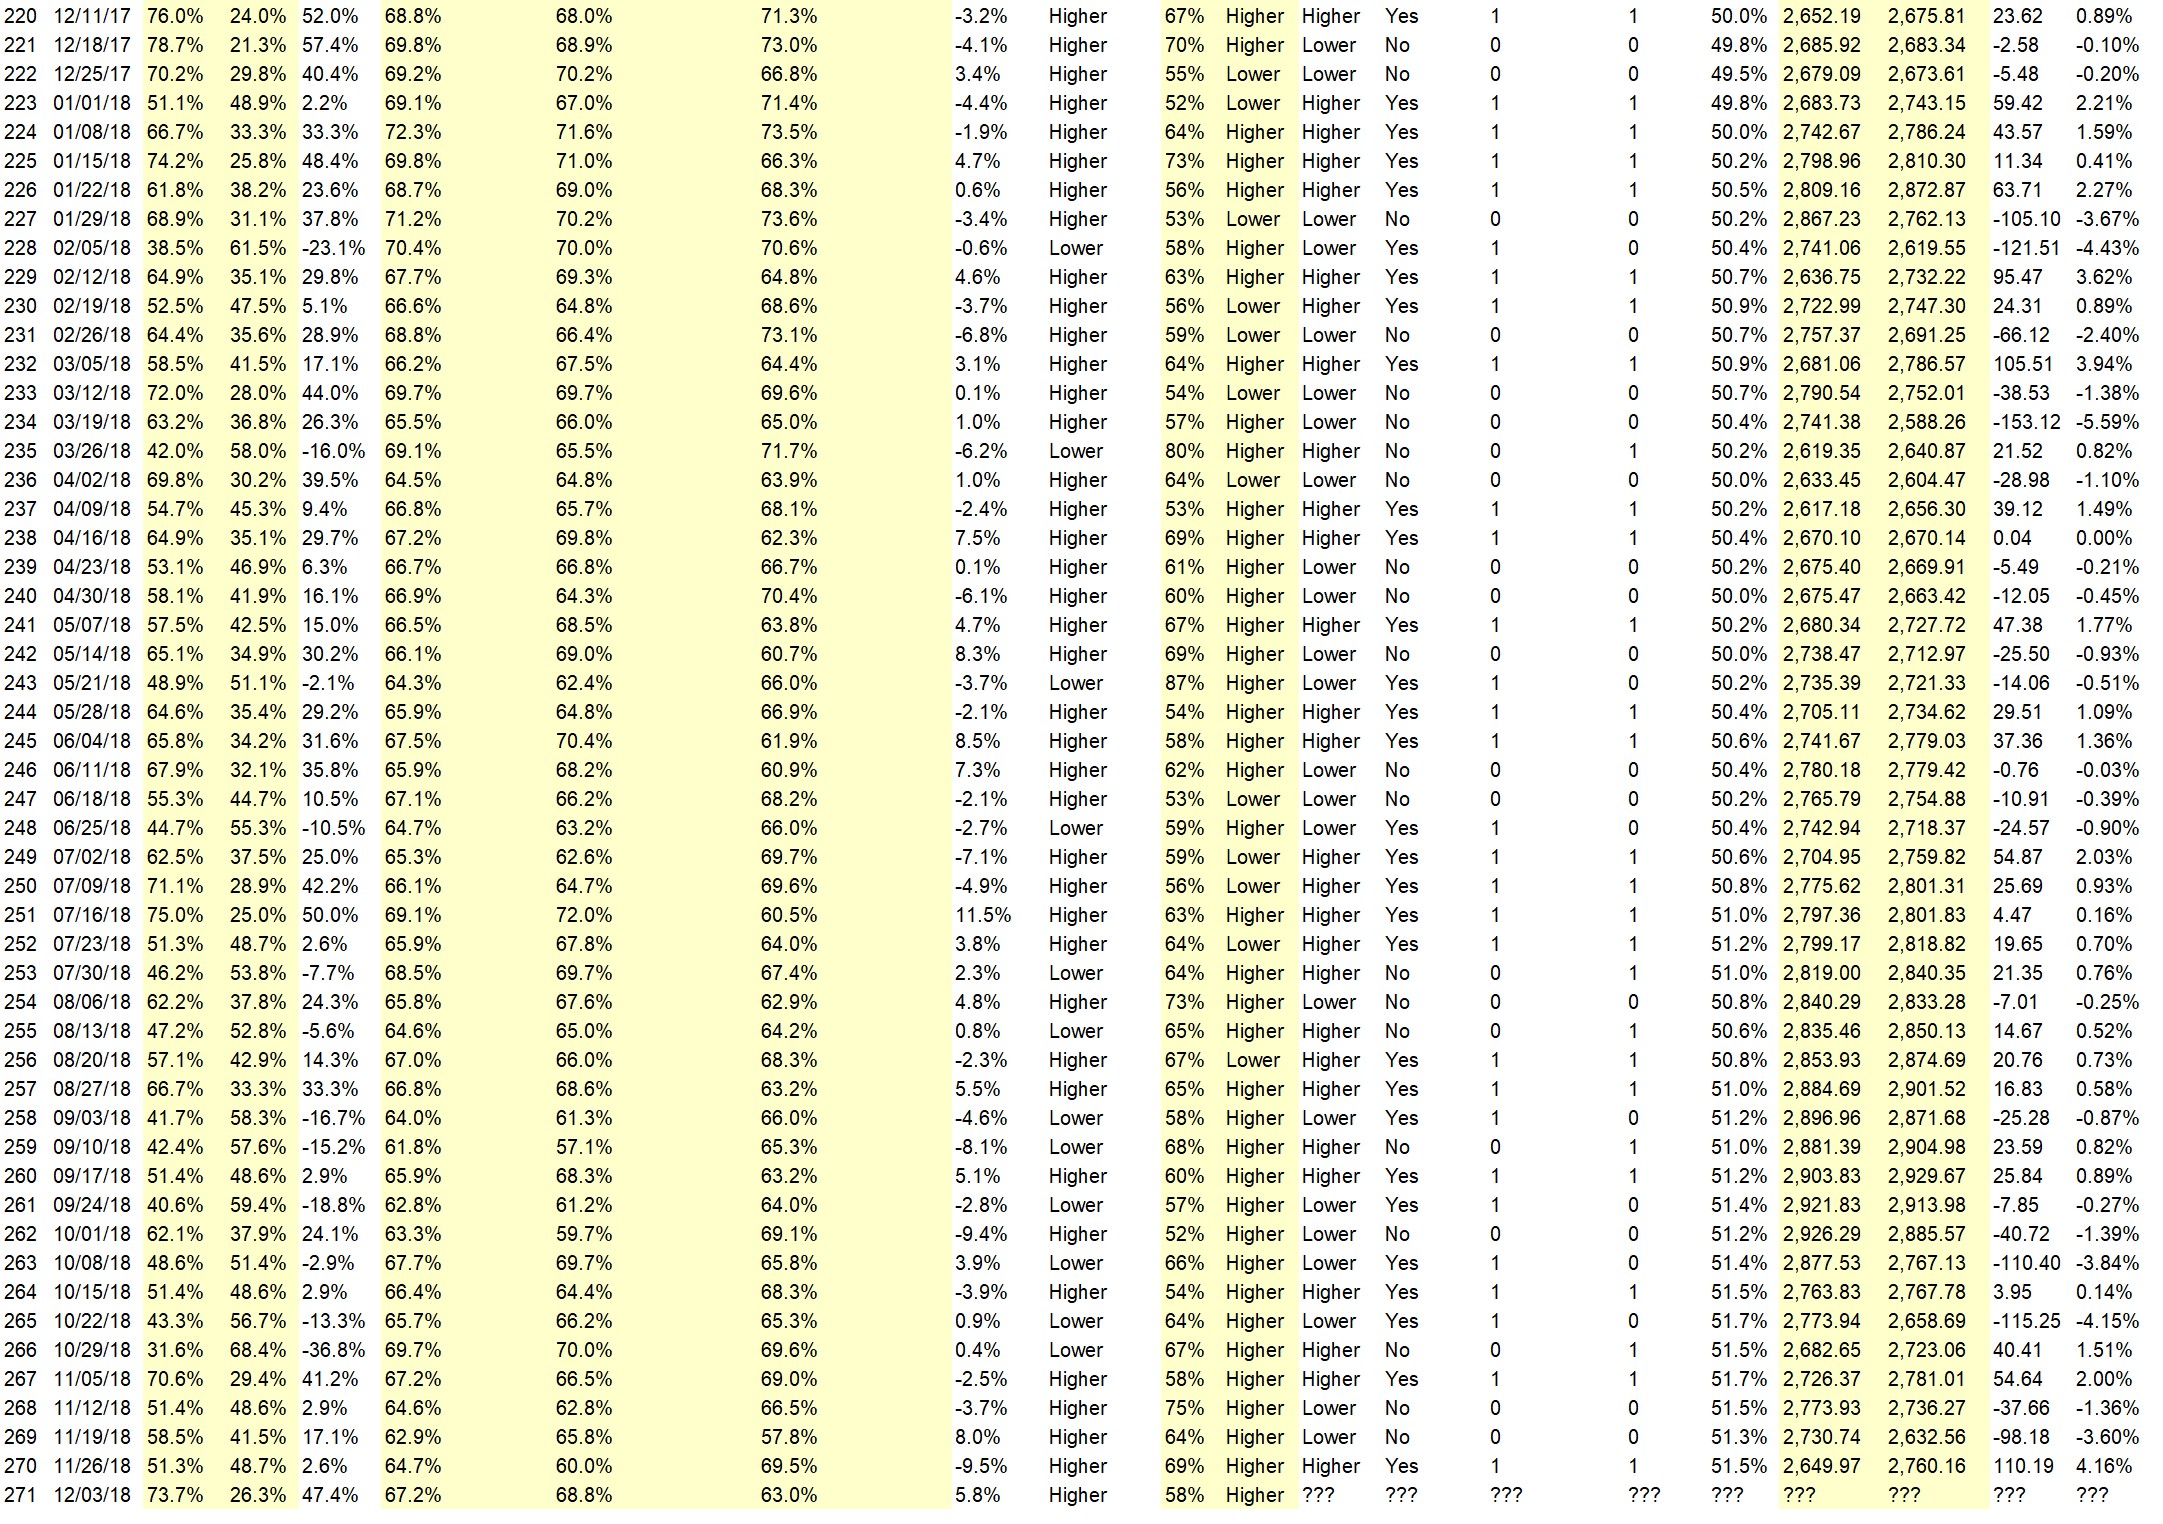
Details: Last week’s majority sentiment from the survey was 73.7% Higher, and the Crowd Forecast Indicator prediction was 58% Chance Higher; the S&P500 closed 5.64% Lower for the week. This week’s majority sentiment from the survey is 59.5% Lower with a greater average confidence from those who responded Lower. Similar conditions have occurred 17 times in the previous 271 weeks, with the majority sentiment being correct 71% of the time and with an average S&P500 move of 0.21% Lower for the week. Based on that history, the TimingResearch Crowd Forecast Indicator is forecasting a 71% Chance that the S&P500 is going to move Lower this coming week.
Raw Data Page (raw data files include full history spreadsheet and the above charts):
TimingResearch.com/data.
Partner Offer:
The Beauty of Options: In this free training, world renowned options trader, Jeff Bishop, will walk you through this ONE KEY SETUP that he uses daily to take advantage of crashing stocks. A small move in stock price can yield astronomical returns with options. Learn how here!
Full Weekly Results (full version of this chart available in the raw data spreadsheet for this week, “Date” field below lists the Monday of the week being predicted).
Overall Sentiment All-Time “Correct” Percentage: 51.3%
Overall Sentiment 52-Week “Correct” Percentage: 56.9%
Overall Sentiment 12-Week “Correct” Percentage: 54.5%
Only the previous 52 weeks of data are shown below, please download the raw data to see the full range of past data.

Weekly Reports Page: TimingResearch.com/reports
Raw Data Page: TimingResearch.com/rawdata
Current Survey Page: TimingResearch.com/currentsurvey
Any feedback: TimingResearch.com/contact
Email Alerts
Make sure you don’t miss all the future reports, show reminders, and bonus offers from TimingResearch, enter your email here:
By signing up you agree to receive newsletter and alert emails. You can unsubscribe at any time. Privacy Policies
NOTE: The following open-ended answers are solely the opinions of the anonymous respondents to this survey. Responses are mostly unedited, but some have been reformatted slightly for to make them easier to read. Some irrelevant responses (e.g. “none”), or anything obviously fake, or copy and pasted responses have been omitted. All-caps responses have been changed to all lowercase. All responses for each week, unedited, are available in the raw data spreadsheets at TimingResearch.com/data.
Question #3. For your answer to Question #1, please share what specific reason(s) you think the S&P500 will be heading the direction you chose.
“Higher” Respondent Answers:
• gut feeling
• Double bottom established in technical chart
• Oversold on the week and at support level.
• Holidays
• Proparity
• Oversold Bounce
• Markets have fallen to near-term support
• oversold buy
• Fed to the rescue.
“Lower” Respondent Answers:
• people will give up
• Futures are lower and indicators are lower. Plus trade issues
• Down trend
• the arrest of Huawei CFO and 3 months of mostly negative talks
• earnings and unemployment metrics
• general impression from chart review session.
• still below 200ma lower lo,s lower hi-s
• continued bad economic news
• I have created a MTF RSIxxx that shows the DAY has just rolled over with the H4 short, H1 short, M15 short. Yes, we will get some short-term pull back, but then further down we will go….
• The downside correction will continue until the public says “Just Get me Out”.
• GDP growth in 2019 is expected to decrease to 2.5%, maybe lower. Federal balance sheet being reduced. Tariffs still a drag. None of this is positive for the S&P.
• There will be no China deal in 2018. The interest rate hike is pretty certain.
• This week’s drop
• we are going down!
• people arre fearful with what the media is saying about the President and the creating divison
• That just seems to be the trend these days. Lower.
Partner Offer:
The Beauty of Options: In this free training, world renowned options trader, Jeff Bishop, will walk you through this ONE KEY SETUP that he uses daily to take advantage of crashing stocks. A small move in stock price can yield astronomical returns with options. Learn how here!
Question #4. What indicator influences your trading the most?
• Bollinger band analysis
• technicals
• VIX–
• Liquidity
• The Fed
• trend – Mov avgs
• CCI trend
• Custom indicators I have created
• Bollinger bands, MACD.
• 200ma
• RSI for short-term moves
• Moving Averages
• sentiment
• price and volume
• Stochastic
• elliott wave theory
• RSI
Question #5. Additional Comments/Questions/Suggestions?
• people will blame everything. but it’s just over valuation and expectation of decreased profits and the Silicon valley execs gone insane
• Anyone who chooses 100% sure cannot be correct. It only takes 1 future event to make the ship change course.
Join us for this week’s shows:
Crowd Forecast News Episode #207
This week’s show will feature a discussion with the trading experts listed below about the most recent TimingResearch Crowd Forecast Newsletter report, where they think the S&P500 is headed, what they are watching for in the markets currently, and their best trading idea.
Date and Time:
– Monday, December 10th, 2018
– 1PM ET (10AM PT)
Moderator and Guests:
– Damon Pavlatos of FuturePathTrading.com
– Glenn Thompson of PacificTradingAcademy.com
– Jim Kenney of OptionProfessor.com
– Michael Filighera of LogicalSignals.com (moderator)
Analyze Your Trade Episode #59
When you register, you will be prompted to list the top 5 stocks that you are interested in trading. We will list the top 5 from all registrants and our experts will be prepared to offer their opinions on these trades.
Date and Time:
– Tuesday, December 11th, 2018
– 4:30PM ET (1:30PM PT)
Moderator and Guests:
– Jerremy Newsome of RealLifeTrading.com
– Mike Pisani of AlphaShark.com (moderator)
Partner Offer:
The Beauty of Options: In this free training, world renowned options trader, Jeff Bishop, will walk you through this ONE KEY SETUP that he uses daily to take advantage of crashing stocks. A small move in stock price can yield astronomical returns with options. Learn how here!
Crowd Forecast News Report #271
The new TimingResearch report for the week has been posted, you can download the full PDF report with the link below or you can read the full report in this post below.
Click here to download report in PDF format: TRReport120218.pdf
Question #1. Which direction do you think the S&P500 index will move from this coming Monday’s open to Friday’s close (December 3rd to 7th)?
The order of possible responses to this question on the survey were randomized for each viewer.)
Higher: 73.7%
Lower: 26.3%
Higher/Lower Difference: 47.4%
Question #2. Rate your confidence in your answer to Question #2 by estimating the probability you have correctly predicted next week’s market move.
Average of All Responses: 67.2%
Average For “Higher” Responses: 68.8%
Average For “Lower” Responses: 63.0%
Higher/Lower Difference: 5.8%
Responses Submitted This Week: 40
52-Week Average Number of Responses: 44.8
TimingResearch Crowd Forecast Prediction: 58% Chance Higher
This prediction is an attempt by the editor of this newsletter to use the full 5 year history of data collected from this project to forecast a probability estimate for whether this week’s sentiment is going to be correct and ultimately what the markets will do this coming week.
Details: Last week’s majority sentiment from the survey was 51.3% Higher, and the Crowd Forecast Indicator prediction was 69% Chance Higher; the S&P500 closed 4.16% Higher for the week. This week’s majority sentiment from the survey is 73.7% Higher with a greater average confidence from those who responded Higher. Similar conditions have occurred 55 times in the previous 270 weeks, with the majority sentiment being correct 58% of the time and with an average S&P500 move of 0.13% Higher for the week. Based on that history, the TimingResearch Crowd Forecast Indicator is forecasting a 58% Chance that the S&P500 is going to move Higher this coming week.
Raw Data Page (raw data files include full history spreadsheet and the above charts):
TimingResearch.com/data.
Partner Offer:
Go Full Throttle with Top Gun Options! – A Week of Trading & Training December 3-6

Full Weekly Results (full version of this chart available in the raw data spreadsheet for this week, “Date” field below lists the Monday of the week being predicted).
Overall Sentiment All-Time “Correct” Percentage: 51.5%
Overall Sentiment 52-Week “Correct” Percentage: 58.8%
Overall Sentiment 12-Week “Correct” Percentage: 63.6%
Only the previous 52 weeks of data are shown below, please download the raw data to see the full range of past data.
Weekly Reports Page: TimingResearch.com/reports
Raw Data Page: TimingResearch.com/rawdata
Current Survey Page: TimingResearch.com/currentsurvey
Any feedback: TimingResearch.com/contact
Email Alerts
Make sure you don’t miss all the future reports, show reminders, and bonus offers from TimingResearch, enter your email here:
By signing up you agree to receive newsletter and alert emails. You can unsubscribe at any time. Privacy Policies
NOTE: The following open-ended answers are solely the opinions of the anonymous respondents to this survey. Responses are mostly unedited, but some have been reformatted slightly for to make them easier to read. Some irrelevant responses (e.g. “none”), or anything obviously fake, or copy and pasted responses have been omitted. All-caps responses have been changed to all lowercase. All responses for each week, unedited, are available in the raw data spreadsheets at TimingResearch.com/data.
Question #3. For your answer to Question #1, please share what specific reason(s) you think the S&P500 will be heading the direction you chose.
“Higher” Respondent Answers:
• Deal with China
• Resultado of US and Chinese talos about tarde tarrifs.
• Trump’s info from Southamerica
• Continued Rally from oversold.
• g20 talks positive bias… Fed dovish
• I think there is some optimism about about a trade deal between America and China. Even a hint of a deal would cheer investors.
• es went above 2763.56-on friday close –bullish for me. however ,crude to 48 then 43-.watching CRUDE–and dollar -as catalyst to down-recession???/dollar above 97.63–could kill my bull thesis-crude to 48/43.00 kill bull…….
• AD line going up, NYSI positive
• trade news
• Holiday season optimism
• history
• Short-covering rally to occur following Pres Trump’s relaxation of Jan 1 tariffs.
• This past week had a nice reversal up from the previous down week. The tariff stuff is probably already built into the market. Looking for continuation up.
• China deal
• Bogus rally playing out market loses twenty percent in 2019
• Trump will make it seem as though the trade tariffs are being eased, and the fed has softened their stance. Also money managers need to make a good showing by year end and will be pushing the mono sticks higher.
• Satna Rally
• Continued rally to Xmas
• Stochastics rise a couple more days then ?
“Lower” Respondent Answers:
• I answered lower. Yes, there could be a Santa Clause rally at this time? What I see is QQQ, IWM and SPY are all below the cloud on an ichimoku daily chart. All three are below or just touching the long-term M/A. All of my trend following indicators are pointing down. So there you have it, could continue higher for a while but I am expecting lower.
• Overbought market
• Trump/Xi negative outcome
• decreasing profit trend
• overbought short term
• It]s not so much that I believe markets will be lower next week as it is that I believe that once investors begin to realize the economy in general is really beginning to weaken and reverse course that market indexes begin seriously dropping. It begin next week or not but it is going to happen and sooner rather than much later. So I’m not predicting what will happen next week, necessarily. As the economy slows significantly, then the current spats of “irrational exuberence” will cease to occur as reality sets in.
• christmas / China
• Higher volatility happens in bear markets. Sudden large upmoves is what keeps hopeful bulls in the market even as it overall goes lower (ie in spite of the occasional large upmoves).
Partner Offer:
Go Full Throttle with Top Gun Options! – A Week of Trading & Training December 3-6
Question #4. What procedures do you use to monitor and evaluate your trading results and progress over time?
• rate of change
• 3ema—-8ema——20ema—-167ma-multiple time frames–20yr monthly –5yr monthly-macro——-then 3month daily—-1yr daily micro–
• Watch financial news daily
• Journal and assessing other ways I could have done the trade better
• growing/shrinking bottom line
• I keep a simple spreadsheet of results, with a lot of room for notes what we could have done in a better way, mistakes and general observation how a particular stock or ETF behaves.
• Account balance
• A lot of journalling does not work for me. However sometimes there’s an important lesson learned and I’ll keep those highlighted on same page as my current trades so I’m forced to read it as a reminder. By “same page”, that’s my own list of trades entered on my own Excel spreadsheet.
• Input results of each trade into spreadsheet & study results of each trade in a post mortem review. Mark up charts of each trade & save file for future reference..
• Schwab
• financial software
Question #5. Additional Comments/Questions/Suggestions?
• When will this market turn down for the long tern
Join us for this week’s shows:
Crowd Forecast News Episode #206
This week’s show will feature a discussion with the trading experts listed below about the most recent TimingResearch Crowd Forecast Newsletter report, where they think the S&P500 is headed, what they are watching for in the markets currently, and their best trading idea.
Date and Time:
– Monday, December 3rd, 2018
– 1PM ET (10AM PT)
Moderator and Guests:
– Rob Hanna of InvestiQuant.com & QuantifiableEdges.com (moderator)
– Sean Kozak of NeuroStreet.com
– Neil Batho of TraderReview.net
Analyze Your Trade Episode #58
When you register, you will be prompted to list the top 5 stocks that you are interested in trading. We will list the top 5 from all registrants and our experts will be prepared to offer their opinions on these trades.
Date and Time:
– Tuesday, December 4th, 2018
– 4:30PM ET (1:30PM PT)
Moderator and Guests:
– Jim Kenney of OptionProfessor.com
– Christian Fromhertz of TribecaTradeGroup.com
– Michael Filighera of LogicalSignals.com (moderator)
Partner Offer:
Go Full Throttle with Top Gun Options! – A Week of Trading & Training December 3-6
Crowd Forecast News Report #270
The new TimingResearch report for the week has been posted, you can download the full PDF report with the link below or you can read the full report in this post below.
Click here to download report in PDF format: TRReport112518.pdf
Question #1. Which direction do you think the S&P500 index will move from this coming Monday’s open to Friday’s close (November 26th to 30th)?
The order of possible responses to this question on the survey were randomized for each viewer.)
Higher: 51.3%
Lower: 48.7%
Higher/Lower Difference: 2.6%
Question #2. Rate your confidence in your answer to Question #2 by estimating the probability you have correctly predicted next week’s market move.
Average of All Responses: 64.7%
Average For “Higher” Responses: 60.0%
Average For “Lower” Responses: 69.5%
Higher/Lower Difference: -9.5%
Responses Submitted This Week: 41
52-Week Average Number of Responses: 45.1
TimingResearch Crowd Forecast Prediction: 69% Chance Higher
This prediction is an attempt by the editor of this newsletter to use the full 5 year history of data collected from this project to forecast a probability estimate for whether this week’s sentiment is going to be correct and ultimately what the markets will do this coming week.
Details: Last week’s majority sentiment from the survey was 58.5% Higher, and the Crowd Forecast Indicator prediction was 64% Chance Higher; the S&P500 closed 3.60% Lower for the week. This week’s majority sentiment from the survey is 51.3% Higher with a greater average confidence from those who responded Lower. Similar conditions have occurred 13 times in the previous 269 weeks, with the majority sentiment being correct 69% of the time and with an average S&P500 move of 0.28% Higher for the week. Based on that history, the TimingResearch Crowd Forecast Indicator is forecasting a 69% Chance that the S&P500 is going to move Higher this coming week.
Raw Data Page (raw data files include full history spreadsheet and the above charts):
TimingResearch.com/data.
Partner Offer:
You Need This Woman In Your Life: The best part about Petra is not only can she locate and lock in reliable profits, she prides herself on eliminating risk and providing unparalleled educational services for her clients (learn more here).

Full Weekly Results (full version of this chart available in the raw data spreadsheet for this week, “Date” field below lists the Monday of the week being predicted).
Overall Sentiment All-Time “Correct” Percentage: 51.3%
Overall Sentiment 52-Week “Correct” Percentage: 56.9%
Overall Sentiment 12-Week “Correct” Percentage: 54.5%
Only the previous 52 weeks of data are shown below, please download the raw data to see the full range of past data.

Weekly Reports Page: TimingResearch.com/reports
Raw Data Page: TimingResearch.com/rawdata
Current Survey Page: TimingResearch.com/currentsurvey
Any feedback: TimingResearch.com/contact
Email Alerts
Make sure you don’t miss all the future reports, show reminders, and bonus offers from TimingResearch, enter your email here:
By signing up you agree to receive newsletter and alert emails. You can unsubscribe at any time. Privacy Policies
NOTE: The following open-ended answers are solely the opinions of the anonymous respondents to this survey. Responses are mostly unedited, but some have been reformatted slightly for to make them easier to read. Some irrelevant responses (e.g. “none”), or anything obviously fake, or copy and pasted responses have been omitted. All-caps responses have been changed to all lowercase. All responses for each week, unedited, are available in the raw data spreadsheets at TimingResearch.com/data.
Question #3. For your answer to Question #1, please share what specific reason(s) you think the S&P500 will be heading the direction you chose.
“Higher” Respondent Answers:
• Oil dropping is what some people like maybe
• Market Oversold
• toenadererig met china begin december
• Positive trade talks with China
• Oversold, Advance decline line, Accumulation distribution, COT index
• W shape
• over sold bounce
• dead cat bounce
• history
• oversold buy
• Oil stocks should get a deda cat bounce taking the S&P up
• Beginning of Santa Clause rally.
• Short term rally based on stochastics.
“Lower” Respondent Answers:
• Last week’s selloffs
• Market has been down trend for last three weeks and volitity high
• The index will probably test the February low 1530
• general feelings are negative
• Chart pattern in progress Tech sector will continue to see lower revised price targets
• rate of change growth metrics
• below the 200dma
• The downside correction continues until the public says “Just get me out”.
• The S&P tanked badly on Thanksgiving week (generally a plus week), and the FAANGS and financials show no desire to reverse up. The recent bounce pattern is that bounces are being sold.
• Trade concerns with China & G`20 meeting. Border confrontation
• year end selling, tax reasons also
Partner Offer:
You Need This Woman In Your Life: The best part about Petra is not only can she locate and lock in reliable profits, she prides herself on eliminating risk and providing unparalleled educational services for her clients (learn more here).
Question #4. What sort of hedging or portfolio protection strategies do you implement in your trading or investing?
• Covered Calls and Vertical Spreads
• monitor S&P very closely
• Puts
• went to cash
• Using options to hedge long term and core positions.
• buy the SQQQ——SH—–VXX CALLS—-SDS—SDOW—–Combination of these 5-10% of portfolio, 30% cash ,
• stop loss orders
• Covered calls
• Buy puts to hedge..
• Go preferred stocks etfs cefs
• However, I do not make any hedge.
• I close postns as my stops get hit
• VIXY
• cash optionality
• SDS Bull call spread out 2 weeks
• Short term put options on long positions
Question #5. Additional Comments/Questions/Suggestions?
• why are these newsetters telling us to buy and they the large investors, institutions, hedge funds are selling?
• keep up the good work.
• Looking forward to the webinar
• add inflation expectations
• Any credence to Raj call for 11/26 to be a swing low?
Join us for this week’s shows:
Crowd Forecast News Episode #205
This week’s show will feature a discussion with the trading experts listed below about the most recent TimingResearch Crowd Forecast Newsletter report, where they think the S&P500 is headed, what they are watching for in the markets currently, and their best trading idea.
Date and Time:
– Monday, November 26th, 2018
– 1PM ET (10AM PT)
Moderator and Guests:
– Jim Kenney of OptionProfessor.com
– Norman Hallett of TheDisciplinedTrader.com
– John Thomas of MadHedgeFundTrader.com
– Michael Filighera of LogicalSignals.com (moderator)
Analyze Your Trade Episode #57
When you register, you will be prompted to list the top 5 stocks that you are interested in trading. We will list the top 5 from all registrants and our experts will be prepared to offer their opinions on these trades.
Date and Time:
– Tuesday, November 27th, 2018
– 4:30PM ET (1:30PM PT)
Moderator and Guests:
– Jerremy Newsome of RealLifeTrading.com (first time guest!)
– Larry Gaines of PowerCycleTrading.com
– Andrew Keene of AlphaShark.com
– E. Matthew “Whiz” Buckley of TopGunOptions.com (moderator)
Partner Offer:
You Need This Woman In Your Life: The best part about Petra is not only can she locate and lock in reliable profits, she prides herself on eliminating risk and providing unparalleled educational services for her clients (learn more here).
Crowd Forecast News Report #269
The new TimingResearch report for the week has been posted, you can download the full PDF report with the link below or you can read the full report in this post below.
Click here to download report in PDF format: TRReport111818.pdf
Question #1. Which direction do you think the S&P500 index will move from this coming Monday’s open to Friday’s close (November 19th to 23rd)?
The order of possible responses to this question on the survey were randomized for each viewer.)
Higher: 58.5%
Lower: 41.5%
Higher/Lower Difference: 17.1%
Question #2. Rate your confidence in your answer to Question #2 by estimating the probability you have correctly predicted next week’s market move.
Average of All Responses: 62.9%
Average For “Higher” Responses: 65.8%
Average For “Lower” Responses: 57.8%
Higher/Lower Difference: 8.0%
Responses Submitted This Week: 42
52-Week Average Number of Responses: 45.2
TimingResearch Crowd Forecast Prediction: 64% Chance Higher
This prediction is an attempt by the editor of this newsletter to use the full 5 year history of data collected from this project to forecast a probability estimate for whether this week’s sentiment is going to be correct and ultimately what the markets will do this coming week.
Details: Last week’s majority sentiment from the survey was 51.4% Higher, and the Crowd Forecast Indicator prediction was 75% Chance Higher; the S&P500 closed 1.36% Lower for the week. This week’s majority sentiment from the survey is 58.5% Higher with a greater average confidence from those who responded Higher. Similar conditions have occurred 25 times in the previous 268 weeks, with the majority sentiment being correct 64% of the time and with an average S&P500 move of 0.33% Higher for the week. Based on that history, the TimingResearch Crowd Forecast Indicator is forecasting a 64% Chance that the S&P500 is going to move Higher this coming week.
Raw Data Page (raw data files include full history spreadsheet and the above charts):
TimingResearch.com/data.
Full Weekly Results (full version of this chart available in the raw data spreadsheet for this week, “Date” field below lists the Monday of the week being predicted).
Overall Sentiment All-Time “Correct” Percentage: 51.5%
Overall Sentiment 52-Week “Correct” Percentage: 58.8%
Overall Sentiment 12-Week “Correct” Percentage: 63.6%
Only the previous 52 weeks of data are shown below, please download the raw data to see the full range of past data.
Weekly Reports Page: TimingResearch.com/reports
Raw Data Page: TimingResearch.com/rawdata
Current Survey Page: TimingResearch.com/currentsurvey
Any feedback: TimingResearch.com/contact
Email Alerts
Make sure you don’t miss all the future reports, show reminders, and bonus offers from TimingResearch, enter your email here:
By signing up you agree to receive newsletter and alert emails. You can unsubscribe at any time. Privacy Policies
NOTE: The following open-ended answers are solely the opinions of the anonymous respondents to this survey. Responses are mostly unedited, but some have been reformatted slightly for to make them easier to read. Some irrelevant responses (e.g. “none”), or anything obviously fake, or copy and pasted responses have been omitted. All-caps responses have been changed to all lowercase. All responses for each week, unedited, are available in the raw data spreadsheets at TimingResearch.com/data.
Question #3. For your answer to Question #1, please share what specific reason(s) you think the S&P500 will be heading the direction you chose.
“Higher” Respondent Answers:
• Gaps in technical charts of Dow, S&P and Nasdaq were filled on last Thursday. On economic fundamentals, US market should resume uptrend. Correction flushed out the froths. Market is very healthy now.
• Watching the chart and intuition
• The market is ripe for a rebound
• Sazonality
• Holidays
• Gut
• seasonal tendencies
• Thanksgiving week is usually an up week. The market held okay on Thurs & Fri, so some short-term upside is plausible.
• Best six months historically
• support
• higher low[week 11/2 compare to May ,April weeks]
• holiday seasonality
• pull back in an uptrend after the recent sell off low
• seasonality
• We need some sort of double top before the real bear market hits us.
“Lower” Respondent Answers:
• the COD are never right .
• I think we have passed a support level which is now resistance
• A trend has started.
• most traders off for the holiday week
• The downside correction will continue until the public says “just let me out”. Retail earnings and expectations should be a drag on the market.
• sellers in control
• Market seems range bound. Interest rate concerns.
• Market upswing runs out
• momentum weak
Partner Offer:
Did you ever think that becoming a professional trader is out of reach? Think again.
Click here to learn how.

TopstepTrader has funded more than 1,800 traders just like you with live trading capital. They take all the risk.
You keep the first $5,000 in profits and 80% thereafter.
Question #4. Which trading platform or broker do you like the best for executing your trades?
• thinkorswim
• Fidelity and TOS
• Trade Station
• Tradestation
• Using Charles Schwab now. Not entirely satisfied.
• Tradestation, Interactive brokers
• Tasty trade
• Interactive Brokers
• E-Trade
• ninja
• Sogo
• Ally.
• Fidessa my broker is ADM(UK)
• Tradestation
• TradeStation
• AMP – Ninja
• AMP and Sierra Charts
• ninja trader
Question #5. Additional Comments/Questions/Suggestions?
• I like that third party indications created for Think or Swim are better than when created for Tradestation
Join us for this week’s shows:
Crowd Forecast News Episode #204
This week’s show will feature a discussion with the trading experts listed below about the most recent TimingResearch Crowd Forecast Newsletter report, where they think the S&P500 is headed, what they are watching for in the markets currently, and their best trading idea.
Date and Time:
– Monday, November 19th, 2018
– 1PM ET (10AM PT)
Moderator and Guests:
– Larry Gaines of PowerCycleTrading.com
– John Hoagland of TopstepTrader.com
– Simon Klein of TradeSmart4x.com
– Michael Filighera of LogicalSignals.com (moderator)
Analyze Your Trade Episode #56
When you register, you will be prompted to list the top 5 stocks that you are interested in trading. We will list the top 5 from all registrants and our experts will be prepared to offer their opinions on these trades.
Date and Time:
– Tuesday, November 20th, 2018
– 4:30PM ET (1:30PM PT)
Moderator and Guests:
– Jim Kenney of OptionProfessor.com
– Neil Batho of TraderReview.net
Partner Offer:
Did you ever think that becoming a professional trader is out of reach? Think again.
Click here to learn how.
TopstepTrader has funded more than 1,800 traders just like you with live trading capital. They take all the risk.
You keep the first $5,000 in profits and 80% thereafter.
Crowd Forecast News Report #268
The new TimingResearch report for the week has been posted, you can download the full PDF report with the link below or you can read the full report in this post below.
Click here to download report in PDF format: TRReport111118.pdf
Question #1. Which direction do you think the S&P500 index will move from this coming Monday’s open to Friday’s close (November 12th to 16th)?
The order of possible responses to this question on the survey were randomized for each viewer.)
Higher: 51.4%
Lower: 48.6%
Higher/Lower Difference: 2.9%
Question #2. Rate your confidence in your answer to Question #2 by estimating the probability you have correctly predicted next week’s market move.
Average of All Responses: 64.6%
Average For “Higher” Responses: 62.8%
Average For “Lower” Responses: 66.5%
Higher/Lower Difference: -3.7%
Responses Submitted This Week: 37
52-Week Average Number of Responses: 45.2
TimingResearch Crowd Forecast Prediction: 75% Chance Higher
This prediction is an attempt by the editor of this newsletter to use the full 5 year history of data collected from this project to forecast a probability estimate for whether this week’s sentiment is going to be correct and ultimately what the markets will do this coming week.
Details: Last week’s majority sentiment from the survey was 70.6% Higher, and the Crowd Forecast Indicator prediction was 58% Chance Higher; the S&P500 closed 2.00% Higher for the week. This week’s majority sentiment from the survey is 51.4% Higher with a greater average confidence from those who responded Lower. Similar conditions have occurred 12 times in the previous 267 weeks, with the majority sentiment being correct 75% of the time and with an average S&P500 move of 0.41% Higher for the week. Based on that history, the TimingResearch Crowd Forecast Indicator is forecasting a 75% Chance that the S&P500 is going to move Higher this coming week.

Raw Data Page (raw data files include full history spreadsheet and the above charts):
TimingResearch.com/data.
Full Weekly Results (full version of this chart available in the raw data spreadsheet for this week, “Date” field below lists the Monday of the week being predicted).
Overall Sentiment All-Time “Correct” Percentage: 51.7%
Overall Sentiment 52-Week “Correct” Percentage: 60.8%
Overall Sentiment 12-Week “Correct” Percentage: 72.7%
Only the previous 52 weeks of data are shown below, please download the raw data to see the full range of past data.
Weekly Reports Page: TimingResearch.com/reports
Raw Data Page: TimingResearch.com/rawdata
Current Survey Page: TimingResearch.com/currentsurvey
Any feedback: TimingResearch.com/contact
Email Alerts
Make sure you don’t miss all the future reports, show reminders, and bonus offers from TimingResearch, enter your email here:
By signing up you agree to receive newsletter and alert emails. You can unsubscribe at any time. Privacy Policies
NOTE: The following open-ended answers are solely the opinions of the anonymous respondents to this survey. Responses are mostly unedited, but some have been reformatted slightly for to make them easier to read. Some irrelevant responses (e.g. “none”), or anything obviously fake, or copy and pasted responses have been omitted. All-caps responses have been changed to all lowercase. All responses for each week, unedited, are available in the raw data spreadsheets at TimingResearch.com/data.
Question #3. For your answer to Question #1, please share what specific reason(s) you think the S&P500 will be heading the direction you chose.
“Higher” Respondent Answers:
• Wicker won
• Sazonality rebound with a bottom market situation.
• Earnings and holiday spending
• holidays
• Earnings reports.
• Seasonal …. strong month in November…. bullish overall ….
• Continued battle between bulls and bears, net up move into monthly expiration.
• history
• still buying
• Consumer confidence high Holiday spending will be up Possible trade agreement with China
• 2811 seems to be a good level for next week because of historical relevance of that level
“Lower” Respondent Answers:
• Current momentum downward will take some time to subside.
• Still in a down trend, below 50 SMA
• Mid-term elections are over, so seasonality factor is gone.
• spy below 277
• The downside correction continues until the public says “just get me out”.
• The S&P hit it’s weekly high on Thursday, then fell on Friday. This high was below the high of early October. This lower high suggests general market weakness. Concern about the Fed raising rates and tariffs is expected to continue.
• Feds next raise Wii send rates over 3%
• tariffs
• at resistance – sell rallies
• Elliot wave pattern
• Technicals turning over, plus a dearth of good news.
• The market was down last Thursday and Friday, Friday was bad.
Partner Offer:
The Alpha Fibonacci Method works on any instrument, any time frame, and any platform with ultimate accuracy at trend inception and trend reversals.
You’ll see how on this online training.

Question #4. What do you think are the main reasons why most traders are not successful and consistent? What could the average trader do to improve consistency?
• need a rule set to follow that profits in up and down markets and most don’t have that.
• Protective put
• discipline –put stops in first-patience
• trade less often
• Emotion
• DK
• I am not a successful swing trader as my brain fools me into taking the better looking trades and not the 3/10 ones which usually work out :(
• short term thesis
• Jumping into trades too early (before enough evidence is in) is a common problem.
• Inconsistent practices plus no mechanism to handle small losses as part of a larger successful plan.
• Follow a plan.
• Not having trade plan, rules
• Bad strategy
• Jumping in and out at the wrong time, at too large a position. Traders can do better by paying attention to logic of market moves, e.g., when sellers and buyers exhaust themselves on down and up moves.
• Don’t have a trading plan and if they do they don’t follow it consistently.
• Traders are there worst enemy… by far …. plus too much CNBC
• Lack of discipline. Turn off CNBC/Bloomberg/StockTwits, etc. Trade to your plan.
Question #5. Additional Comments/Questions/Suggestions?
• Nothing noted
Join us for this week’s shows:
Crowd Forecast News Episode #203
This week’s show will feature a discussion with the trading experts listed below about the most recent TimingResearch Crowd Forecast Newsletter report, where they think the S&P500 is headed, what they are watching for in the markets currently, and their best trading idea.
Date and Time:
– Monday, November 12th, 2018
– 1PM ET (10AM PT)
Moderator and Guests:
– Dave Landry of DaveLandry.com (moderator)
– John Thomas of MadHedgeFundTrader.com
– Jim Kenney of OptionProfessor.com
AYT is off this week but will be back on 11/20!
Analyze Your Trade Episode #56
When you register, you will be prompted to list the top 5 stocks that you are interested in trading. We will list the top 5 from all registrants and our experts will be prepared to offer their opinions on these trades.
Date and Time:
– Tuesday, November 20th, 2018
– 4:30PM ET (1:30PM PT)
Moderator and Guests:
– TBA
Partner Offer:
The Alpha Fibonacci Method works on any instrument, any time frame, and any platform with ultimate accuracy at trend inception and trend reversals.
You’ll see how on this online training.
Crowd Forecast News Report #267
The new TimingResearch report for the week has been posted, you can download the full PDF report with the link below or you can read the full report in this post below.
Click here to download report in PDF format: TRReport110418.pdf
Question #1. Which direction do you think the S&P500 index will move from this coming Monday’s open to Friday’s close (November 5th to 9th)?
Higher: 70.6%
Lower: 29.4%
Higher/Lower Difference: 41.2%
Question #2. Rate your confidence in your answer to Question #2 by estimating the probability you have correctly predicted next week’s market move.
Average of All Responses: 67.2%
Average For “Higher” Responses: 66.5%
Average For “Lower” Responses: 69.0%
Higher/Lower Difference: -2.5%
Responses Submitted This Week: 34
52-Week Average Number of Responses: 45.3
TimingResearch Crowd Forecast Prediction: 58% Chance Higher
This prediction is an attempt by the editor of this newsletter to use the full 5 year history of data collected from this project to forecast a probability estimate for whether this week’s sentiment is going to be correct and ultimately what the markets will do this coming week.
Details: Last week’s majority sentiment from the survey was 68.4% Lower, and the Crowd Forecast Indicator prediction was 67% Chance Higher; the S&P500 closed 1.51% Higher for the week. This week’s majority sentiment from the survey is 70.6% Higher with a greater average confidence from those who responded Lower. Similar conditions have been observed 26 times in the previous 266 weeks, with the majority sentiment being correct 58% of the time, and with an average S&P500 move of 0.29% Lower for the week (one of those rare conditions were the number of times the S&P500 moved Higher under the selected conditions was greater but the average of all the moves was Lower). Based on that history, the TimingResearch Crowd Forecast Indicator is forecasting a 58% Chance that the S&P500 is going to move Higher this coming week.

Raw Data Page (raw data files include full history spreadsheet and the above charts):
TimingResearch.com/data.
Full Weekly Results (full version of this chart available in the raw data spreadsheet for this week, “Date” field below lists the Monday of the week being predicted).
Overall Sentiment All-Time “Correct” Percentage: 51.5%
Overall Sentiment 52-Week “Correct” Percentage: 60.8%
Overall Sentiment 12-Week “Correct” Percentage: 72.7%
Only the previous 52 weeks of data are shown below, please download the raw data to see the full range of past data.
Weekly Reports Page: TimingResearch.com/reports
Raw Data Page: TimingResearch.com/rawdata
Current Survey Page: TimingResearch.com/currentsurvey
Any feedback: TimingResearch.com/contact
Email Alerts
Make sure you don’t miss all the future reports, show reminders, and bonus offers from TimingResearch, enter your email here:
By signing up you agree to receive newsletter and alert emails. You can unsubscribe at any time. Privacy Policies
NOTE: The following open-ended answers are solely the opinions of the anonymous respondents to this survey. Responses are mostly unedited, but some have been reformatted slightly for to make them easier to read. Some irrelevant responses (e.g. “none”), or anything obviously fake, or copy and pasted responses have been omitted. All-caps responses have been changed to all lowercase. All responses for each week, unedited, are available in the raw data spreadsheets at TimingResearch.com/data.
Question #3. For your answer to Question #1, please share what specific reason(s) you think the S&P500 will be heading the direction you chose.
“Higher” Respondent Answers:
• 1.US and China trade war has positive outlook according to president Trump. 2. The midterm election is getting close to be done and over with. 3. Traders sentiment is positive.
• bull melt up
• Do for a rebound
• 1. Seasonality 2. GOP retains and improves number of seats in both the House and Senate.
• S&P Making a rally attempt from oversold condition
• Pull back done. election elation will take over
• November is an up month
• Bounce up and cooling rhetoric.
• history
• buying
• Best six months of the year historically and buybacks
• There is massive volatility but eventually prices may go back to a minor high.
• Mid term elections usually +ve
• One of the uncertainties will be known…elections over.
• no blue wave
• I entered 50% confidence level higher because I think it will go BOTH higher AND lower. I think it will be all over the map until the end of the year.
“Lower” Respondent Answers:
• Trend reversal dead ahead
• Not enough buyers
• short signals from trend lines and indicators on the daily, weekly and monthly chart.
• Market trend down and short term trend top of pull back trend.
• Dems win house majority; Dow down 900 points
• Th downside correction continues as moving averages are penetrated.
• The S&P may have hit resistance on Friday morning, as then it fell most of the day. The strong jobs reports makes it more likely that the Fed will raise rates in Dec, which is should be a negative for the S&P.
• its between point 4 & point 5 on an Elliot wave; higher close + diminishing volume = no appetite for higher prices.
Partner Offer:
The Alpha Fibonacci Method works on any instrument, any time frame, and any platform with ultimate accuracy at trend inception and trend reversals.
You’ll see how on this online training.

Question #4. What type(s) of trading do to focus on and why? Have you tried other forms of trading that did not work as well for you?
• Options. Buy & hold didn’t work so well.
• option spreads.
• reverse toward a trend from a pull back and break out reversal of a pull back. sell options in high volatility and buy options in low volatility.
• long term investing, options
• Only focus on Basic Equities, day and swing trading. Sell options.
• Trend following. It flows with my lifestyle.
• day/news and B&H Investing my main successes Swing trading still a hit and miss :(
• Stock trading, usually for 2-5 day periods.
• counterintuitive
• Far out-of-money option selling might work well here with the increased volatility. Just need to make sure the options are FAR out-of-the-money. Like maybe two hundred points or so.
• options – most leverage
• Intraday and swing
• None really
• 1 and 2 worked well 1. Futures only now 2. Formerly options and mutual funds aggressive no loads. 3. Managed futures accounts did not work.
• Options. Short term gains were more predictable
• Very short term. Less than a minute is a good trade
• No
• Day Trading suits my personality. Would like to do some short term swing trading. 1-3 days
• the types of trading that i do are : 1) trend line on weekly and monthly charts. 2) combination of specific indicators – oscillators on daily charts, weekly charts and monthly charts.
Question #5. Additional Comments/Questions/Suggestions?
• have faith the market will move.
• look for pull back to close trade after 3 same direction days
• This is the most sensitive timing for markets
• Good luck.
• the trading that i do based on a combination of some specific indicators with specific settings, is extremely accurate in daily, weekly and monthly charts.
Join us for this week’s shows:
Crowd Forecast News Episode #202
This week’s show will feature a discussion with the trading experts listed below about the most recent TimingResearch Crowd Forecast Newsletter report, where they think the S&P500 is headed, what they are watching for in the markets currently, and their best trading idea.
Date and Time:
– Monday, November 5th, 2018
– 1PM ET (10AM PT)
Moderator and Guests:
– Sean Kozak of NeuroStreet.com (first time guest!)
– Lee Harris of EmojiTrading.com
– Rob Hanna of InvestiQuant.com & QuantifiableEdges.com (moderator)
Analyze Your Trade Episode #55
When you register, you will be prompted to list the top 5 stocks that you are interested in trading. We will list the top 5 from all registrants and our experts will be prepared to offer their opinions on these trades.
Date and Time:
– Tuesday, November 6th, 2018
– 4:30PM ET (1:30PM PT)
Moderator and Guests:
– Mike Pisani of AlphaShark.com & SmartOptionTrading.com
– Michael Filighera of LogicalSignals.com
– Jim Kenney of OptionProfessor.com
– Neil Batho of TraderReview.net
Partner Offer:
The Alpha Fibonacci Method works on any instrument, any time frame, and any platform with ultimate accuracy at trend inception and trend reversals.
You’ll see how on this online training.
Crowd Forecast News Report #266
Partner Offer: Do you need more capital to trade? Get funded in as little as 15 days, click here.
The new TimingResearch report for the week has been posted, you can download the full PDF report with the link below or you can read the full report in this post below.
Click here to download report in PDF format: TRReport102818.pdf
Question #1. Which direction do you think the S&P500 index will move from this coming Monday’s open to Friday’s close (October 29th to November 2nd)?
Higher: 31.6%
Lower: 68.4%
Higher/Lower Difference: -36.8%
Question #2. Rate your confidence in your answer to Question #2 by estimating the probability you have correctly predicted next week’s market move.
Average of All Responses: 69.7%
Average For “Higher” Responses: 70.0%
Average For “Lower” Responses: 69.6%
Higher/Lower Difference: 0.4%
Responses Submitted This Week: 38
52-Week Average Number of Responses: 45.8
TimingResearch Crowd Forecast Prediction: 67% Chance Higher
This prediction is an attempt by the editor of this newsletter to use the full 5 year history of data collected from this project to forecast a probability estimate for whether this week’s sentiment is going to be correct and ultimately what the markets will do this coming week.
Details: Last week’s majority sentiment from the survey was 56.7% Lower, and the Crowd Forecast Indicator prediction was 64% Chance Higher; the S&P500 closed 4.15% Lower for the week. This week’s majority sentiment from the survey is 68.4% Lower with a greater average confidence from those who responded Higher. Similar conditions have been observed 9 times in the previous 265 weeks, with the majority sentiment being correct 33% of the time, and with an average S&P500 move of 0.19% Higher for the week. Based on that history, the TimingResearch Crowd Forecast Indicator is forecasting a 67% Chance that the S&P500 is going to move Higher this coming week.
Raw Data Page (raw data files include full history spreadsheet and the above charts):
TimingResearch.com/data.
Full Weekly Results (full version of this chart available in the raw data spreadsheet for this week, “Date” field below lists the Monday of the week being predicted).
Overall Sentiment All-Time “Correct” Percentage: 51.7%
Overall Sentiment 52-Week “Correct” Percentage: 60.8%
Overall Sentiment 12-Week “Correct” Percentage: 72.7%
Only the previous 52 weeks of data are shown below, please download the raw data to see the full range of past data.
Weekly Reports Page: TimingResearch.com/reports
Raw Data Page: TimingResearch.com/rawdata
Current Survey Page: TimingResearch.com/currentsurvey
Any feedback: TimingResearch.com/contact
Email Alerts
Make sure you don’t miss all the future reports, show reminders, and bonus offers from TimingResearch, enter your email here:
By signing up you agree to receive newsletter and alert emails. You can unsubscribe at any time. Privacy Policies
NOTE: The following open-ended answers are solely the opinions of the anonymous respondents to this survey. Responses are mostly unedited, but some have been reformatted slightly for to make them easier to read. Some irrelevant responses (e.g. “none”), or anything obviously fake, or copy and pasted responses have been omitted. All-caps responses have been changed to all lowercase. All responses for each week, unedited, are available in the raw data spreadsheets at TimingResearch.com/data.
Question #3. For your answer to Question #1, please share what specific reason(s) you think the S&P500 will be heading the direction you chose.
“Higher” Respondent Answers:
• Market is very oversold and need to rebound.
• good earnings
• Over Sold Bounce / Positive Economic News
• No T.A . Just monkeys throwing darts. And the teeter-totter rhythm since there doesn’t seem to be rhyme but no reason to the market.Not to point fingers, but the mkt might be mimicking the chaotic behaviour of the powers that be ?
• Mid-term Elections
• October ends midweek
• oversold and SC rally brewing
• dead cat bounce
• Markets will front run the elections tax cut continuation trade deals and consumer confidence and Euro GB Italy resolutions
“Lower” Respondent Answers:
• It has had 2 dips and i beleive it is over priced.
• The stock market is always going up and down all the time
• Market instability of late predicts a break to the downside soon.
• wave
• Trend is still down & quidance will weigh on future earnings due to tariff concerns & trade war with China ….then gov’t deficits will take the spotlight at some point next year
• We’re in a down trend
• The markets remain in the beginning stages of a larger correction.
• Trump’s Trade War. China will not capitulate like wimpy Canada and Mexico.
• The downside correction continues as moving averages have been violated. Market will continue the downward path until the public says “just get me out”.
• The forces that have trimmed the market this month are still in play. Next support appears to be about 2565, a pivot seen in Nov 2017, Feb & Apr 2018.
• elliott wave prognosis and sentiment
• Unknowns on the world stage are still dominant. Even strong Earnings are not changing the trend for the moment. Stock Prices are soon Ready for the end-year Rally.
• Declining trend increased by quarterly earnings failing to ignite market PLUS mid-term election uncertainty.
• historical drop this time of year
• seems to be selling ahead to make an impact on the election
• MACD, momentum, fear
Partner Offer:
Did you ever think that becoming a professional trader is out of reach? Think again.
Click here to learn how.
TopstepTrader has funded more than 1,800 traders just like you with live trading capital. They take all the risk. You keep the first $5,000 in profits and 80% thereafter.
Question #4. Have you ever, or do you currently, use any type of auto-trading execution with your trading strategies?
• no
• no
• no
• No & no
• No.
• Have tried auto trading with no success.
• No
• No. Trade news and trend.
• no
• Yes, I use auto trading algorithms written specially for trading my strategies.
• Yes
• yes
• No.
• Yes
• rising interest rates and oil, oil has pulled back, but combination will pull down markets.
• no
• No
• no
• no
• yes
• Yes I do.
Question #5. Additional Comments/Questions/Suggestions?
• i’m just getting started
• I would like to know if any auto trades work.
• I only trade options, hardly no stocks, less risk, trade tactics on down, up and sideways,
• please email survey results and list associated comments too, without names of who is saying. …so bullish reasons give, etc thank you
• 80% of the S&P 500 stocks down 10% or more
Join us for this week’s shows:
Crowd Forecast News Episode #201
This week’s show will feature a discussion with the trading experts listed below about the most recent TimingResearch Crowd Forecast Newsletter report, where they think the S&P500 is headed, what they are watching for in the markets currently, and their best trading idea.
Date and Time:
– Monday, October 29th, 2018
– 1PM ET (10AM PT)
Moderator and Guests:
– Michael Filighera of LogicalSignals.com (moderator)
– Jim Kenney of OptionProfessor.com
– Roy Swanson of SteadyTrader.com
– Damon Pavlatos of FuturePathTrading.com
Analyze Your Trade Episode #
When you register, you will be prompted to list the top 5 stocks that you are interested in trading. We will list the top 5 from all registrants and our experts will be prepared to offer their opinions on these trades.
Date and Time:
– Tuesday, October 30th, 2018
– 4:30PM ET (1:30PM PT)
Moderator and Guests:
– Dean Jenkins of FollowMeTrades.com (moderator)
– Larry Gaines of PowerCycleTrading.com
Partner Offer:
Did you ever think that becoming a professional trader is out of reach? Think again.
Click here to learn how.
TopstepTrader has funded more than 1,800 traders just like you with live trading capital. They take all the risk. You keep the first $5,000 in profits and 80% thereafter.
Crowd Forecast News Report #265
The new TimingResearch report for the week has been posted, you can download the full PDF report with the link below or you can read the full report in this post below.
Click here to download report in PDF format: TRReport102118.pdf
Question #1. Which direction do you think the S&P500 index will move from this coming Monday’s open to Friday’s close (October 22nd to October 26th)?
The order of possible responses to this question on the survey were randomized for each viewer.)
Higher: 43.3%
Lower: 56.7%
Higher/Lower Difference: -13.3%
Question #2. Rate your confidence in your answer to Question #2 by estimating the probability you have correctly predicted next week’s market move.
Average of All Responses: 65.7%
Average For “Higher” Responses: 66.2%
Average For “Lower” Responses: 65.3%
Higher/Lower Difference: 0.9%
Responses Submitted This Week: 32
52-Week Average Number of Responses: 46.3
TimingResearch Crowd Forecast Prediction: 64% Chance Higher
This prediction is an attempt by the editor of this newsletter to use the full 5 year history of data collected from this project to forecast a probability estimate for whether this week’s sentiment is going to be correct and ultimately what the markets will do this coming week.
Details: Last week’s majority sentiment from the survey was 51.4% Higher, and the Crowd Forecast Indicator prediction was 54% Chance Higher; the S&P500 closed 0.14% Higher for the week. This week’s majority sentiment from the survey is 56.7% Lower with a greater average confidence from those who responded Higher. Similar conditions have been observed 36 times in the previous 264 weeks, with the majority sentiment being correct 36% of the time, and with an average S&P500 move of 0.07% Higher for the week. Based on that history, the TimingResearch Crowd Forecast Indicator is forecasting a 64% Chance that the S&P500 is going to move Higher this coming week.

Raw Data Page (raw data files include full history spreadsheet and the above charts):
TimingResearch.com/data.
Full Weekly Results (full version of this chart available in the raw data spreadsheet for this week, “Date” field below lists the Monday of the week being predicted).
Overall Sentiment All-Time “Correct” Percentage: 51.5%
Overall Sentiment 52-Week “Correct” Percentage: 60.8%
Overall Sentiment 12-Week “Correct” Percentage: 63.6%
Only the previous 52 weeks of data are shown below, please download the raw data to see the full range of past data.
Weekly Reports Page: TimingResearch.com/reports
Raw Data Page: TimingResearch.com/rawdata
Current Survey Page: TimingResearch.com/currentsurvey
Any feedback: TimingResearch.com/contact
Email Alerts
Make sure you don’t miss all the future reports, show reminders, and bonus offers from TimingResearch, enter your email here:
By signing up you agree to receive newsletter and alert emails. You can unsubscribe at any time. Privacy Policies
NOTE: The following open-ended answers are solely the opinions of the anonymous respondents to this survey. Responses are mostly unedited, but some have been reformatted slightly for to make them easier to read. Some irrelevant responses (e.g. “none”), or anything obviously fake, or copy and pasted responses have been omitted. All-caps responses have been changed to all lowercase. All responses for each week, unedited, are available in the raw data spreadsheets at TimingResearch.com/data.
Question #3. For your answer to Question #1, please share what specific reason(s) you think the S&P500 will be heading the direction you chose.
“Higher” Respondent Answers:
• Great earnings
• good earnings reports
• Bargain Hunting & Solid Earnings Reports
• history
• at support now
• Best six months of the year starts November
“Lower” Respondent Answers:
• Sucker Rally failed
• Doesn’t seem to be getting much attention.
• Market sentiment negative.
• rising oil prices and rising interest rates
• Trend appears to be down
• Earnings disappointments and downgrades
• still in October
• The downside correction continues as moving averages are violated.
• Market still appears to be in a downtrend; so favoring continuation. Not highly confident, as positive earnings announcements this coming week could lift market.
Partner Offer:

Tuesday, October 23rd at 7:00pm ET: They’re insiders – CEOs, CFOs, board members and other executives with access to key, non-public information about their companies. Information they use to get very rich.
Question #4. What procedures do you use to monitor and evaluate your trading results and progress over time?
• I don’t really have one. I just go with instinct
• Increases in net worth
• Charts and VectorVest
• Aggregate Percentage yield on my beat stocks
• Risk/reward ratios
• I track every trade & calculate results at end of each month
• market moving my stock picks higher and if the companies continue to grow with increased revenues.
• Document all trades in spreadsheet
Question #5. Additional Comments/Questions/Suggestions?
• none
Join us for this week’s shows:
Crowd Forecast News Episode #200
This week’s show will feature a discussion with the trading experts listed below about the most recent TimingResearch Crowd Forecast Newsletter report, where they think the S&P500 is headed, what they are watching for in the markets currently, and their best trading idea.
Date and Time:
– Monday, October 22nd, 2018
– 1PM ET (10AM PT)
Moderator and Guests:
– Serge Berger of TheSteadyTrader.com (first time guest!)
– Neil Batho of TraderReview.net
– Simon Klein of TradeSmart4x.com
– Dave Landry of DaveLandry.com (moderator)
Analyze Your Trade Episode #53
When you register, you will be prompted to list the top 5 stocks that you are interested in trading. We will list the top 5 from all registrants and our experts will be prepared to offer their opinions on these trades.
Date and Time:
– Tuesday, October 23rd, 2018
– 4:30PM ET (1:30PM PT)
Moderator and Guests:
-TBA
Partner Offer:
Tuesday, October 23rd at 7:00pm ET: They’re insiders – CEOs, CFOs, board members and other executives with access to key, non-public information about their companies. Information they use to get very rich.
Crowd Forecast News Report #264
Partner Offer: Do you have enough capital to trade? If not, click here.
The new TimingResearch report for the week has been posted, you can download the full PDF report with the link below or you can read the full report in this post below.
Click here to download report in PDF format: TRReport101418.pdf
Question #1. Which direction do you think the S&P500 index will move from this coming Monday’s open to Friday’s close (October 15th to October 19th)?
The order of possible responses to this question on the survey were randomized for each viewer.)
Higher: 51.4%
Lower: 48.6%
Higher/Lower Difference: 2.9%
Question #2. Rate your confidence in your answer to Question #2 by estimating the probability you have correctly predicted next week’s market move.
Average of All Responses: 66.4%
Average For “Higher” Responses: 64.4%
Average For “Lower” Responses: 68.3%
Higher/Lower Difference: -3.9%
Responses Submitted This Week: 37
52-Week Average Number of Responses: 46.5
TimingResearch Crowd Forecast Prediction: 54% Chance Higher
This prediction is an attempt by the editor of this newsletter to use the full 5 year history of data collected from this project to forecast a probability estimate for whether this week’s sentiment is going to be correct and ultimately what the markets will do this coming week.
Details: Last week’s majority sentiment from the survey was 51.4% Lower, and the Crowd Forecast Indicator prediction was 66% Chance Higher; the S&P500 closed 3.84% Lower for the week. This week’s majority sentiment from the survey is 51.4% Higher with a greater average confidence from those who responded Lower (this just happens to be the exact opposite of last week). Similar conditions have been observed 26 times in the previous 263 weeks, with the majority sentiment being correct 54% of the time, and with an average S&P500 move of 0.06% Higher for the week. Based on that history, the TimingResearch Crowd Forecast Indicator is forecasting a 54% Chance that the S&P500 is going to move Higher this coming week.
Raw Data Page (raw data files include full history spreadsheet and the above charts):
TimingResearch.com/data.
Partner Offer: In 2015, he claimed exactly $838,353 in capital gains. In four years – he turned $15,253 into $2,855,475. Watch Kyle Dennis’ presentation:
“Learn the 3-Step Plan I Used to Turn $15,253 into $2,855,475 Trading Biotech Stocks!“

Full Weekly Results (full version of this chart available in the raw data spreadsheet for this week, “Date” field below lists the Monday of the week being predicted).
Overall Sentiment All-Time “Correct” Percentage: 51.4%
Overall Sentiment 52-Week “Correct” Percentage: 60.8%
Overall Sentiment 12-Week “Correct” Percentage: 54.5%
Only the previous 52 weeks of data are shown below, please download the raw data to see the full range of past data.
Weekly Reports Page: TimingResearch.com/reports
Raw Data Page: TimingResearch.com/rawdata
Current Survey Page: TimingResearch.com/currentsurvey
Any feedback: TimingResearch.com/contact
Email Alerts
Make sure you don’t miss all the future reports, show reminders, and bonus offers from TimingResearch, enter your email here:
By signing up you agree to receive newsletter and alert emails. You can unsubscribe at any time. Privacy Policies
NOTE: The following open-ended answers are solely the opinions of the anonymous respondents to this survey. Responses are mostly unedited, but some have been reformatted slightly for to make them easier to read. Some irrelevant responses (e.g. “none”), or anything obviously fake, or copy and pasted responses have been omitted. All-caps responses have been changed to all lowercase. All responses for each week, unedited, are available in the raw data spreadsheets at TimingResearch.com/data.
Question #3. For your answer to Question #1, please share what specific reason(s) you think the S&P500 will be heading the direction you chose.
“Higher” Respondent Answers:
• Whether S&P will go higher this week depends on earning reports from NFLX and PG. It depends especially on future guidance indicated by these companies.
• Market has corrected, and is ready to move on up.
• I think things are still leaning Republican and it may stay bullish or go back up some maybe I guess
• weak bounce, bearish flad
• Friday afternoon’s rally off of support gave us a hammer. Continued upside is expected. Next resistance could be at 2885-90, the midpoint of the Bollinger band.
• I believe the market is manipulated to some degree by Wall Street. The some for the silver market (J.P. Morgan, etc.)
• Rebound time.
• Market is extreme oversold.
• Bounce off resistance
• done selling
“Lower” Respondent Answers:
• broken trend lines on bigger tech stocks as well as macro events going on short term. Economy stable for earnings reports starting should consolidate markets in month ahead
• The big question after Wed/Thurs drop is 1) is this just a correction, or 2) is this the crash so many were expecting. We’re not going to know the answer to the above until the data is in at the end of next week. I suspect it’s a “correction” and the next crash will come inside the next 1 to 3 years during which there could be several more corrections. So next week I’m expecting the sell off to continue but reach some point of consolidation / stabilization. After that the markets could continue upwards with a bit more volatility than was occuring prior to this week.
• Interest rate rise uncertainty
• The downtrend that started after the Presidential emergency tweet on that Wednesday 10 days ago will continue. It will end when the public says “just get me out”.
• Retest of the recent low
• too much debt economic instability consumer spending wanes stocks will be affected negatively
• October swoon
• Lower highs & lower lows & below 100 day moving average & at 200 day moving average
• Overvalued market
• History shows this as a bad week.
• I really dont know y but that s wut i think it will b
• High volatility and big downdrafts make the markets look risky to the downside right now
• Appears to have entered “a” wave
• Last week drop
No Prediction:
• I gave no answer because the market has been on such a roller coaster ride that I don’t even want to hazard a guess for such a short term.
Partner Offer: In 2015, he claimed exactly $838,353 in capital gains. In four years – he turned $15,253 into $2,855,475. Watch Kyle Dennis’ presentation:
“Learn the 3-Step Plan I Used to Turn $15,253 into $2,855,475 Trading Biotech Stocks!“
Question #4a. Do you think the drop in the markets this week were the start of a longer downtrend or a minor correction on the way to new highs (i.e. 6 months from now do you think the S&P500 will be higher or lower than today)?
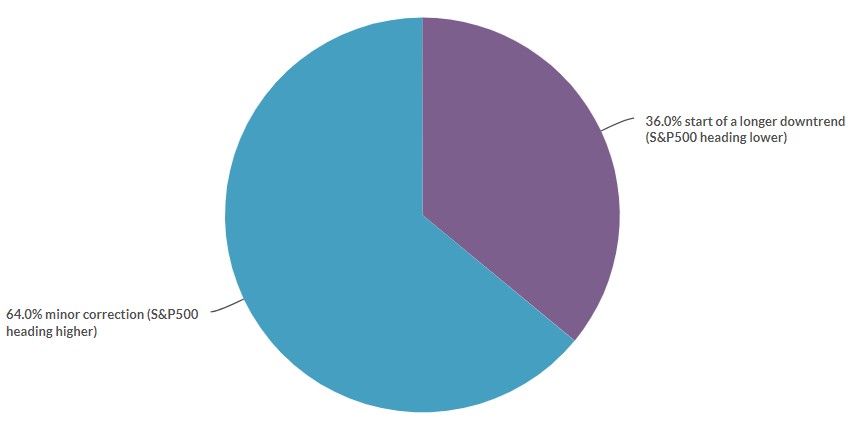
Question #4b. Why?
“Minor correction (S&P500 heading higher)” Respondent Answers:
• October typically has been a volatile month for the stock market. Additionally, there have been pullbacks to some extent prior to earning season. Investing community is a bit more wary prior to this earning season because of potential warnings which companies might issue because of tariffs and the trade war. I am hoping the market can digest any of these warnings and continue its climb up. Especially tech stocks such as Apple, AMZN, & Microsoft.
• Republicans will be victorious in my opinion are better candidates say especially against Baria
• explained in previous comment
• Got a feeling
• nothing changed fundamentally
• In previous instances of these bounces off of support, the market has moved up for a month or more. After that, it gets quite unpredictable.
• Market was overbought to the max. The downtrend will continue and will end when the public says “just get me out”. Then the market can return to new highs.
• Earnings & economy are strong.
“Start of a longer downtrend (S&P500 heading lower)” Respondent Answers:
• too much debt currency will suffer trade war bonds, pensions, banks will suffer less consumer spending and lose confidence
• If trade war with China, inflation will go higher & lower profits which will cut P/E ratios.
• Interest rate increases, and perception the mid-year election results are obvious.
• .atket overvalued for too long and inverters are moving to safe havens
• Over priced stocks
• Bull is too long in the tooth
Question #5. Additional Comments/Questions/Suggestions?
• The big CRASH I’m expecting still has 1 to 3 years to occur and I believe it will occur after the offshore money coming into the US markets begins drying up. The US will be the last stop in the search for a safe haven. That’s when what is happening that’s beginning to occur in troubled economies around the world begins finally to occur here. At that point the economic crisis will be worldwide. No more safe havens to flee too.
Join us for this week’s shows:
Crowd Forecast News Episode #199
This week’s show will feature a discussion with the trading experts listed below about the most recent TimingResearch Crowd Forecast Newsletter report, where they think the S&P500 is headed, what they are watching for in the markets currently, and their best trading idea.
Date and Time:
– Monday, October 15th, 2018
– 1PM ET (10AM PT)
Moderator and Guests:
– George Papazov of TRADEPRO Academy (first time guest!)
– Brad Powell of ETFDynamics.com (first time guest!)
– Toni Hansen of ToniHansen.com
– E. Matthew “Whiz” Buckley of TopGunOptions.com (moderator)
Analyze Your Trade Episode #52
When you register, you will be prompted to list the top 5 stocks that you are interested in trading. We will list the top 5 from all registrants and our experts will be prepared to offer their opinions on these trades.
Date and Time:
– Tuesday, October 16th, 2018
– 4:30PM ET (1:30PM PT)
Moderator and Guests:
– Dean Jenkins of FollowMeTrades.com (moderator)
– Jim Kenney of OptionProfessor.com
– Neil Batho of TraderReview.net
Partner Offer: In 2015, he claimed exactly $838,353 in capital gains. In four years – he turned $15,253 into $2,855,475. Watch Kyle Dennis’ presentation:
“Learn the 3-Step Plan I Used to Turn $15,253 into $2,855,475 Trading Biotech Stocks!“